Thursday February 20th – They’re All Running Swiftly
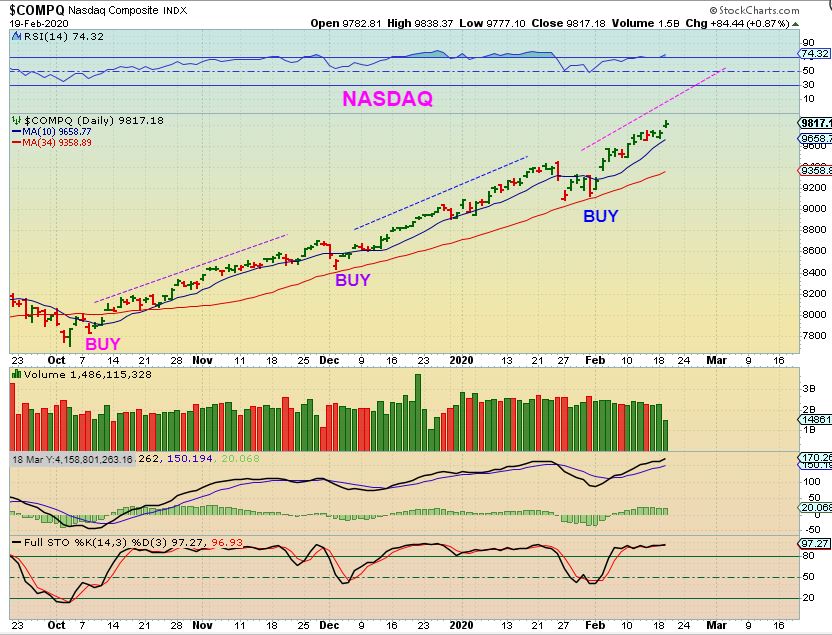
NASDAQ – The General Markets continue higher and as recommended, when they are these strong a stop under the 13 sma will keep you in the trade. NASDAQ & SPX have different dcl dates, but going by SPX this would be day 12
.
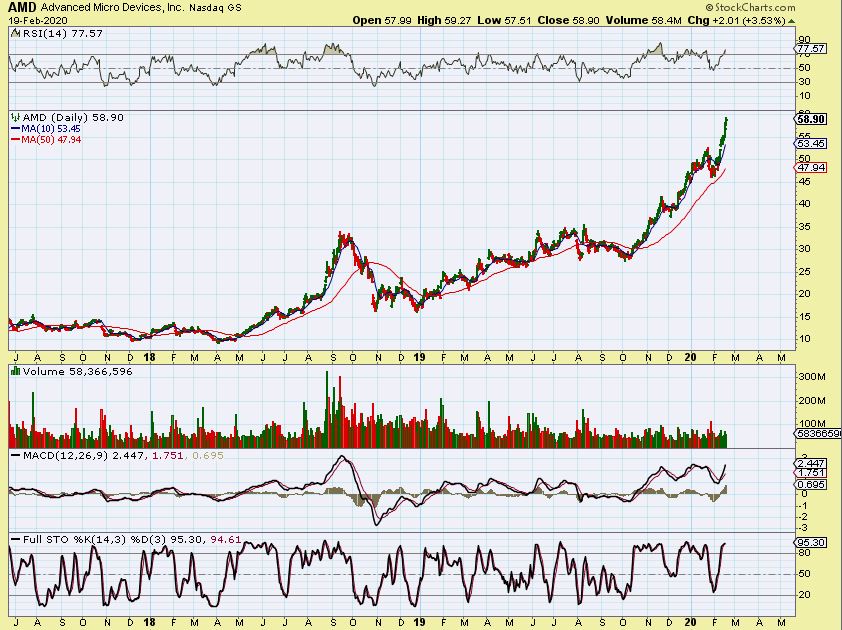
I’ve been discussing AMD as a favorite of mine that I think could go parabolic if the markets do. Lets discuss that…
.
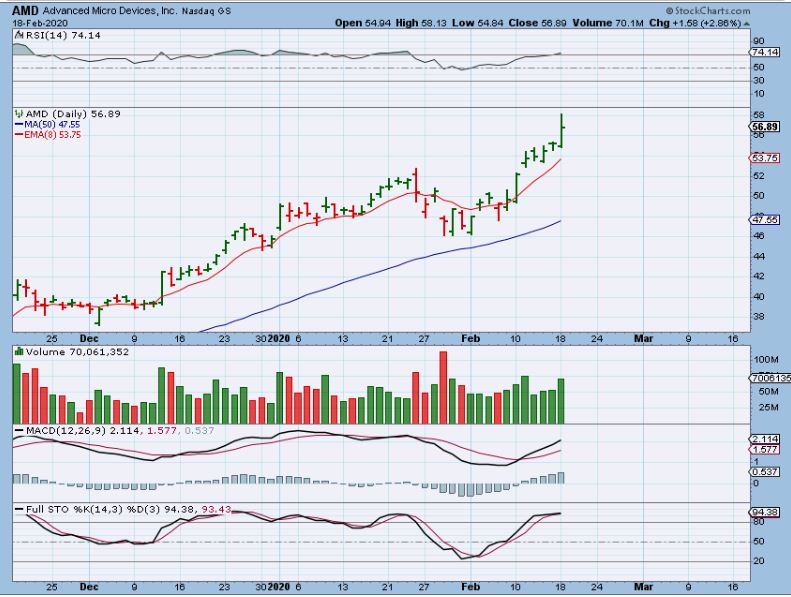
AMD – Yesterday I showed this chart of AMD and it remains bullish. I also showed the next one recently…,
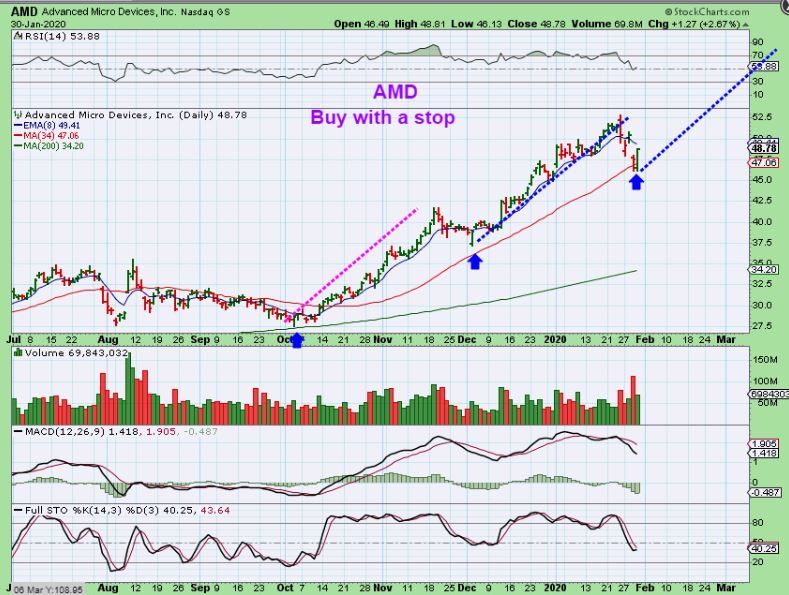
AMD – I used this chart in January to show AMD as a BUY & a target of $62
AMD – As it runs higher now, it does seem to be getting into a steeper climb, so I do believe that this may be starting a parabolic run too. It is starting to resemble Tesla from a distance. 🙂
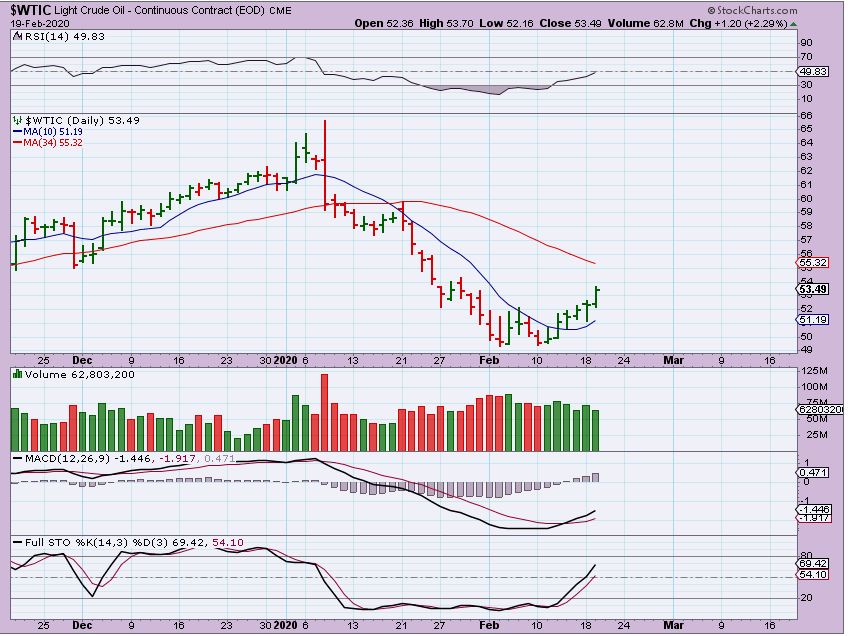
WTIC – Oil continued higher out of the DCL, this would be day 10, with 6 days in a row green. That said…
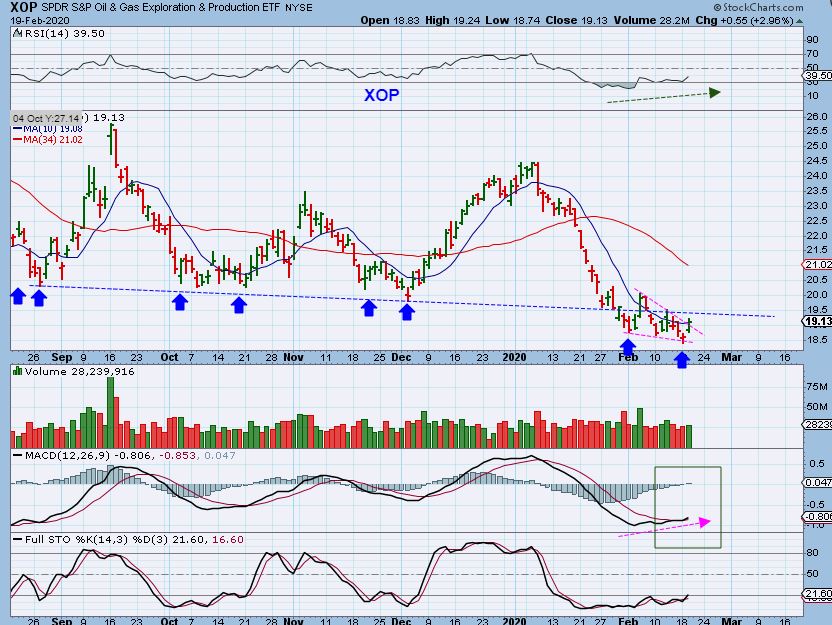
XOP – The XOP has been dropping with Oil rising, however I pointed out yesterday that it looks to be a buy with that descending wedge & MACD divergence. I think this is best left to the day traders until it gets further confirmation with a push above that blue line. What about Oil / Energy stocks that have been ugly?
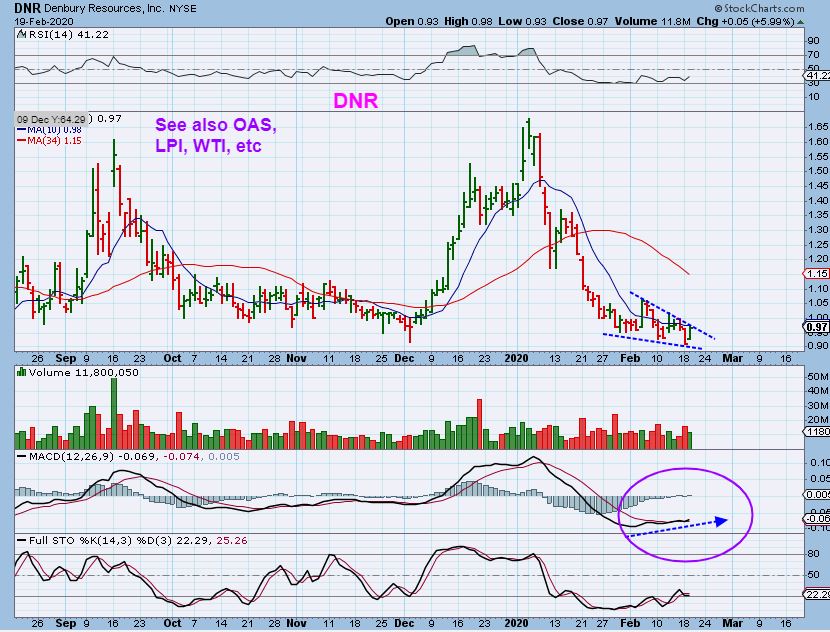
DNR – Oil stocks are possibly shaping up with descending wedges and MACD rising during a sell off too. You can watch the watch list of stocks that we have discussed in this sector. A few are on the chart. At this point, I feel that this has minimal downside risk, especially with a stop.
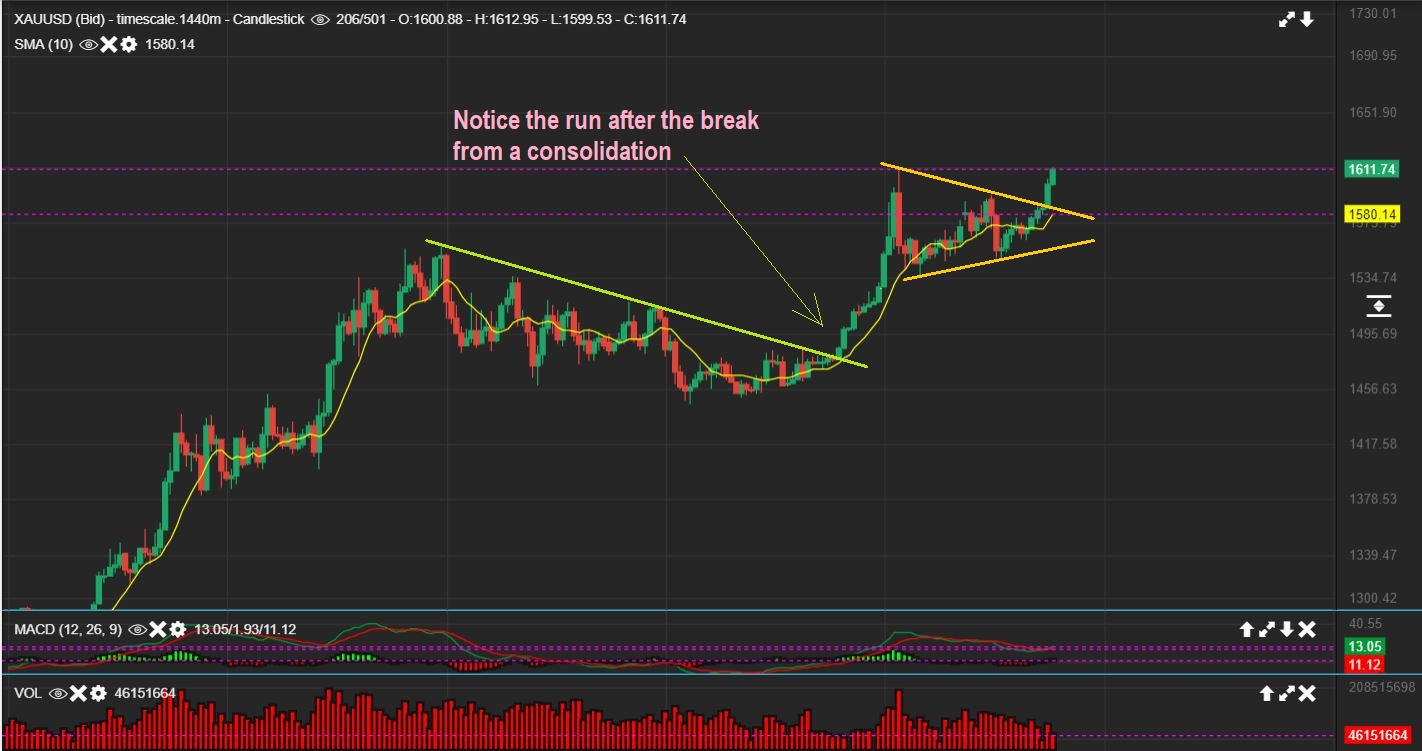
GOLD – Gold broke higher as expected with Tuesdays move above that triangle. This is obviously Bullish with Gold breaking higher with the USD & General Markets running higher too. If it runs like the last run, the gains in Miners can be exceptional.
.
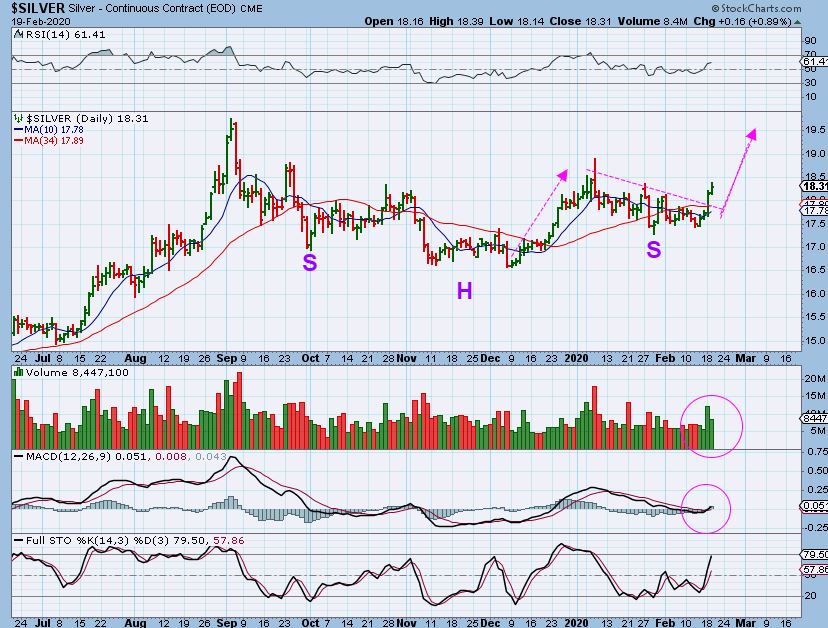
SILVER – This looks like a GIANT inverse H&S, so yesterday I mentioned that the beaten down Silver Stocks could kick back into gear once this gets running. We are aware that bad earnings report could hinder any individual Miner.
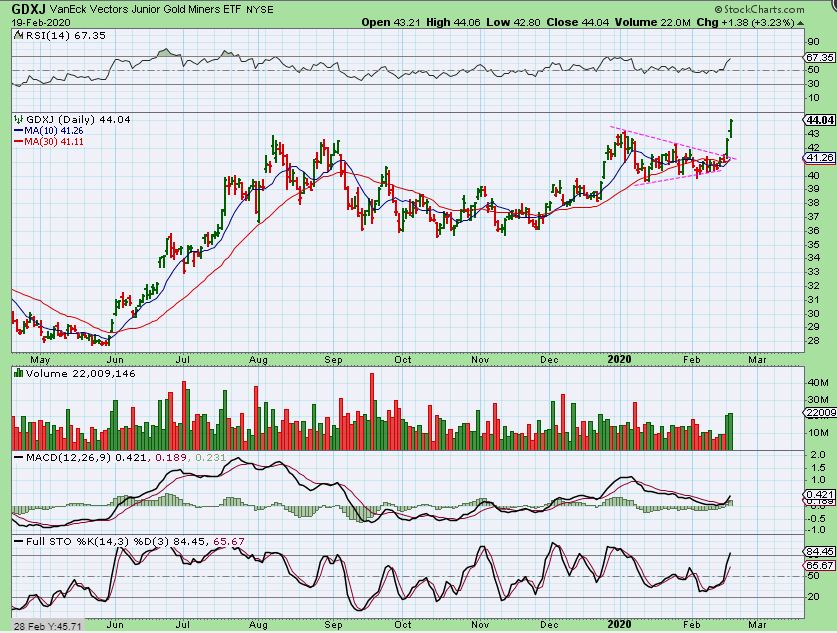
GDXJ – beautiful follow through to the miners ETFs GDX & GDXJ (and SILJ is doing ok too). We see a solid increase in volume , a MACD cross and a cup & handle type chart pattern. Bullish. 🙂
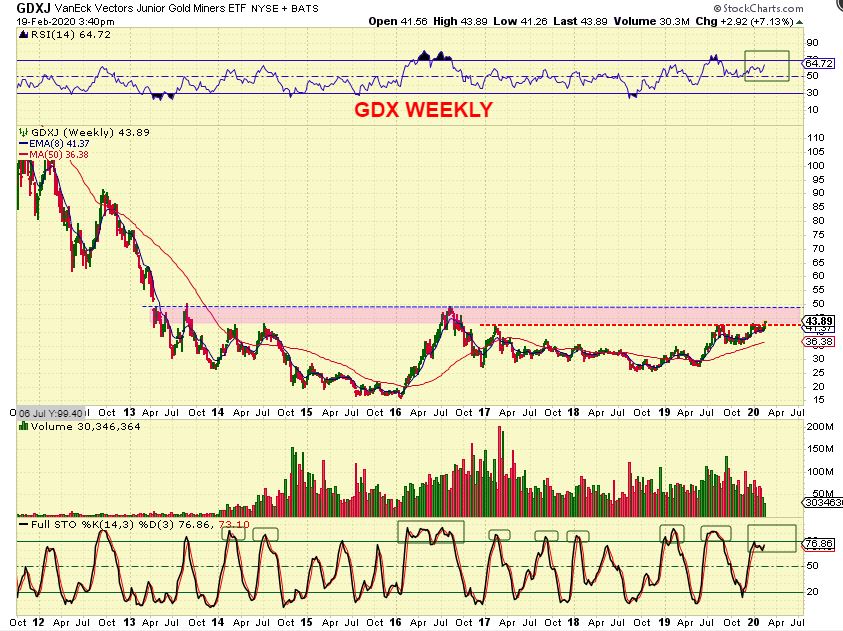
GDXJ WEEKLY – The weekly will help you to see that this is not overbought on a weekly basis. I see $52 as a reasonable target, but If this convincingly breaks through the pink area, it could back test & keep going ( Maybe in the next daily cycle).
.
In recent reports over the past 2 or 3 weeks, I have had many many bullish low risk set ups in the General Market and Miners. Plenty are doing very well, I will include a few below that can still be bought. Tomorrow, if the markets do not show any meaningful change (significant drop), I will skip the general review and just post several Set ups for Friday. Everything seems to be running higher together at this point, some stocks may be just getting ready to join the run. Tuesday & Wednesday were a lot of fun, so hopefully we can continue to watch a market melt up, and … Enjoy your Thursday trading!
.
~ALEX
.
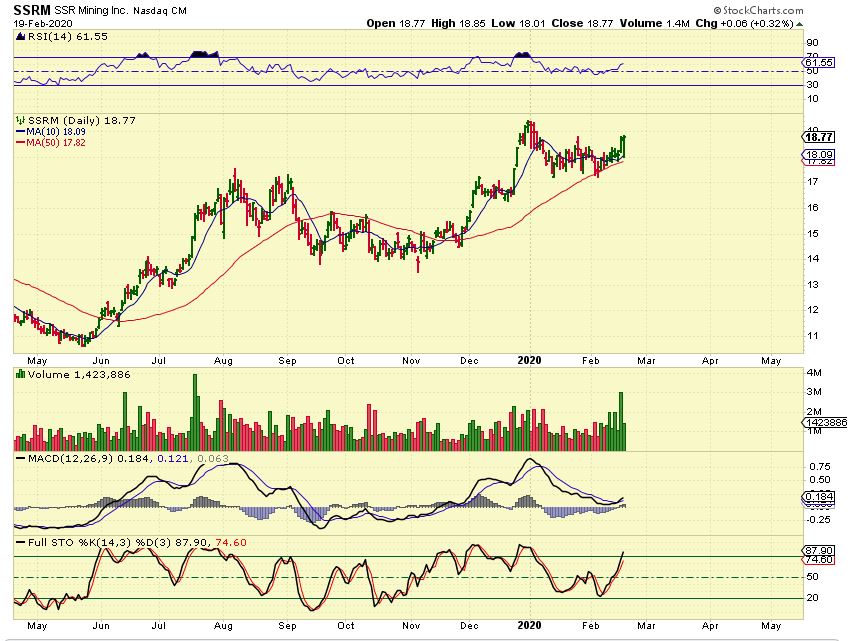
SSRM – Earnings are due Thursday Feb 20 (today), but this looks ready to go if they release good numbers. I see a large Cup & Handle where the handle found support on the 50sma. I think it is waiting for ‘earnings’, but it looks very good.
.
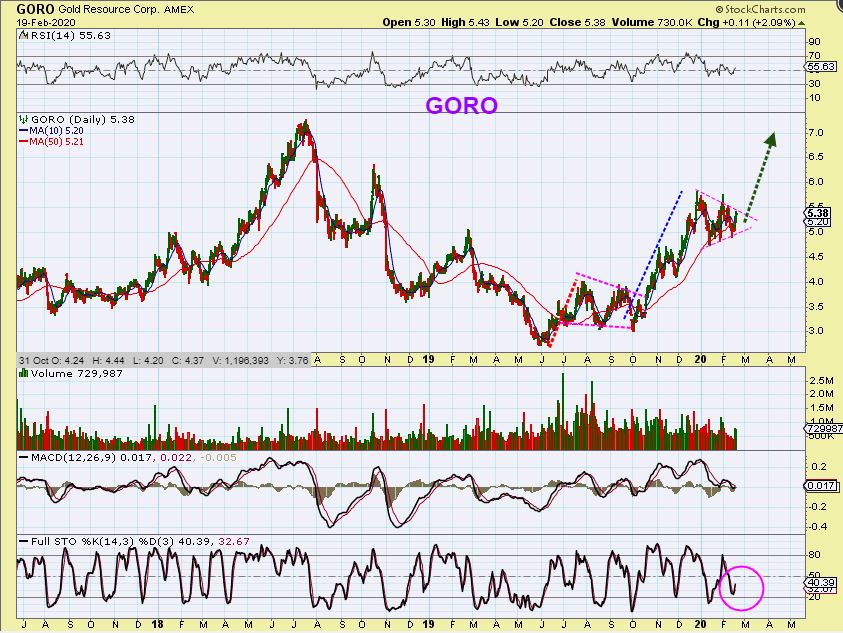
GORO has not joined the break higher yet, but a break from here could run to the 2018 highs or more. This is near oversold conditions, not overbought.
,
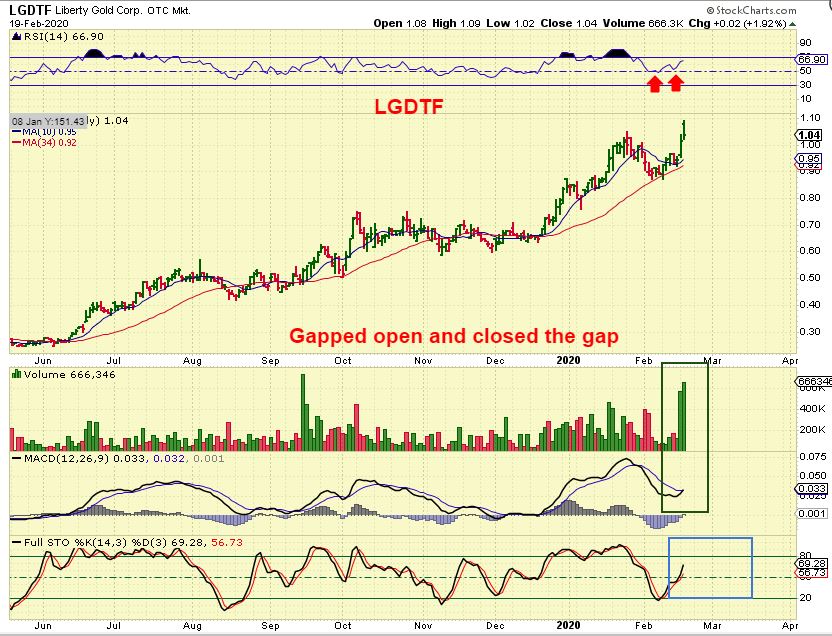
LGDTF – I added to LGDTF as it dropped to gap fill. It only closed up 2%, but I still think that this will run higher. We are not overbought here.
.
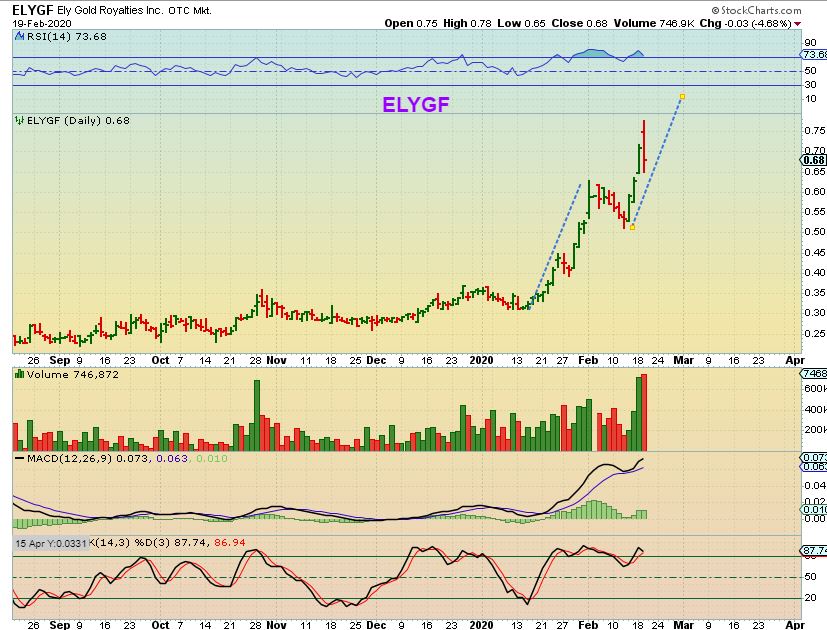
ELYGF – I just want to point out that ELYGF is overbought, and reversed, but it didn’t reach the target that I thought it would. It can still do so, but this was a heavy volume Pop & Drop, so it may not reach upper targets this time ( High volume Pop & Drop reversals can be tops). Excellent run!
.
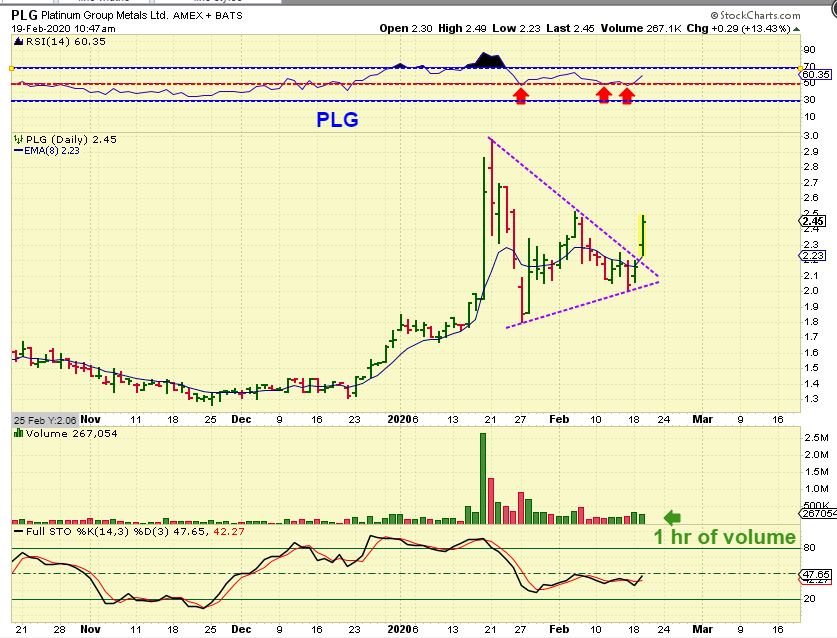
PLG – From yesterday, this has strong possibilities. That January POP was from their last earnings.
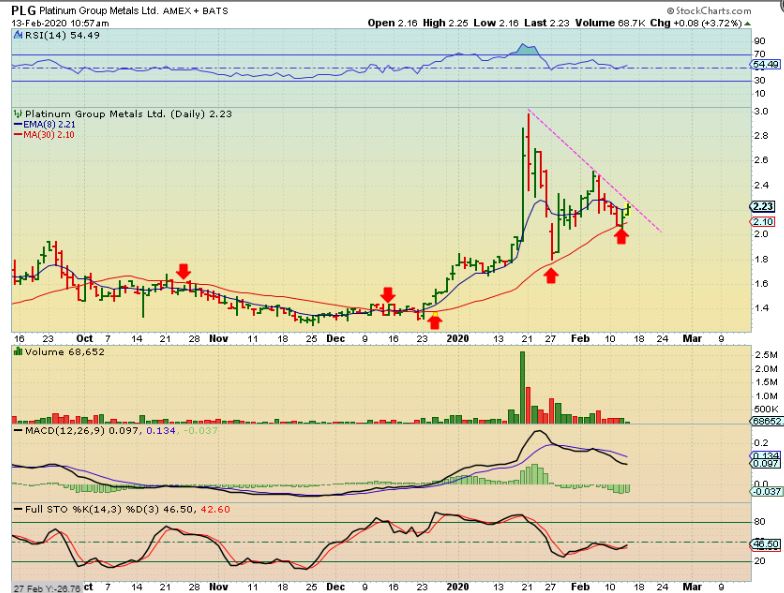
PLG – It broke out with Big volume Wednesday, filled that gap, and was up 13% quickly. I bought & added to this immediately when that gap filled & wrote that in the live area.
.
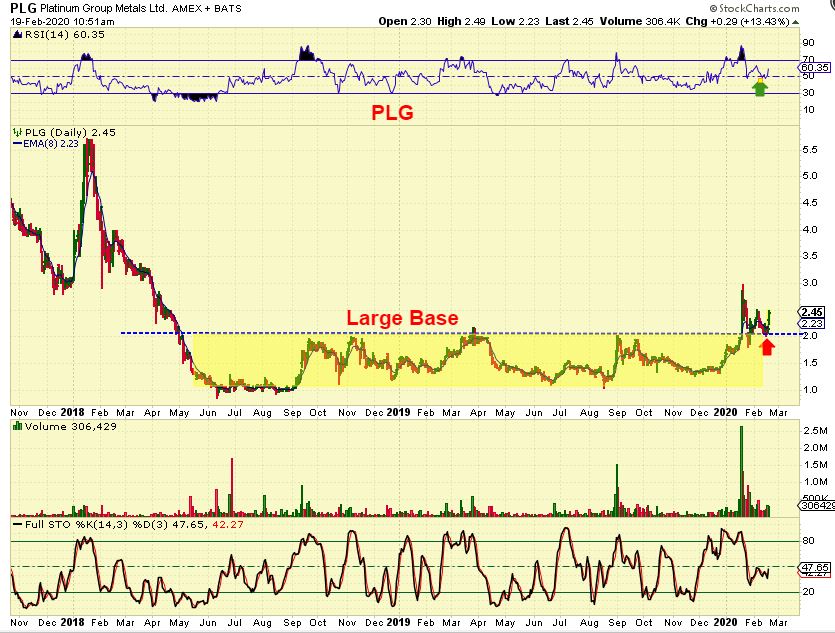
PLG BIGGER PICTURE – This was a break out & Back test of a massive base, so I think that this can really run over time. Notice that it is not even close to overbought yet either.
.
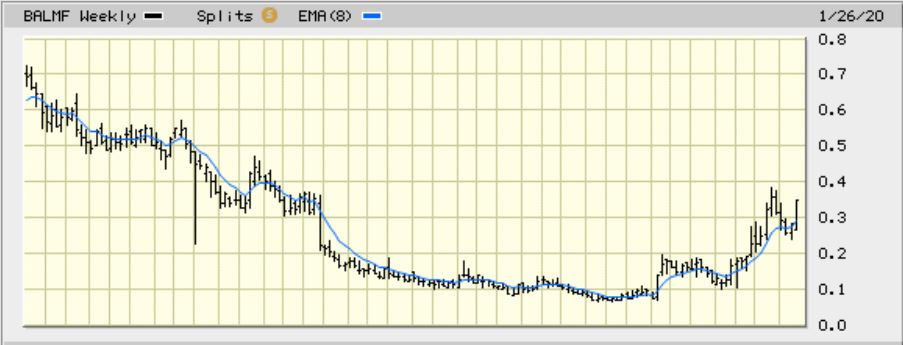
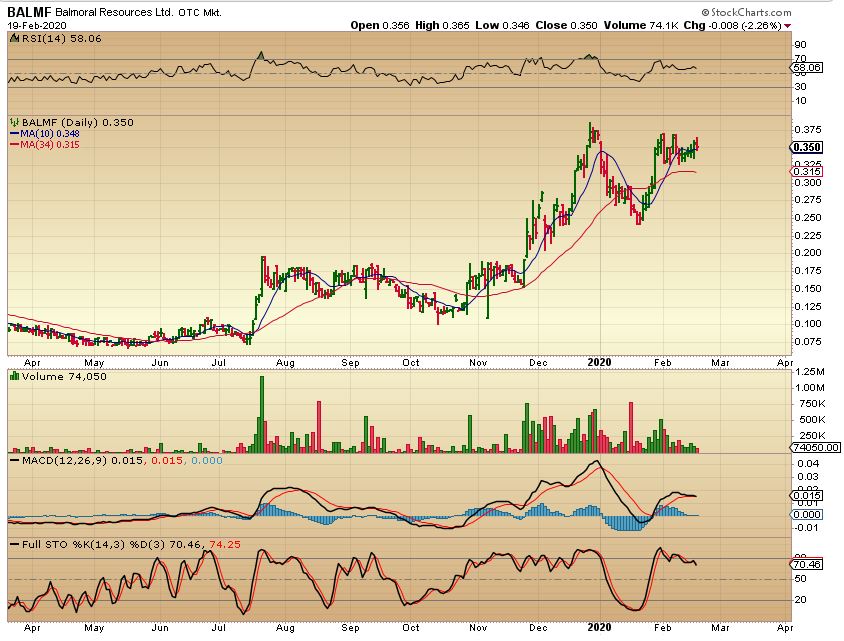
BALMF WEEKLY IN JANUARY – This was a buy breaking from the base and here I was showing the big picture potential for BALMF
.
BALMF – Currently it formed a bit of a ragged v-shaped cup & handle during the recent consolidation. If this breaks higher, it can run quickly, so it may be a good one for those in front of their screen and see it breaking out (or buy this handle and hope that it pops higher). It is a good set up, earnings date unknown).
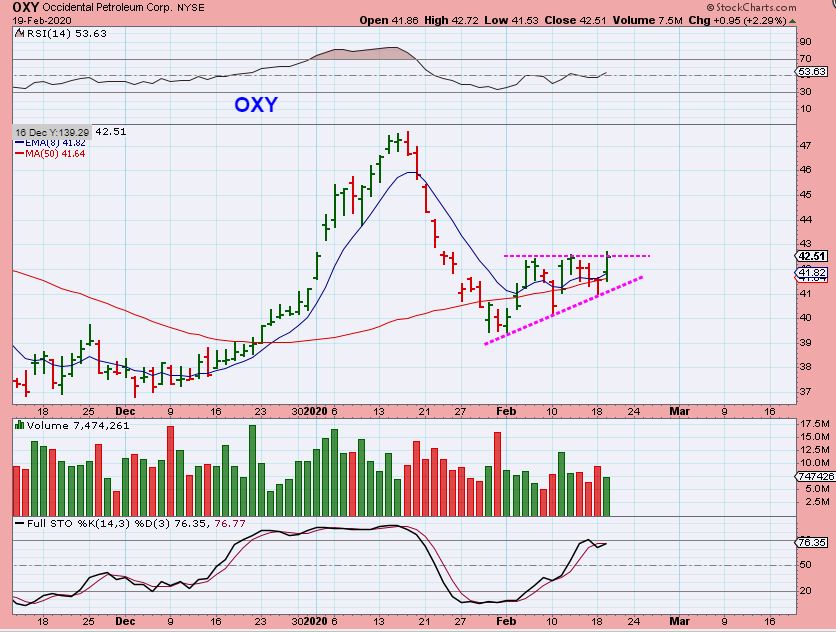
OXY – This could be a good set up right here. It ran from $37 to over $47 December to January but then sold off to the 50sma. It looks ready to break higher. OXY is a buy (maybe just a trade for a few days?) if it does.
.
** PAGS – I had this in a report last week. A BUY bouncing along the 50 sma at $33.
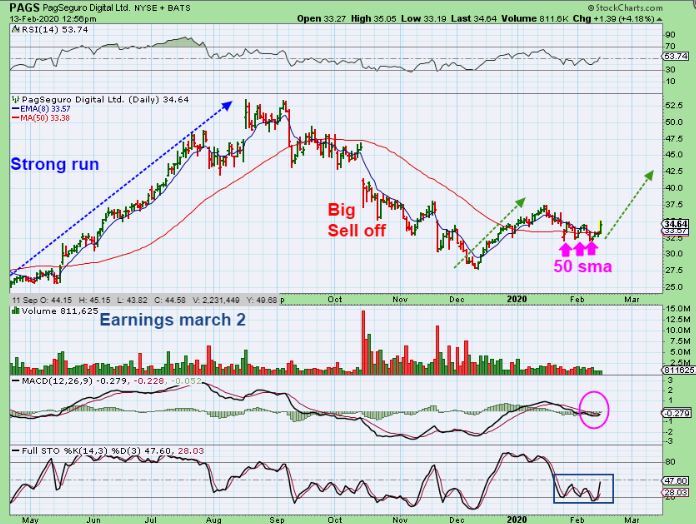
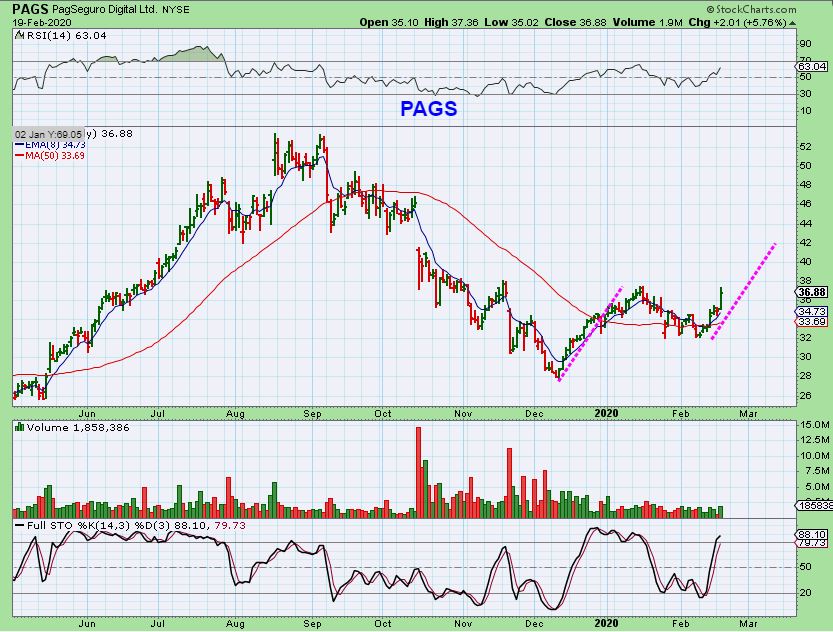
** PAGS – It bull flagged for a couple of days and Popped Wednesday. It is a buy and I have March 2 listed as earnings release.
.
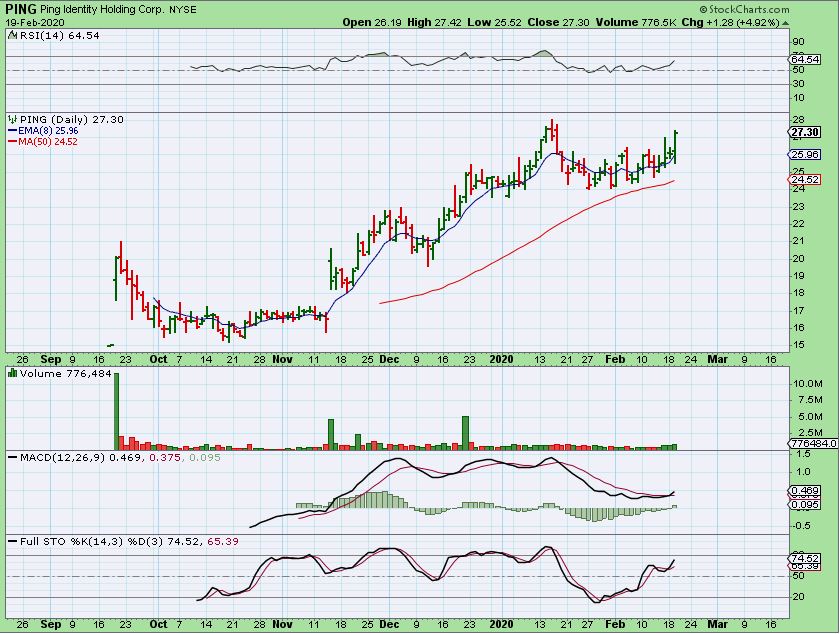
** PING – Up 100% since October, PING IS BULLISH. I have March 4 listed as the next earnings release date for PING. This looks ready to break out & run, it is a buy. It will reach new all time highs and have no overhead resistance .
,
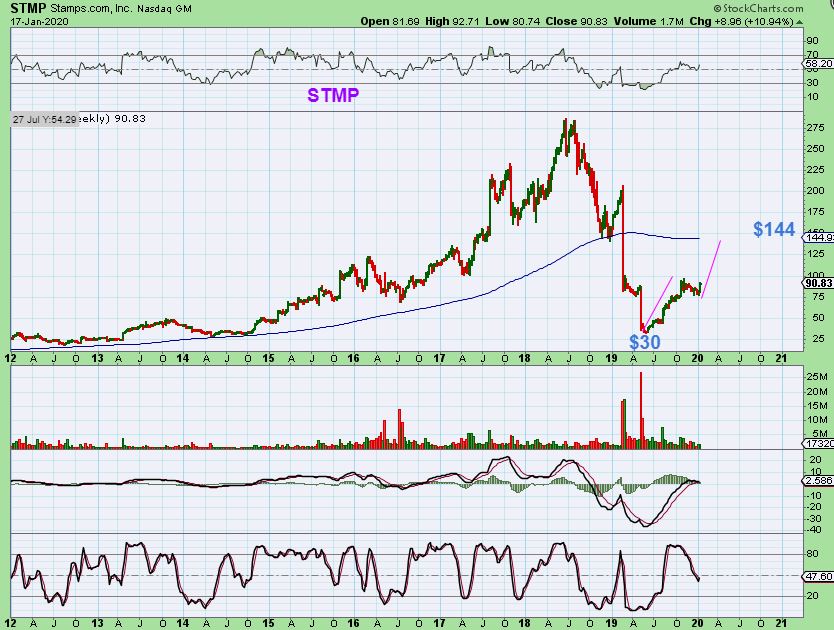
STMP WEEKLY – On January 17 I pointed out STMP as breaking out and formerly a $200 stock. This was a bullish weekly chart that could run to $150 quickly.
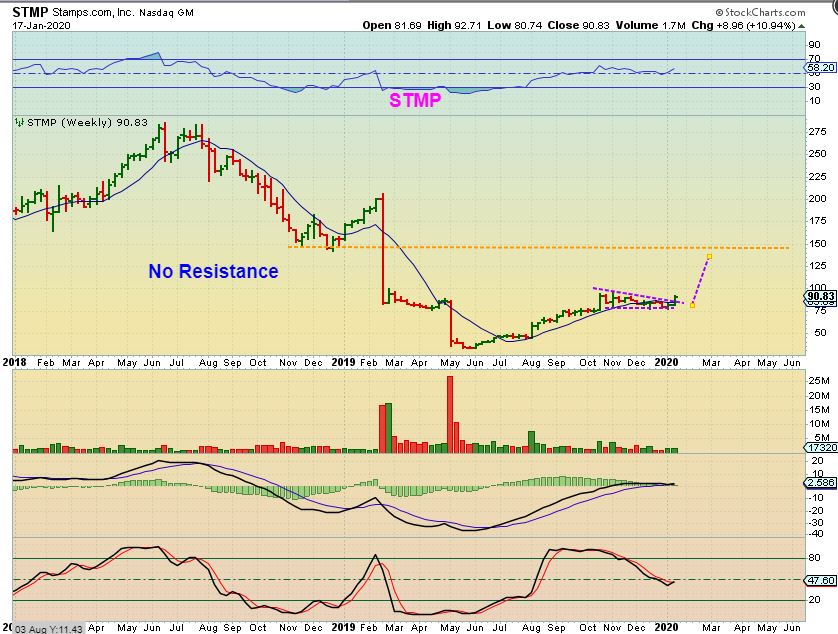
STMP WEEKLY – $30 to $100 on that first run was $70 in gains. Add that to the $75 low and $144 was a target at the moving average.
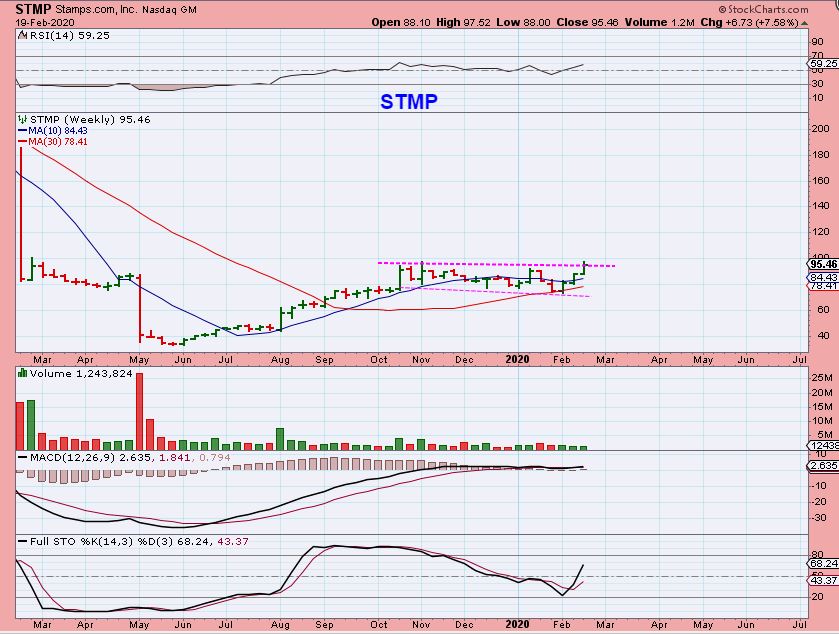
STMP – I had this chart set up for todays report and realized they just released earnings as I am writing. It is set to gap up to $$125! We’ll see if that holds in the morning, but basically we may have missed the next opportunity for this one.
.
.
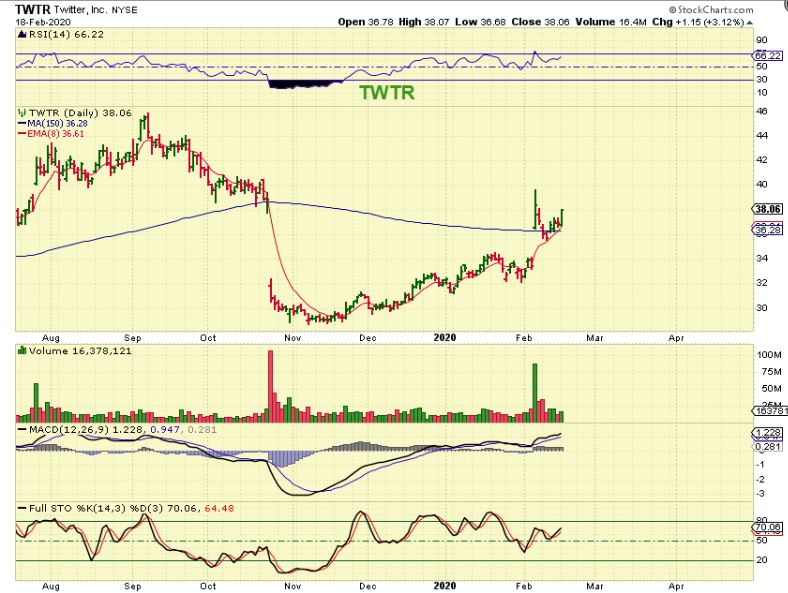
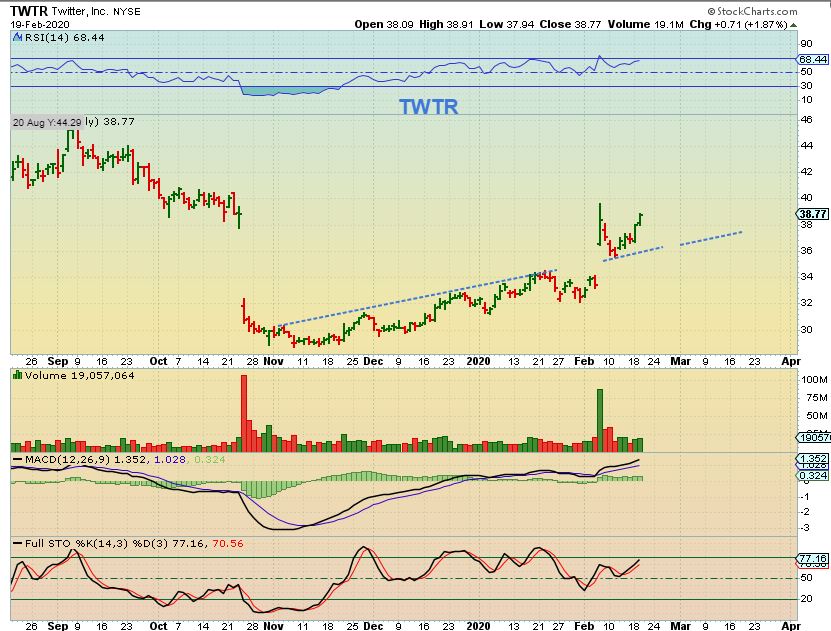
FROM YESTERDAY TWTR – Reversed at support, this was a buy again.
.
I keep mentioning TWTR because it had that bullish Earnings POP and the gap didn’t fill. That is like an Island Bottom, and this should run back to prior highs. That was $36 to $46, but it has been slow and steady so it can still be bought. Start a partial? Then if it runs, you are in, if it dips to the blue line again, you can add on a dip? Earnings came out, it passed the test.
In recent reports, we discussed ZM, AMD, MU, CSIQ, CRWD, WORK, SPQR, STMP, ENPH, TWTR, UBER, PING, CRWD, NTNX, SEDG, PAGS, and More. Many are running strongly, others like those above, may still be near support levels and still set up bullishly to go even higher.
.
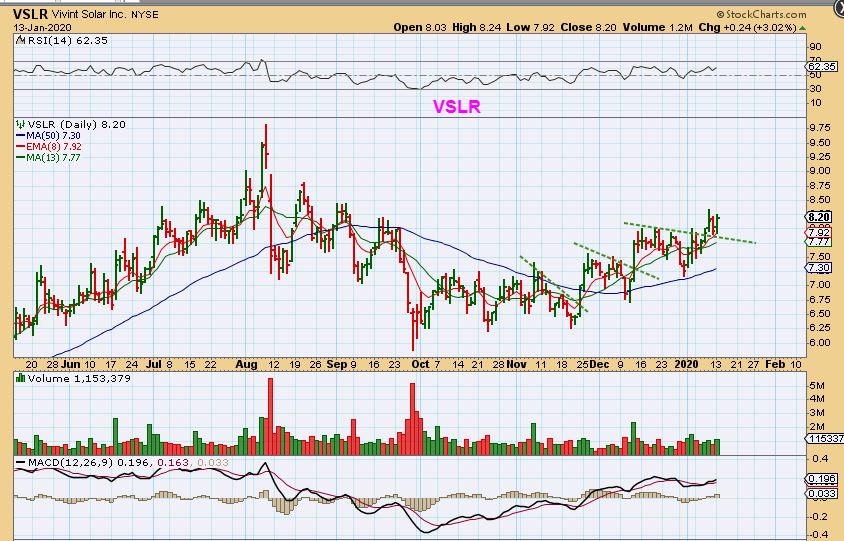
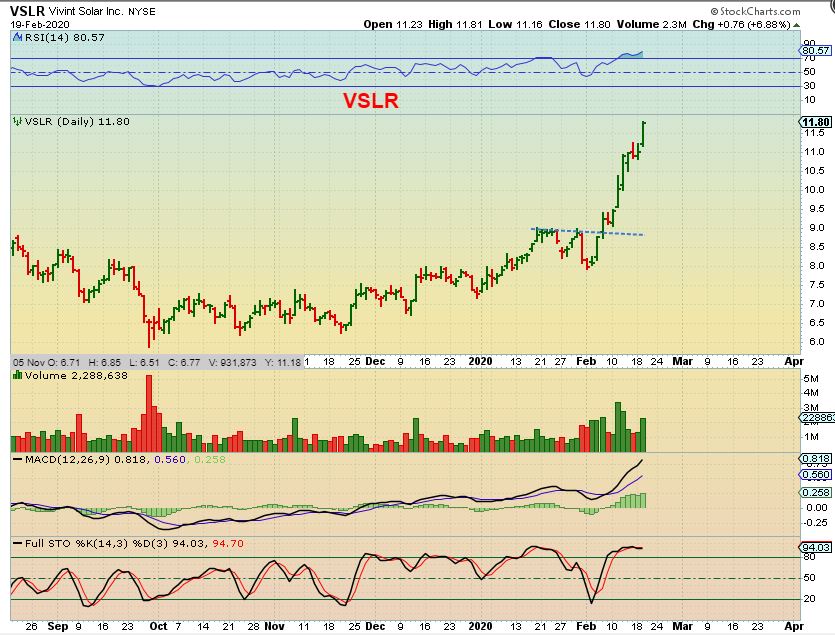
All of the Solar Stocks are running in a BIG WAY! VSLR, JKS, ENPH, RUN, NOVA, CSIQ, and more are running like cheetahs. ENPH was up 42% on an earnings beat.
.
VSLR – Do you remember when I said that these were choppy like the Miners, but making higher lows? Well…
.
VSLR – I certainly hope that the Miners run like these are! Notice that break out from the blue line…
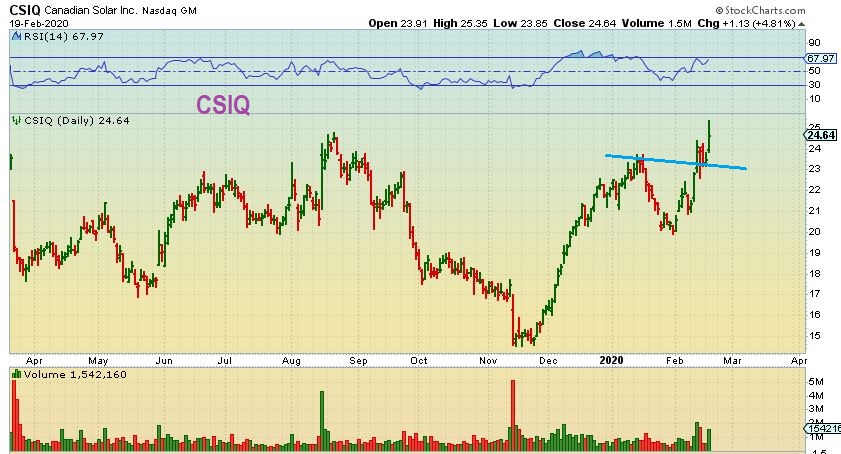
CSIQ – I posted this reversal off of the 50 & 200 as a buy and this area looks a lot like were that Blue line was in VSLR. So…
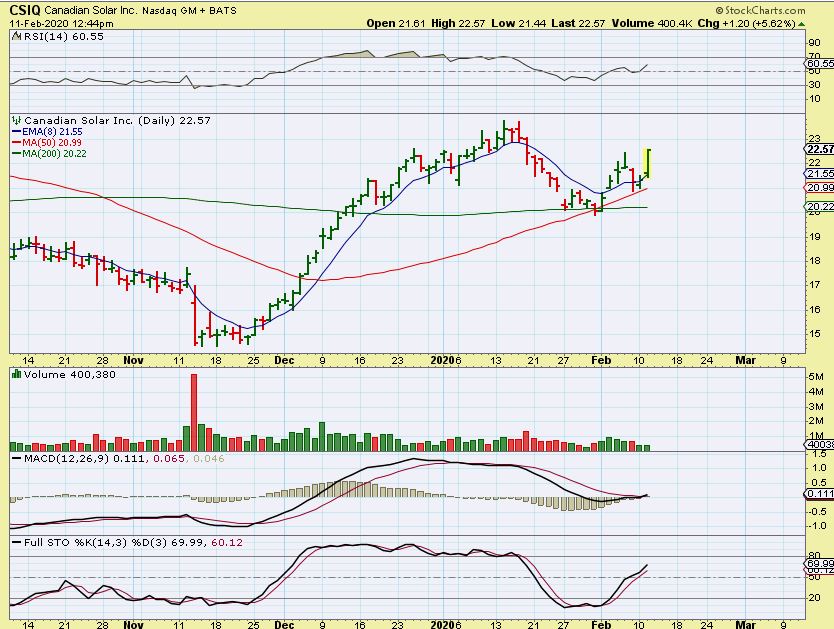
.
CSIQ – It is also breaking higher, much like VSLR just did with that blue line.
,
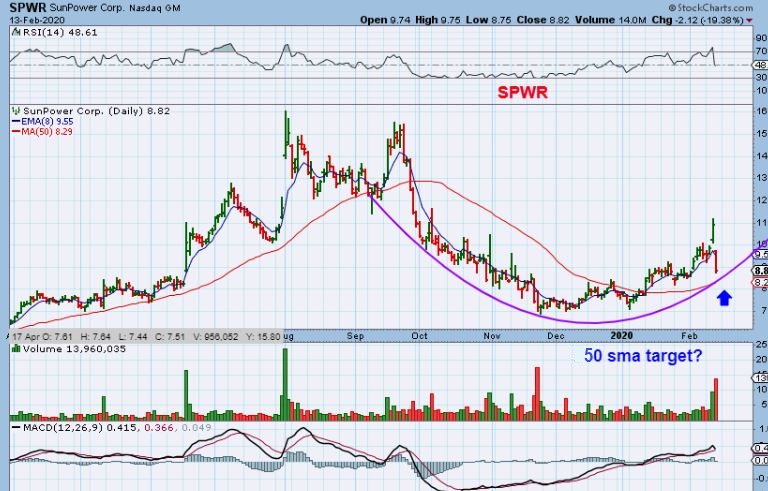
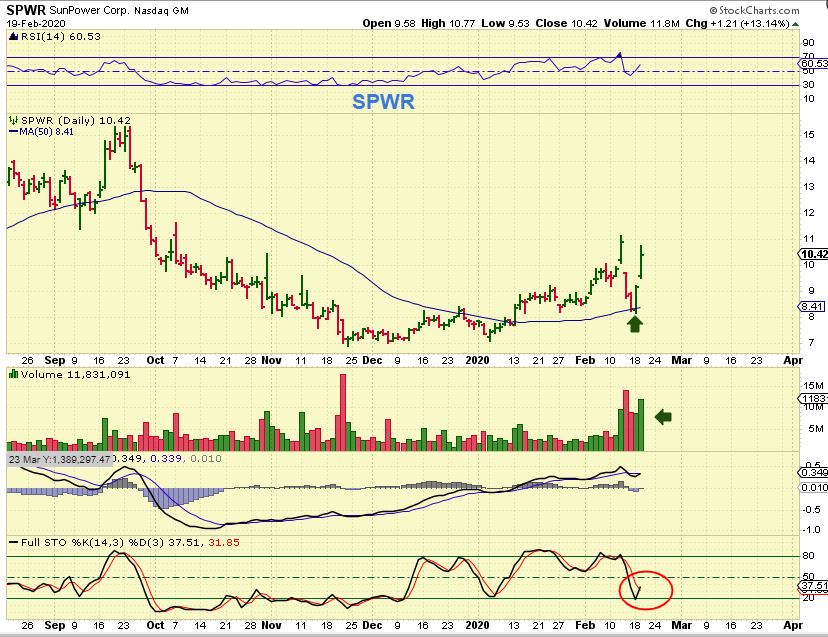
SPWR – This one dropped on Feb 13th, but I mentioned looking for a reversal at the 50sma & arc.
m
SPWR – That is exactly what it did and it has moved from $8 to almost $11 in just 2 days. The way these are running, it is possible that this will just keep running higher too. It is hard to find a ‘low risk’ entry on this now though. The low risk entry was that 50sma. I’d love to buy it for a quick trade, but I have too many positions open.
,
Take a look at ZM for another example of recent recommendations as the markets stay hot….
.
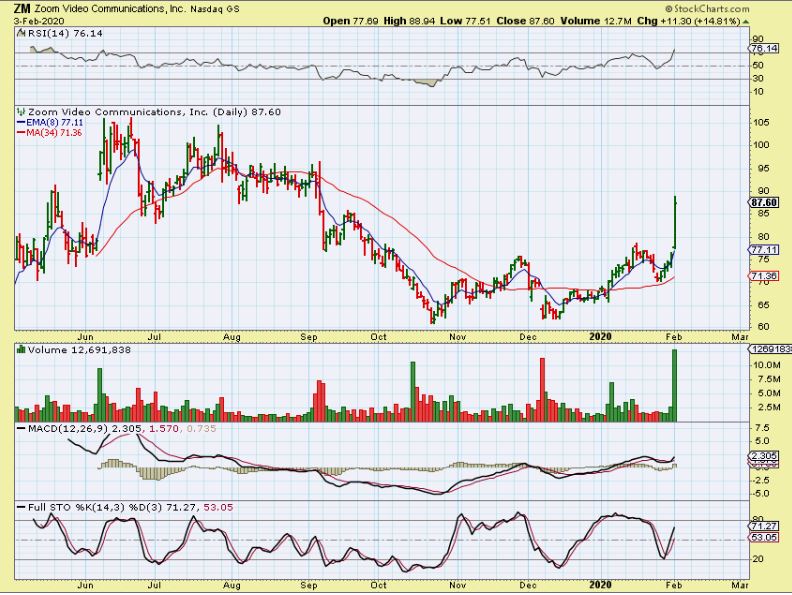
ZM – I pointed out a BASE in ZM, and this was the strong break out on Feb 3, then…
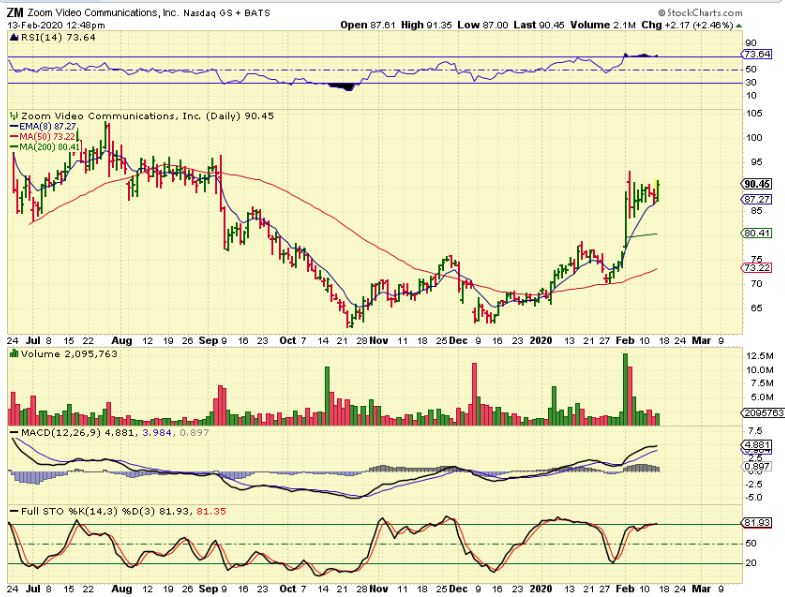
ZM – We saw a Bull Flag form, so I posted this last week on FEB 13. This was a buy, and now…
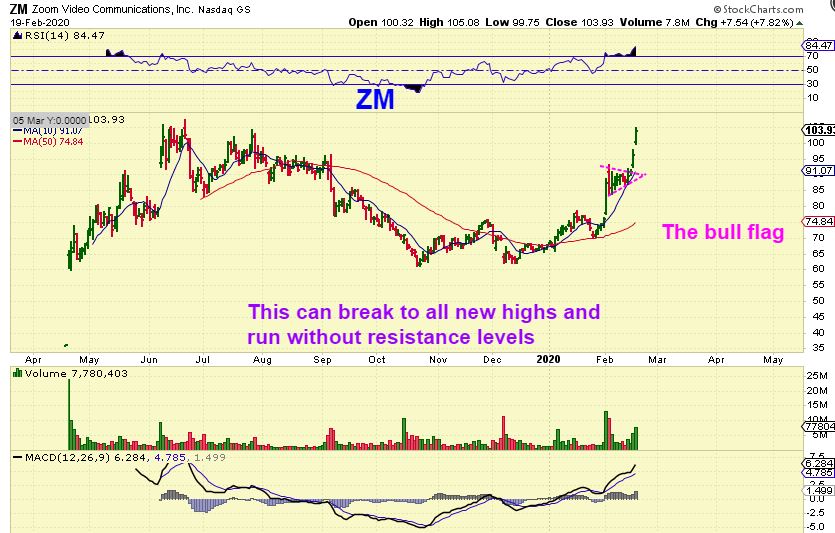
** ZM – It broke free over the past 2 days. You can see how these Bullish set ups are acting as long as these markets say hot? This can now Break free to new highs, above all resistance levels. If you see others like this, buy the Bull Flag in the current market conditions.
.
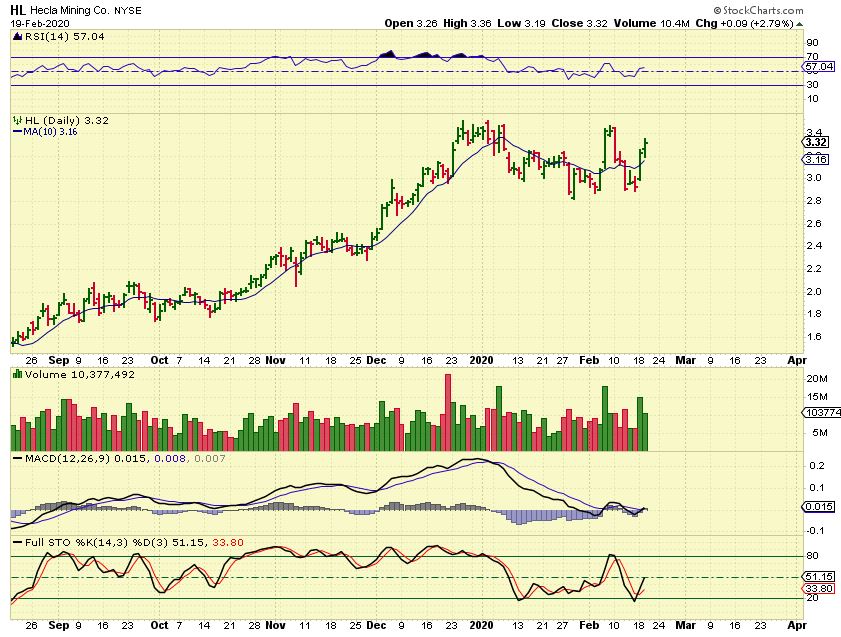
HL – I almost forgot this chart. HL was in yesterdays report and is still a buy if you ask me. The Big Pop was earnings, and then it dropped lower with Silver. It has recovered.