Feb 25th – Volatility Ahead: What Does It Mean?
I woke up to Gold & Silver futures rocketing higher yesterday and the General Markets futures crushing down. I thought that this report would be a really easy report to write, and then VOLATILITY shook the markets all day long. Now what do I write about? 🙂 Let’s discuss these volatile markets…
.
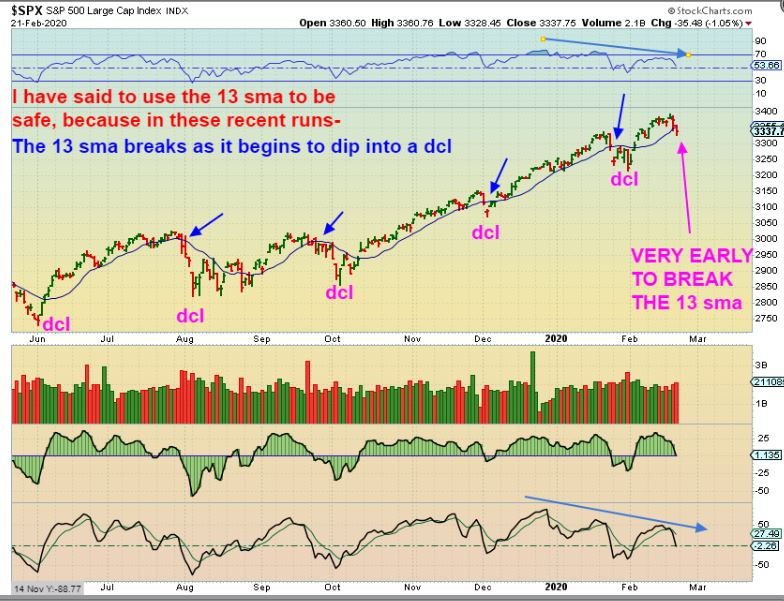
The following 2 charts were in my weekend report after the SPX Daily closed below the 13 sma last week. Closing under the 13 sma was a sell signal for us, since I expected a drop into a dcl to start after that happens. Also on day 14, it is very early in the daily cycle to see a close below the 13 sma, so it would be definite sign for us to stop out.
.
SPX DAILY : Look at the blue arrows. That is a break of the 13 sma & a drop to a dcl followed. On day 14, we are not due for a dcl soon, so if the markets drop from here, and we get a 35-40 day cycle, this could drop for 30 days. NOT STRAIGHT DOWN DAY AFTER DAY, but the peak may be in…
,
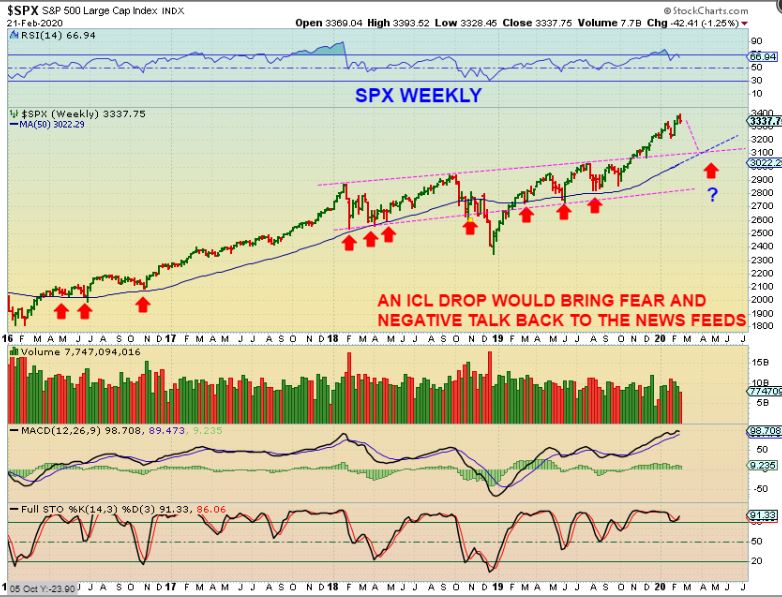
SPX WEEKLY – The Big Picture still looks as though we could go parabolic, but the shorter term daily charts above seem to be calling a top here. An ICL drop will scare many, suddenly News will get ugly, Viruses , Elections, earnings, the Fed, and everything else will be blamed on the drop, but it may be just a back test of this break out.
.
Well the markets sure did drop after that close Friday! The Dow even closed down over 1000 points. It is early enough in the daily cycle for this to get very ugly over the coming weeks, but how might this drop possibly play out if we bounce soon?
.
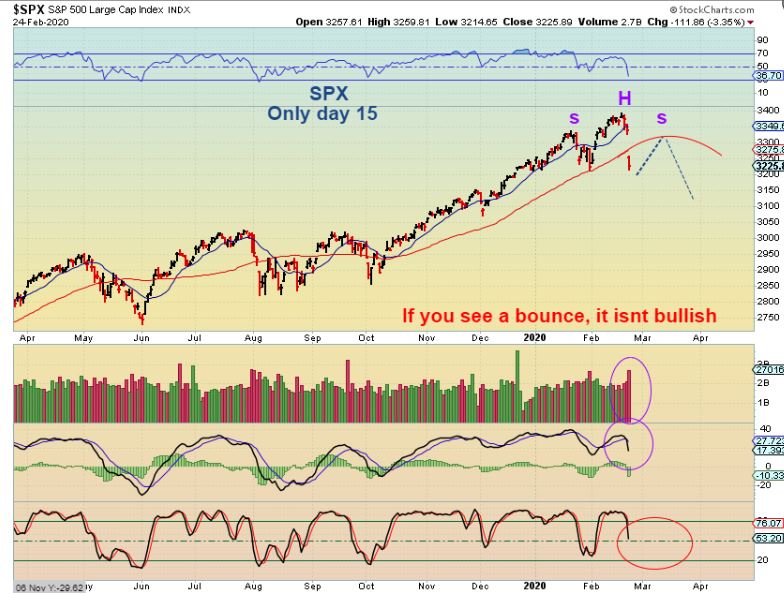
SPX – THIS IS JUST A GUESS, but I can picture this market sucking the ‘Buy the dip” Bulls back in. However, on a bounce, This could back test the 50 sma & form a H&S and then roll over into an ICL. For some it may make a good ‘short’.
,
SPX – We broke the DCL lows, that is a failure. I just want to say that I saw people buy the dip Friday heavily, and I still see people going long, buying yesterdays drop. DO NOT FOLLOW THEM. This was day 15 of a drop that can last to day 40.
.
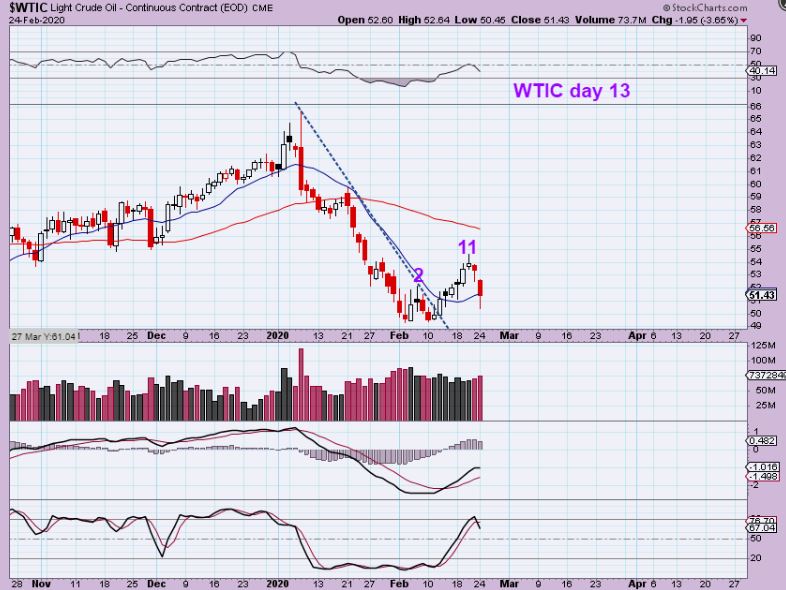
WTIC – Oil dropped and came back enough to regain the 13 sma ( not the 10). I am not in Oil or OIL/Energy, and will continue to pass for now. If this breaks the lows with a day 11 peak? This will then crash down with the markets. The MACD looks good, but I want to watch from the sidelines right now.
m
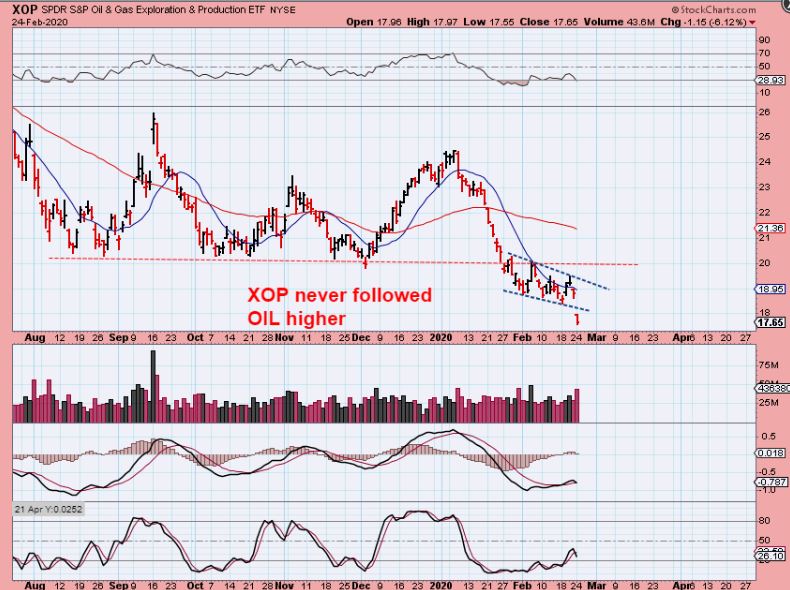
XOP – And the XOP was not following oil higher, but it looked like it may be finally putting in a low. It gapped down to new lows on Monday too. The MACD looked good here, but I don’t trust this sector yet, because there is no sign of strength.
.
,
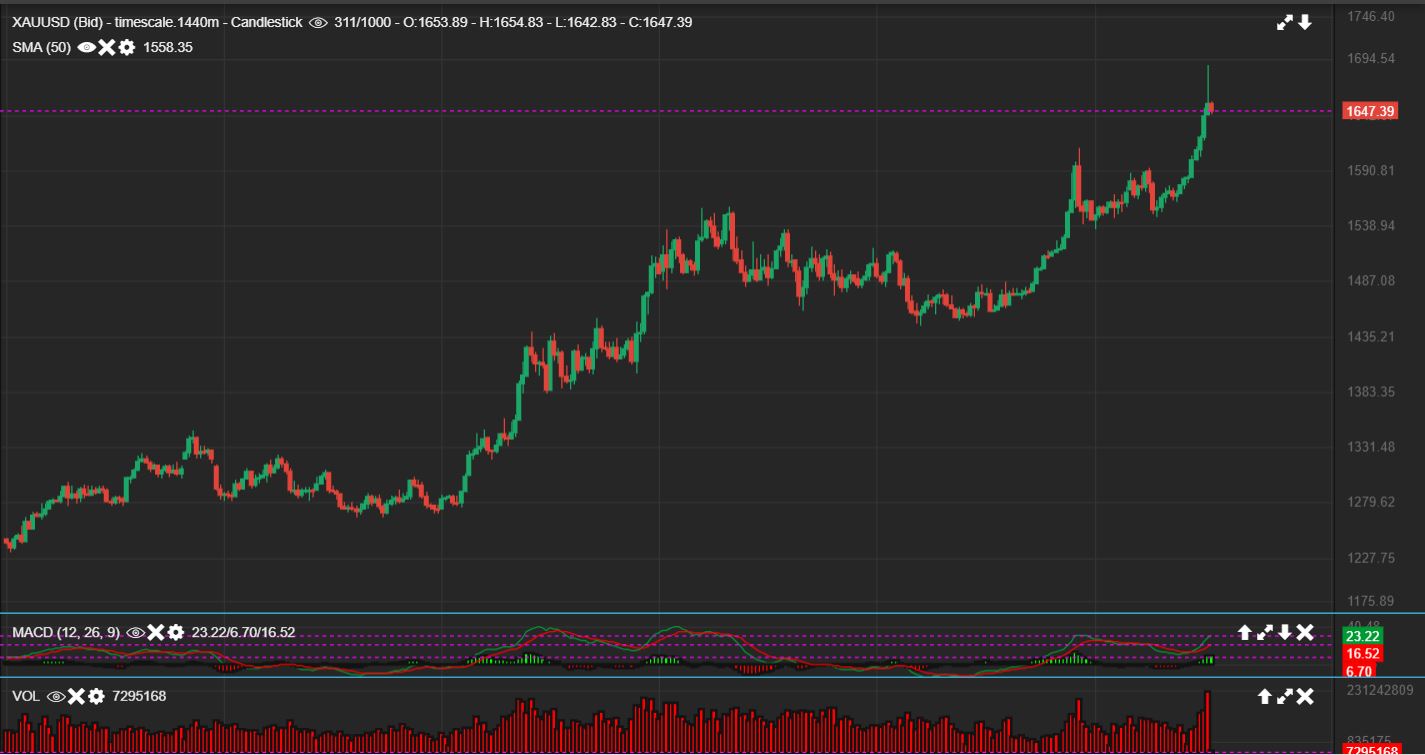
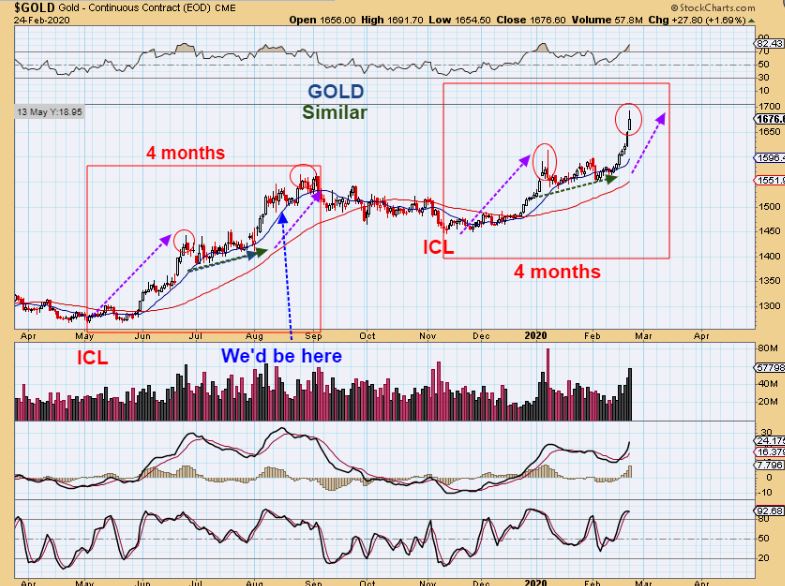
GOLD – It has been a good run. As you can see, GOLD exploded higher, but it then sold off just before hitting $1700. This type of candle if oftene a topping candle. Not ALWAYS, but OFTEN. It could just be a temporary top, so I want to break this down for you…
.
GOLD – Before we move on, Stare at this chart. ” What do you see when YOU look at this chart? Does anything stand out to you?” This is what stands out to me…
.
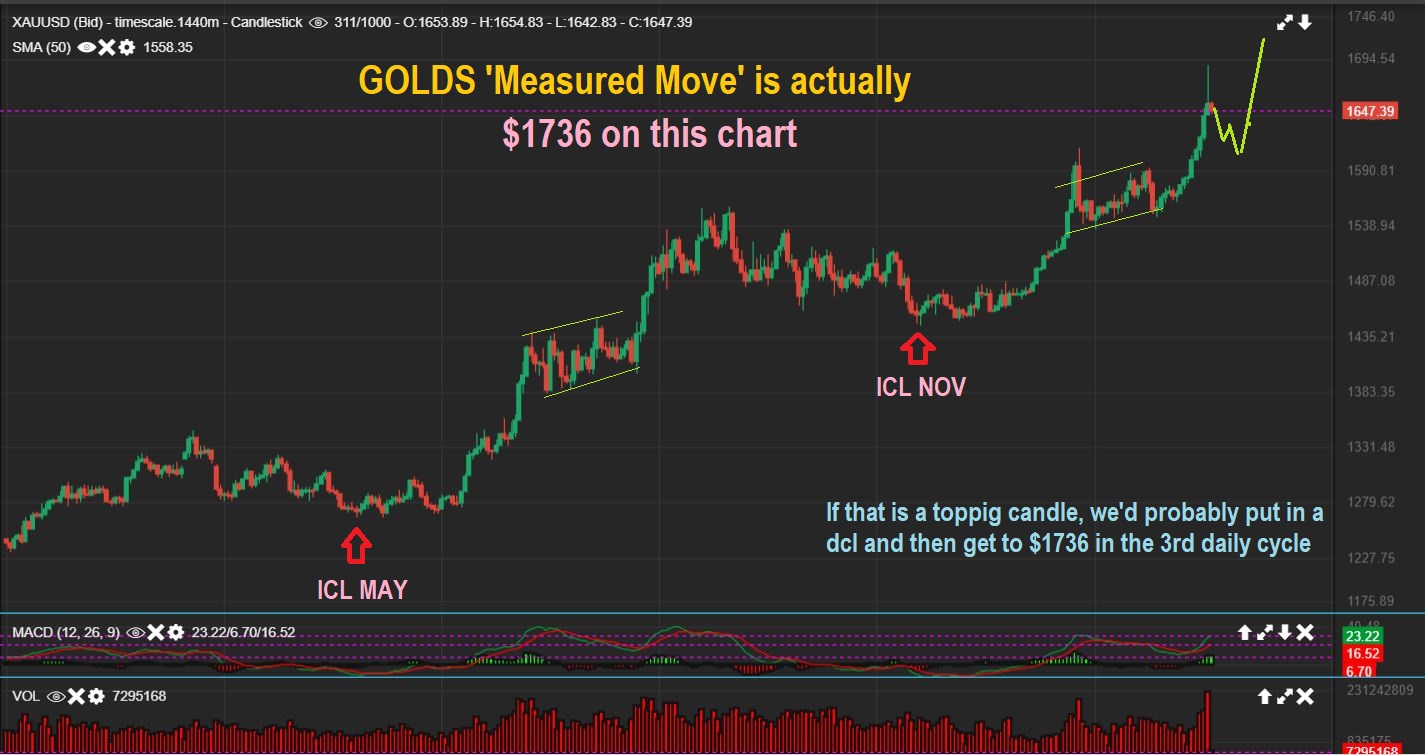
GOLD
1. The May ICL run eventually led to a choppy climb 1/2 way up, and I see that in both ICL runs.
2. Then we got the final surge out of the choppiness and it was a measured move of the run from that ICL.
3. HOWEVER I am getting higher numbers for the measured move expected now ( $1736 ish). THAT makes me think that this candle may cause us to chop to a dcl next and the 3rd daily cycle finishes the move to $1740. Read the chart.
c
GOLD – Here I am showing that the last run out of the MAY ICL lasted 4 months to the peak. I wrote’ We’d be here‘ to show how it played out from this time forward. It chopped & Popped to a new high before seeking out the next ICL. This is NOT etched in stone, we could even run to $1800 as the markets drops down, but this is todays view of yesterdays reversal.
,
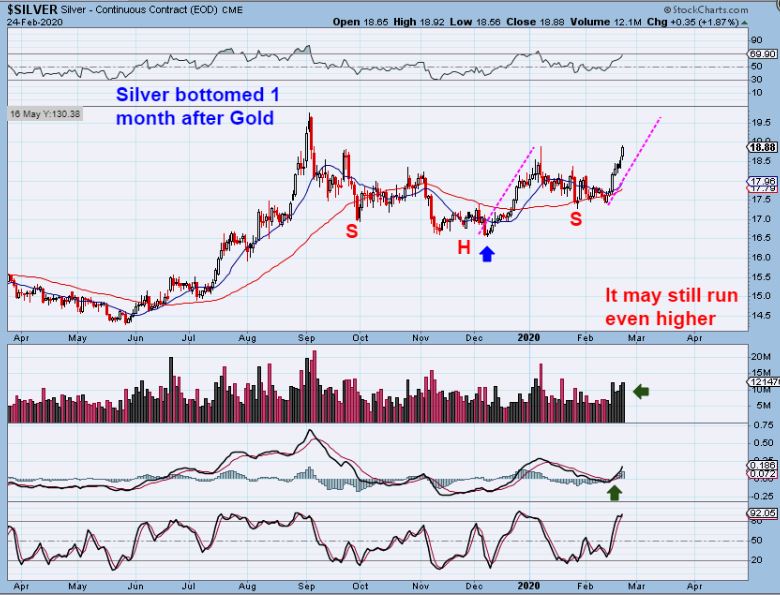
SILVER – Possible good news. Silver bottomed in December, and that was 1 month later than Gold, so it has not stretched out like Gold has. It is POSSIBLE that Silver has more upside left in it. I still see a bullish looking inverse H&S pattern. And…
,
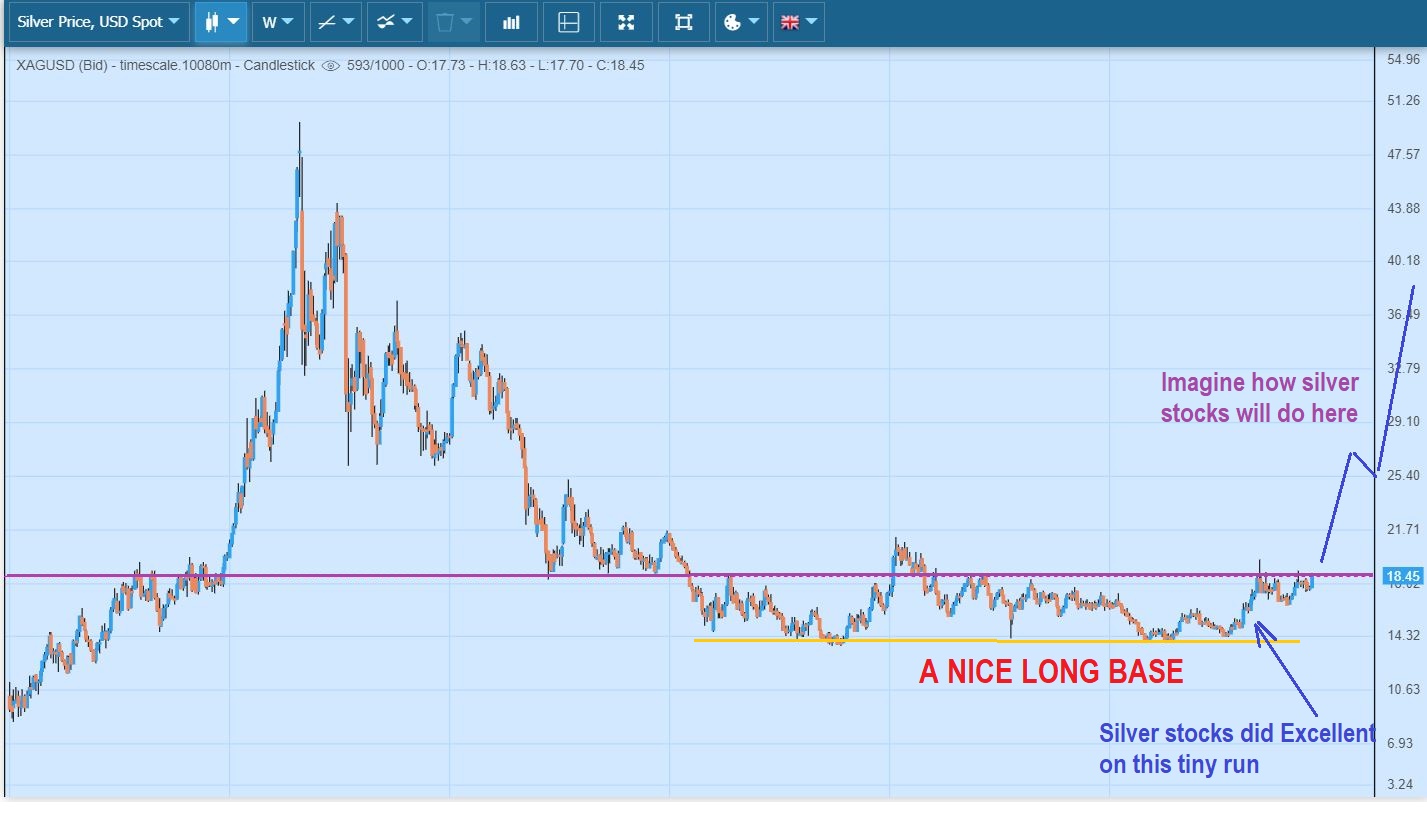
Just remember that the bigger picture is this Multiyear base. Can you imagine how Silver stocks will perform when this gets going? The big picture is still screaming that we should be making great gains this year in the Mining stocks.
.
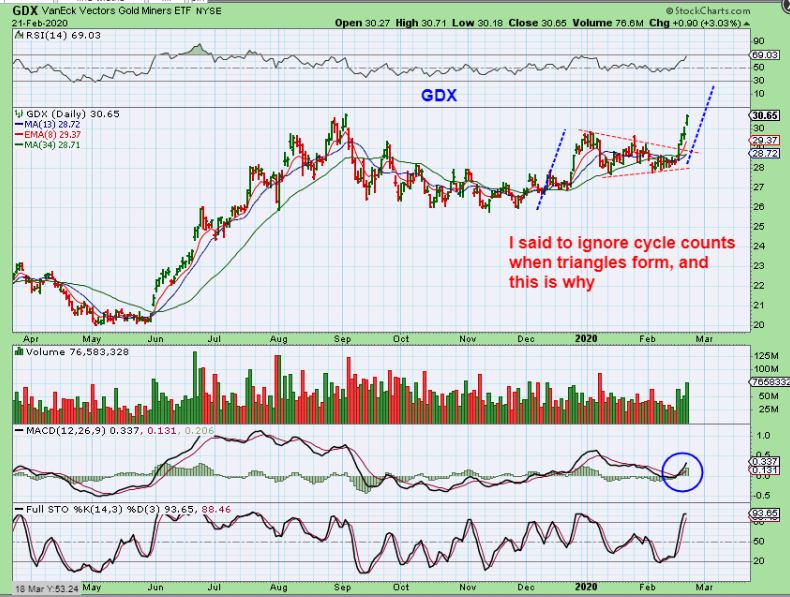
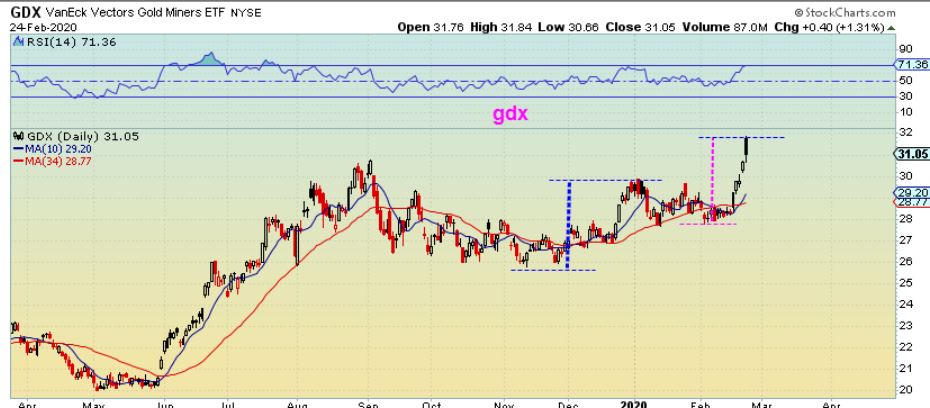
GDX DAILY FROM THE WEEKEND REPORT –
This triangle formed in about 23 days of the daily cycle, and I had people emailing me & telling me that it was too late to but the triangle break out. I said that a break out of that triangle is a ‘buy’ in technical analysis, period. I also said that I Ignore cycle counts with triangles, since this could run straight up to day 30 or so & then dip later. So far, excellent gains have been made in many miners.
.
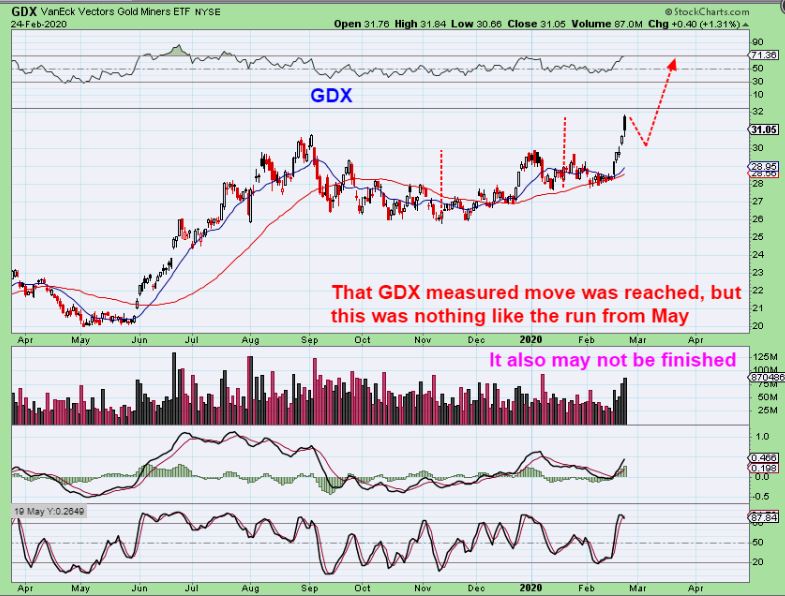
Now for the Monday GDX – GDX gapped open much higher , but it sold off through the day. It is now possible that the Pop made the measured move complete. This CAN stretch higher, but this is also looking complete. Time will tell, but what if we dip from here?
.
MONDAY GDX – THIS RUN OUT OF THE NOV ICL WAS NOT AS GOOD AS THE ICL RUN FROM MAY, the way I showed that Golds run was. So I would say that this CAN still go higher, but it may dip first as shown…
.
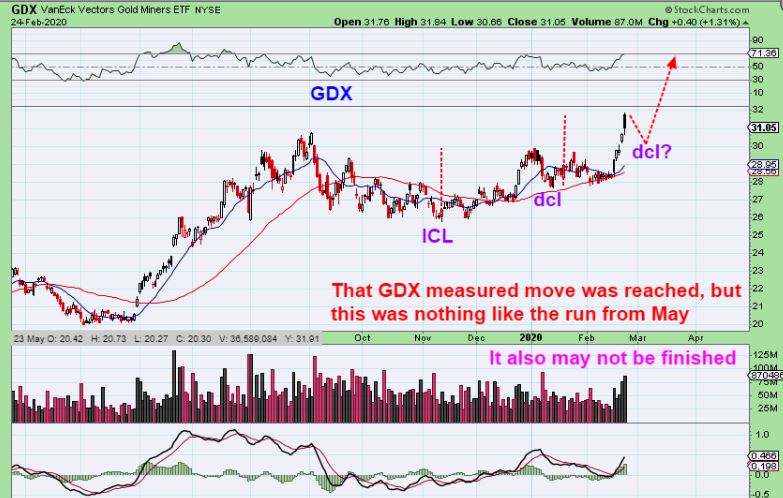
What if we do get a dip as shown though?…
GDX – Counting days from the dcl would have this peak as day 27, so it may chop sideways & become a day 32 ( or so) DCL. Then we would start the 3rd daily cycle and move higher. Also, if Silver stocks run with Silver, this could push GDX , GDXJ, & SILJ higher even if Gold stalls. So even if we see a dip, it may be limited and quickly form a dcl.
.
A PULLBACK IN THE PRECIOUS METALS SECTOR IS NOT GUARANTEED, BUT IT IS POSSIBLE WITH THE REVERSALS YESTERDAY, SO I JUST WANTED TO PREPARE US FOR THAT. We could chop sideways & top too. I also want to just discuss a few thoughts about our Miners below. Some Miners have already put in excellent runs higher and may be extended, while others lagged a bit. Really only time will tell, but I think that we could see different kinds of dips into then next dcl by the different variety of Miners. I’ll discuss this below.
.
~ALEX
,
At this point in the discussion, I just wanted to point out that some individual Miners may need to do a healthy pull back during the next dip into a dcl, because they have become extended. Other less extended Miners may hold up better, they may go sideways, or possibly even continue to make small gains. Lets take a look…
.
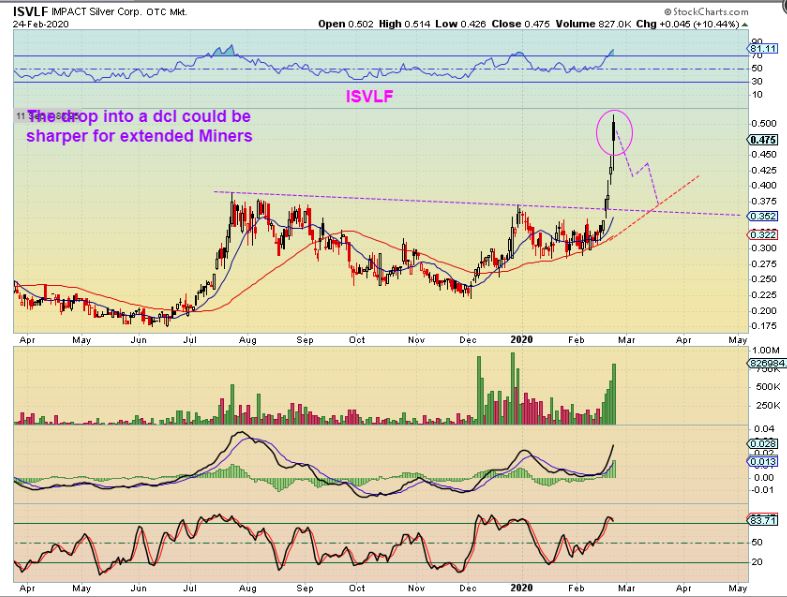
ISLVF – Some Miners have rocketed higher day after day out of their triangle. These are the ones that could bull flag or dip down during a drop into a dcl…
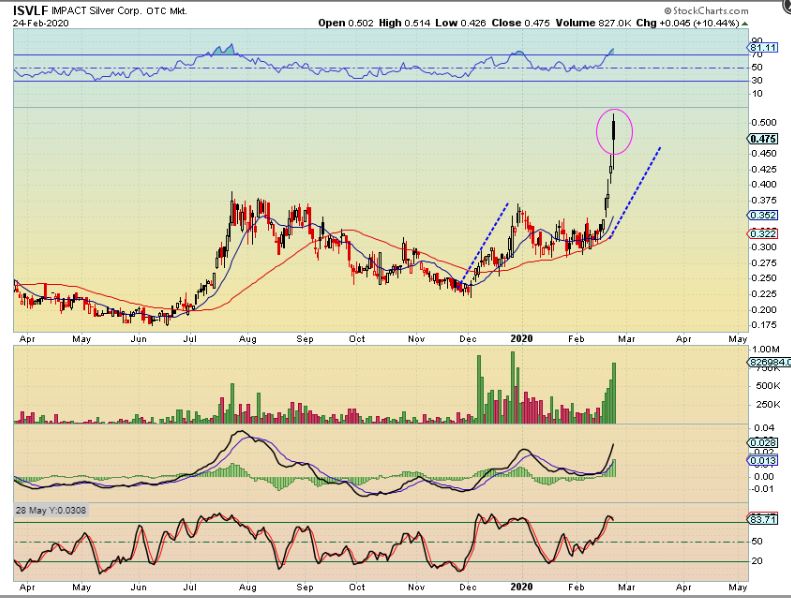
ISLVF – Maybe something like this is still reasonable if it doesn’t just bull flag.
NEM – NEM looks like a topping candle, so it could possibly drop like this, or it may just put on a bull flag too. Either could present a buy the dip opportunity.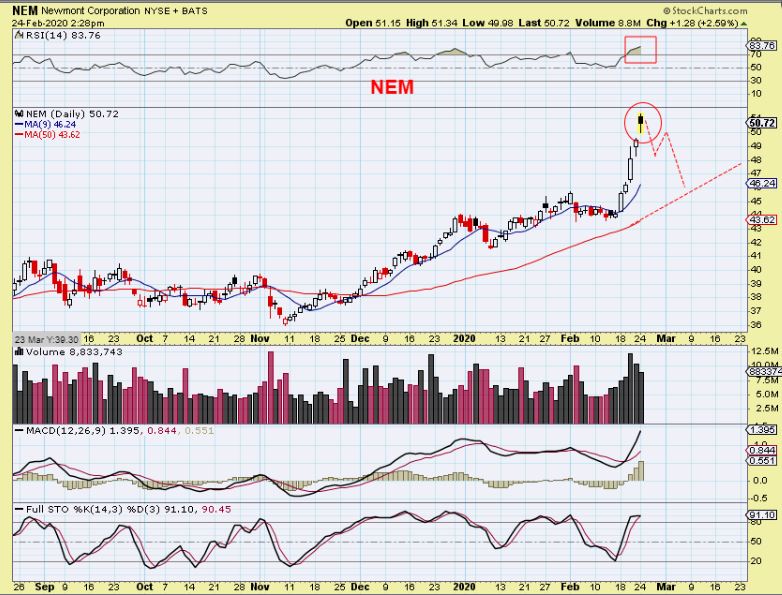
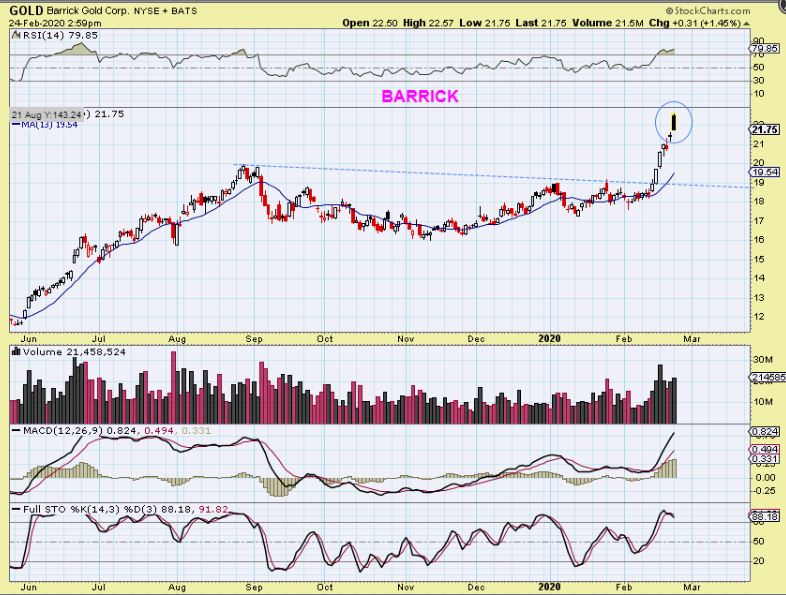
GOLD (BARRICK) – After this run, a small dip could also be similar to the chop /dip that we saw in June. A bigger dip would become a back test.
.
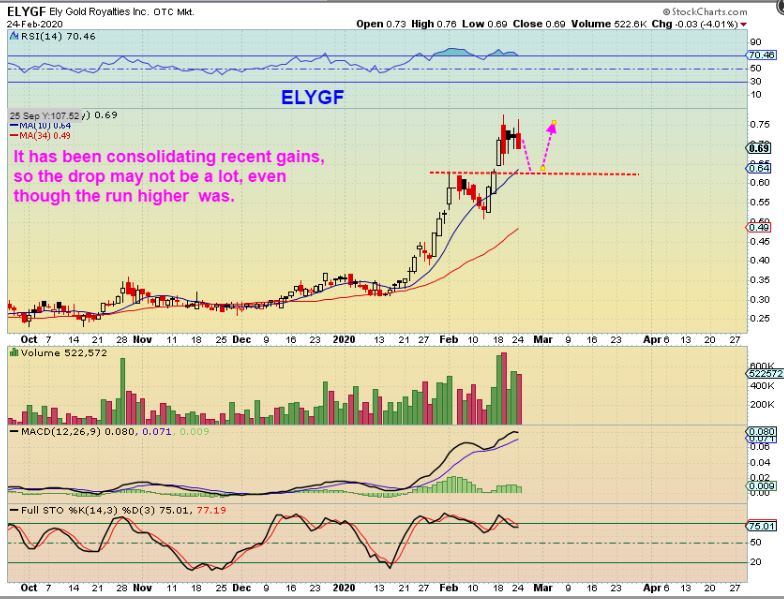
ELYGF got extended, but it has already been chopping & consolidating the gains up high, so it may not pull back very much going forward.
.
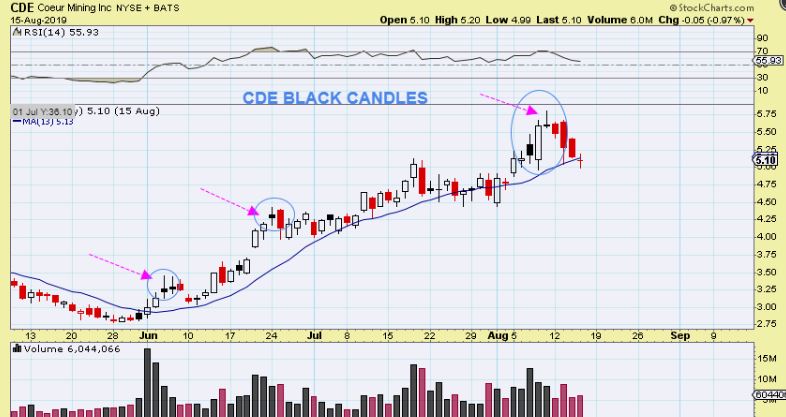
CDE BLACK CANDLES in 2019 – We had a lot of Black Candles with yesterdays reversals at the highs. Black candles can often signal a short term top (not always, but often) so I used this CDE chart to show the black candles that it formed, and how the pull back can be mild or start the drop into the dcl. What we get remains to be seen.
n
So when I mentioned some of those stocks above that may need a deeper pull back, I also though that some may be set up to ignore the dip, or just churn sideways. I’ll point out a few.
.
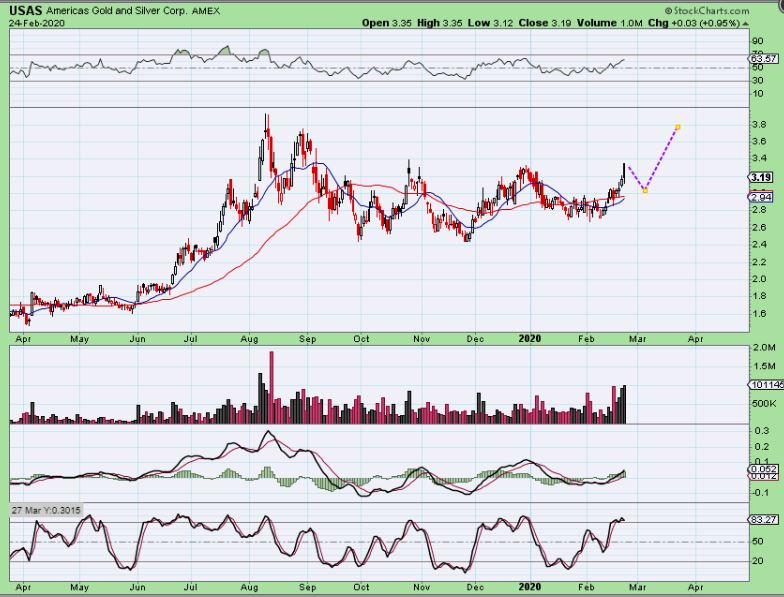
USAS – A Silver stock may just keep running if Silver breaks higher. This is not as extended as other Miners. A small dip as shown is reasonable.
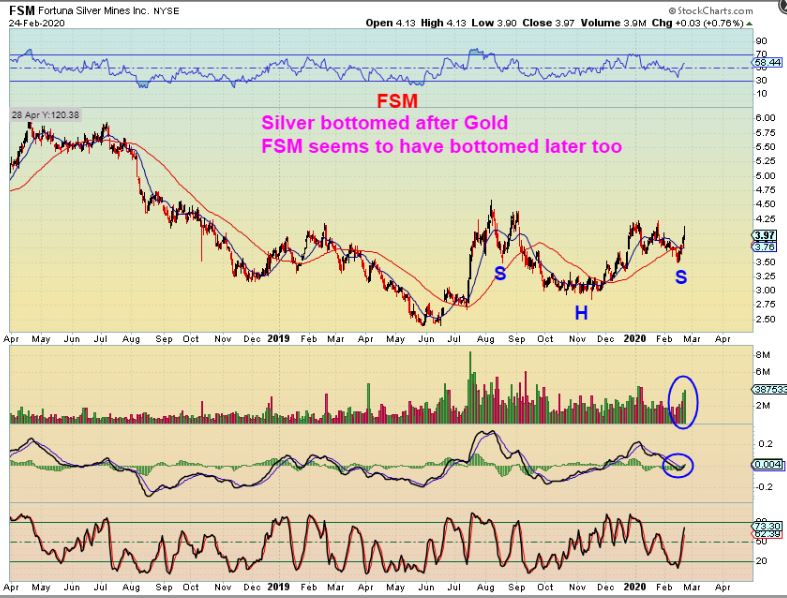
FSM – I like this set up too and it isn’t overextended, so it may or may not pull back very much.
,
.
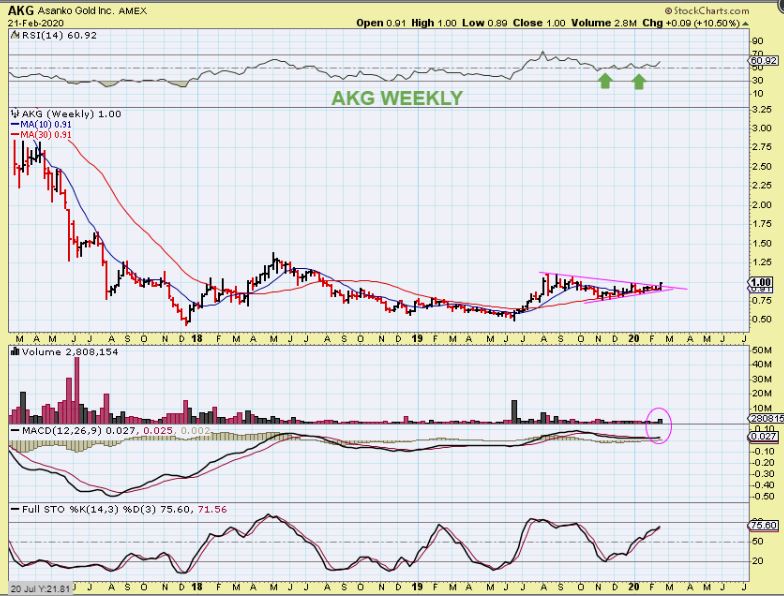
AKG – And the weekly set up on AKG actually looks to be breaking out Bullishly, so I even bought this one. Both the 10 & 30 weekly ma are at 91 cents & price has been bouncing there.
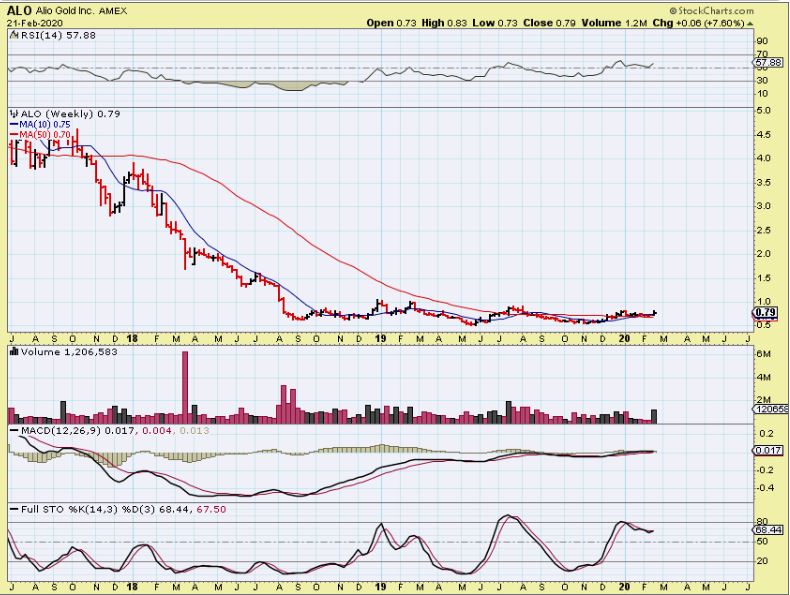
ALO Weekly – I found this base this weekend. I didn’t buy it, but it did have a high volume pop last week. It is a good set up, but I want to watch it for a bit and see if & when it looks ready to run. That small move is actually 50 cents to 80 cents since November lows. The upside potential is very good if it runs.
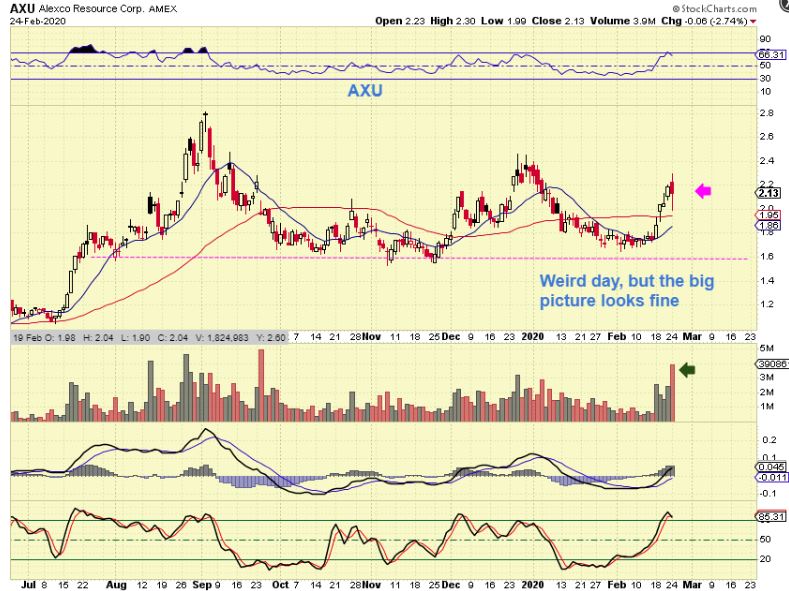
BY REQUEST: AXU popped higher, then sold off, and then tried to recover. That is an odd candle with extreme volume and I don’t quite know what to make of that indecision short term really. That said…
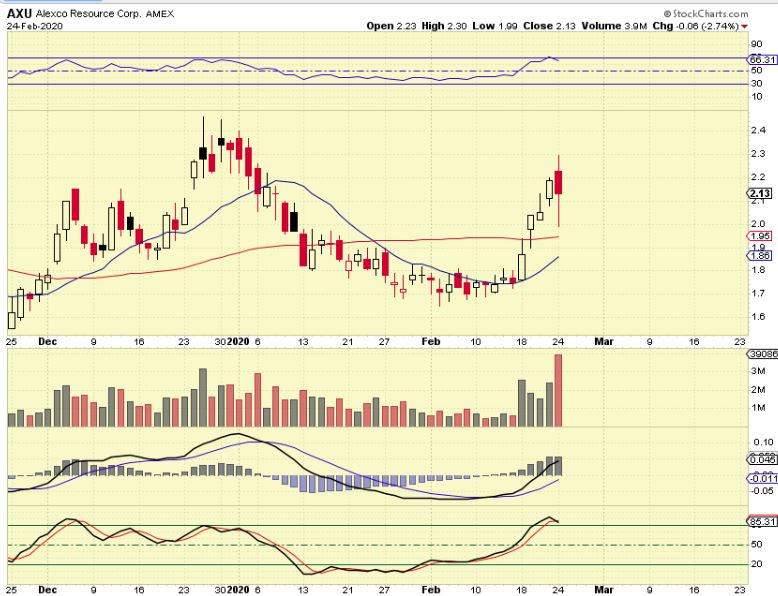
AXU – The big picture is still bullish and if Silver starts to run, I would expect AXU to continue higher too.
VOL – A – TIL – ITY !
.
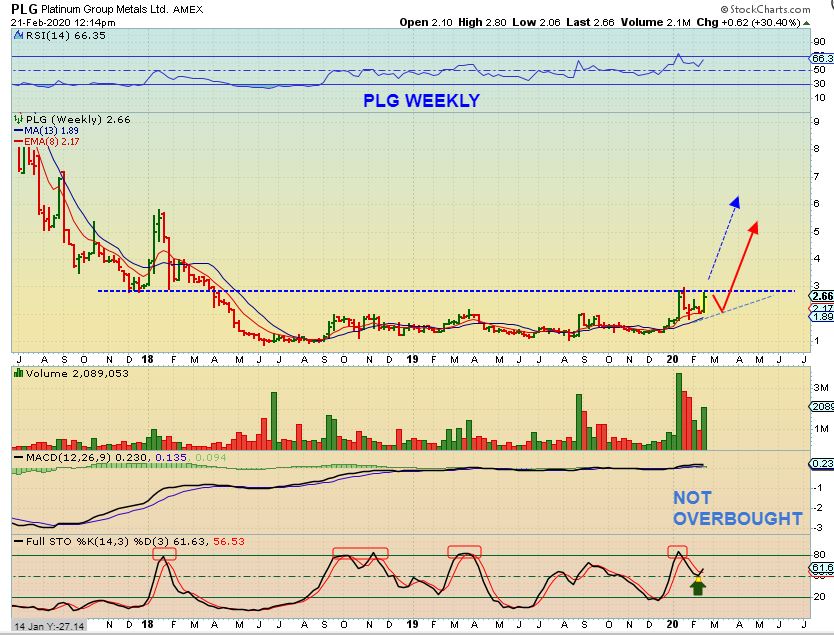
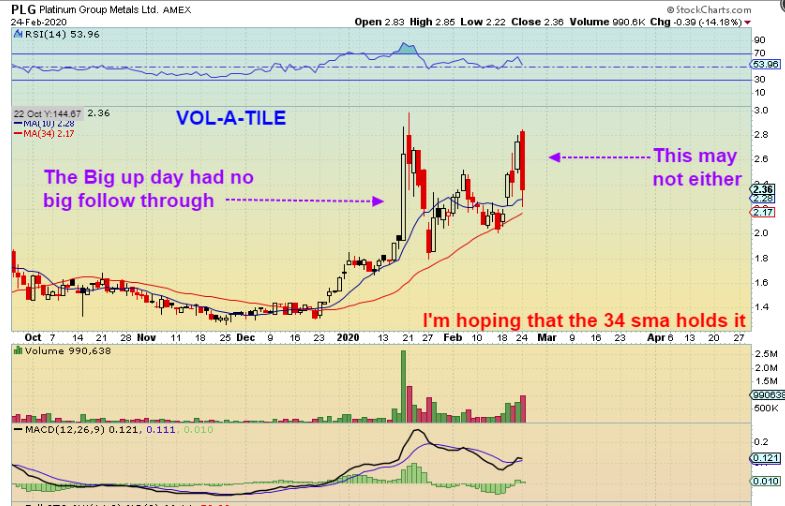
PLG dropped 14 % Monday. In January it had a very strong up day, but no real follow through higher. Now we have a strong drop that may run out of steam too. I’ll be watching for support to see if this selling dries up. Was this completely unexpected??…
.
Not really unexpected : I hoped for a break out, but we reached resistance. I had this PLG WEEKLY chart in the weekend report where I was trying to show that PLG is at resistance and it also MAY drop to the 10 week ma near $2.00. I hate the ride too, I hate the volatility too, but the chart remains bullish. I still would expect it to break out over time and then it may settle down & trend higher from there.