Wednesday January 8th – Surprises To The Upside
EDIT: I had the charts for this report captured and most of it written by the time I heard the news that Iran had presented a Missile Strike and the futures blasted off. Precious Metals and Oil up, General Markets down. Often these news events get over done quickly or even instantly, and then drift back down a bit. Follow through can take time to develop unless the move was already going to happen anyway, so I am going to present the report pretty much as it was written. I have already expected Gold to continue higher over the next several weeks, and the general markets looked ready to get choppy and dip lower soon, so lets get to the report and see what the charts were saying- I still expect the same outcome…
.
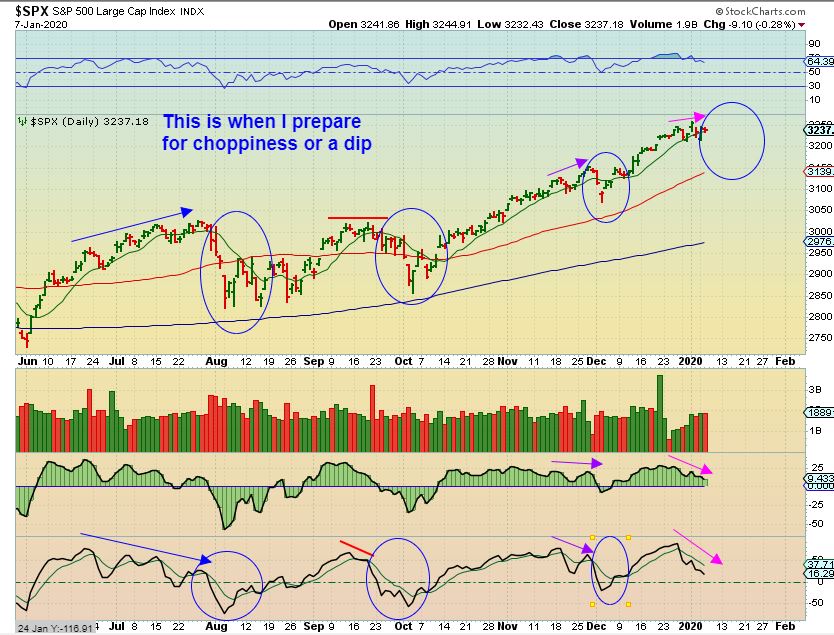
SPX – These markets were running strong out of that last dip but have recently started to enter choppy trading and may even start dropping. The divergence on these indicators is telling me to expect a dip.
.
AND I SHOWED THIS IN YESTERDAYS REPORT:
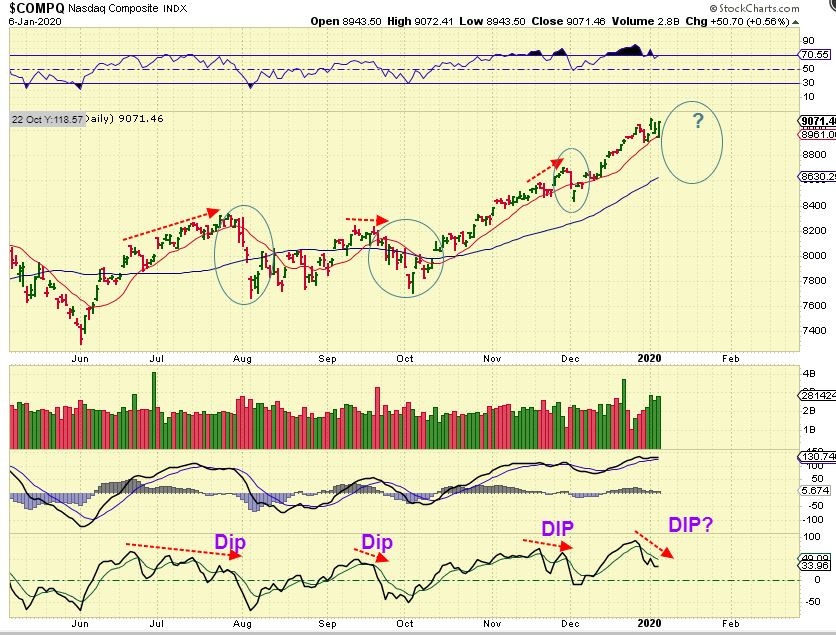
NASDAQ – The NASDAQ did NOT break the 13 sma and volume is strong. I still see divergence here, and it most likely leads to a dip soon, but as long as this continues higher, you can just raise stops with that 13 sma. Oddly, I see many nice set ups in the Tech Area that I will discuss later.
.
WTIC – Oil popped on news and then dropped back below the upper channel line. This looks like a throw over and it should eventually drop back to the lower channel line, or stay above that upper channel line . SO far, it broke back down.
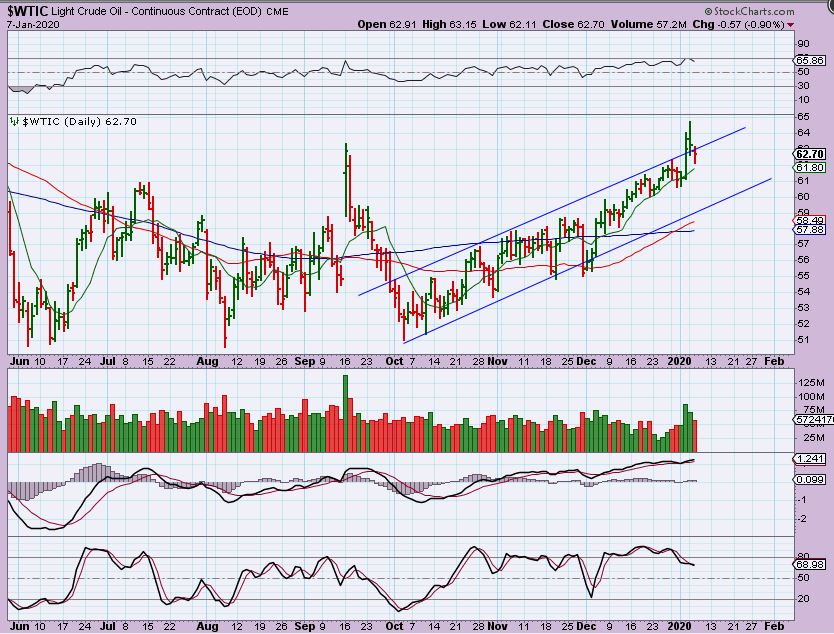
EDIT: After the Iran Missile attack, Oil popped back over that upper channel line, but is drifting back down again
.
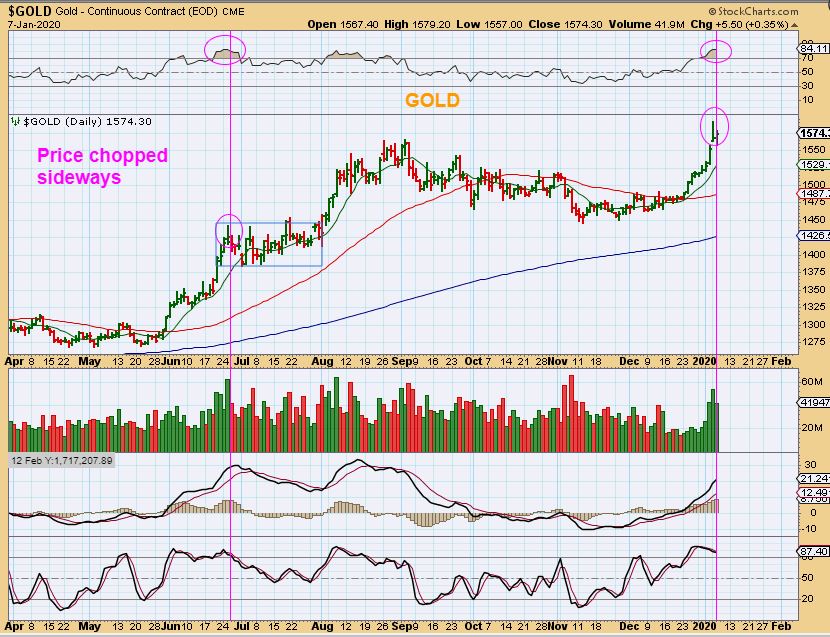
GOLD – Gold is entering an overbought area that could cause a consolidation. We should expect a possible consolidation soon, but that doesn’t really change anything. I’m not selling, shorting , or losing position, but a sideways churn won’t bother me. Look at July 2019. We stayed invested and some Miners continued higher, others stalled.
.
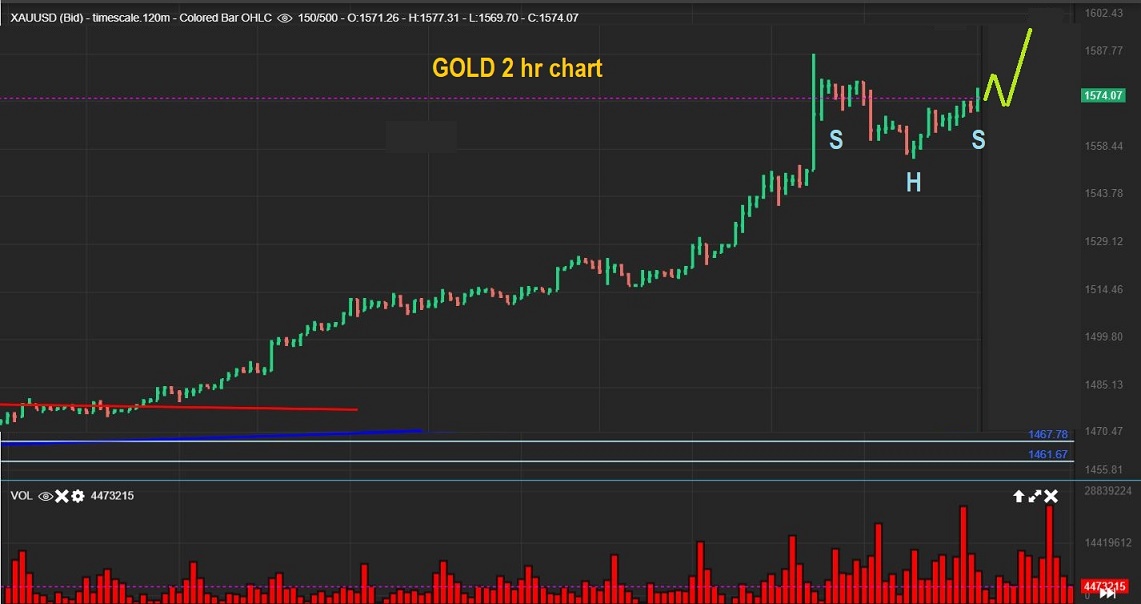
GOLD 2 hr – The 2 hr chart shows that surge on the news and then a drop. It started to recover Tuesday and is looking like a bull flag or it could form an Inverse H&S. So is this where a long sideways consolidation forms? Or just a Bull Flag? Time will tell.
.
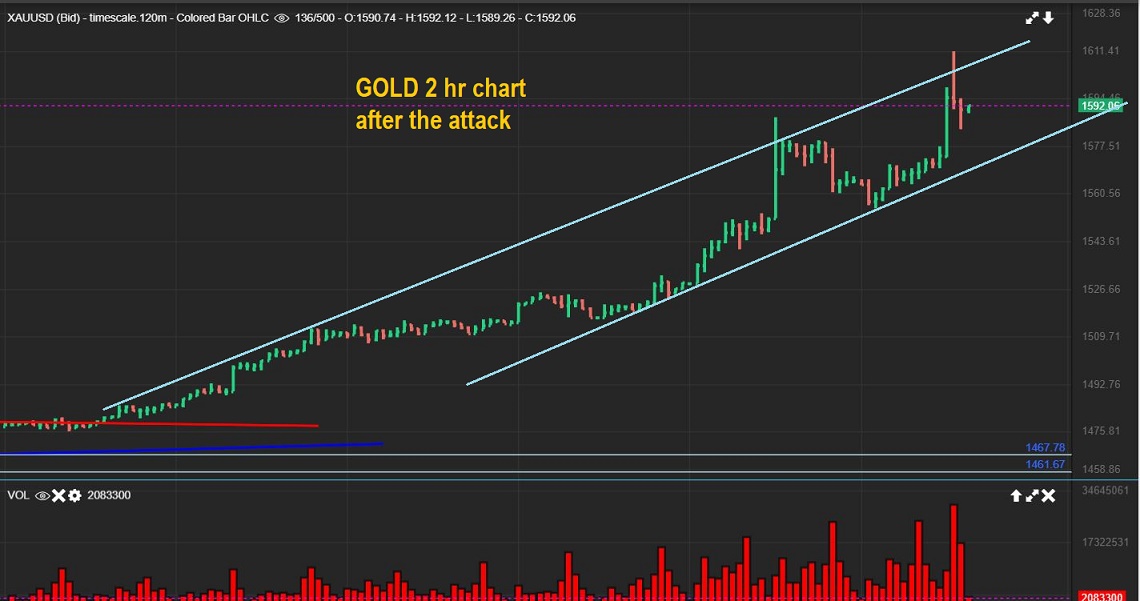
EDIT: GOLD 2 hr after the Iran Missile Strike – There was a ‘News Event’ that Popped Gold higher tonight. It has already dropped back down, so this is the current pattern as of roughly midnight Eastern Time. News events paint the chart, but are often temporary too.
.
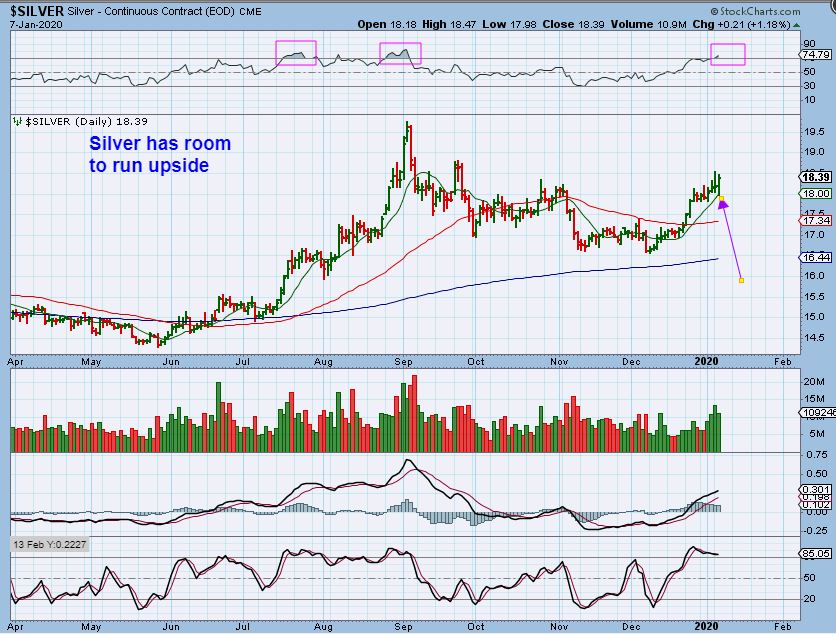
SILVER – Silver reversed off of the 10sma and it actually looks different than Gold. This looks like it wants to run higher , maybe up to the 2019 highs to complete a cup.
.
GDX – GDX also reversed off of the 10 sma. It could just take off higher, the RSI has not even pushed above 80 yet. That said…
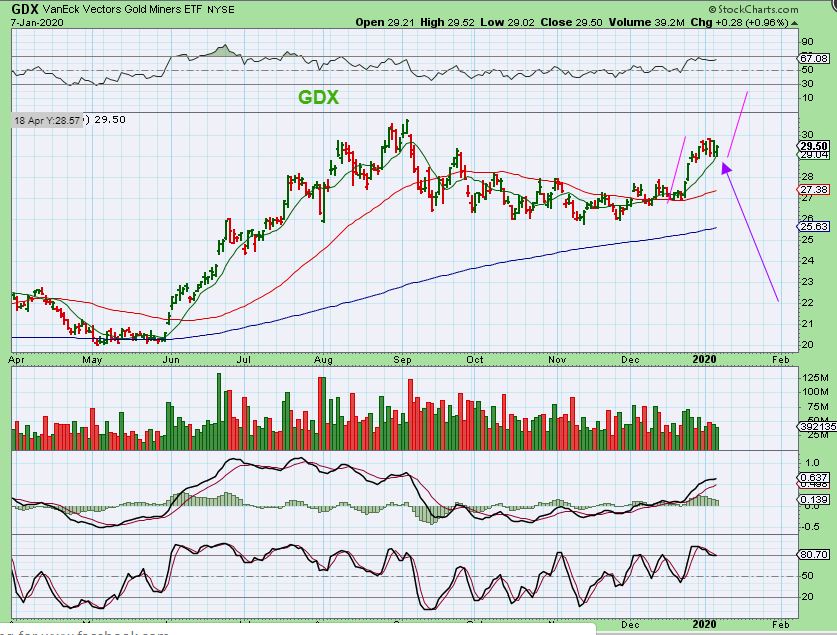
.
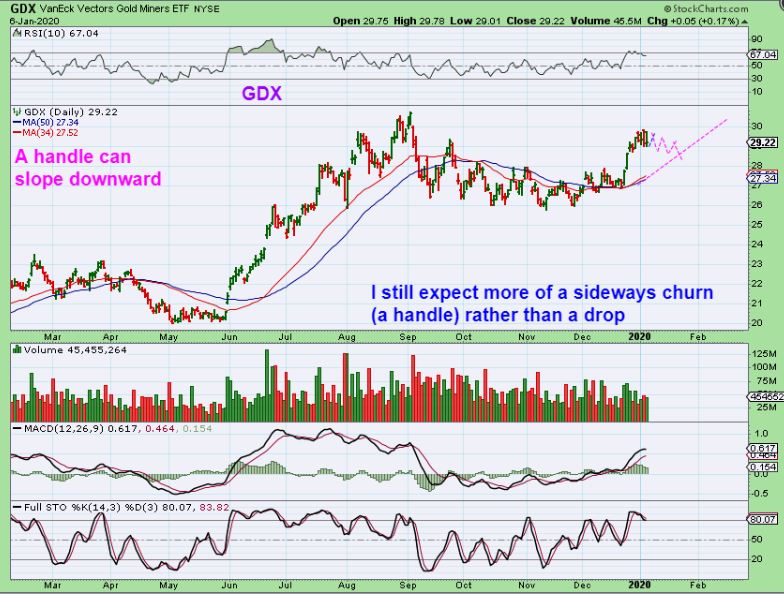
FROM YESTERDAYS REPORT:
GDX – We also could build a handle to the 50 sma if the pause or dip continues. Churning sideways is normal action, you can see it in June/July and the end of July.
.
.
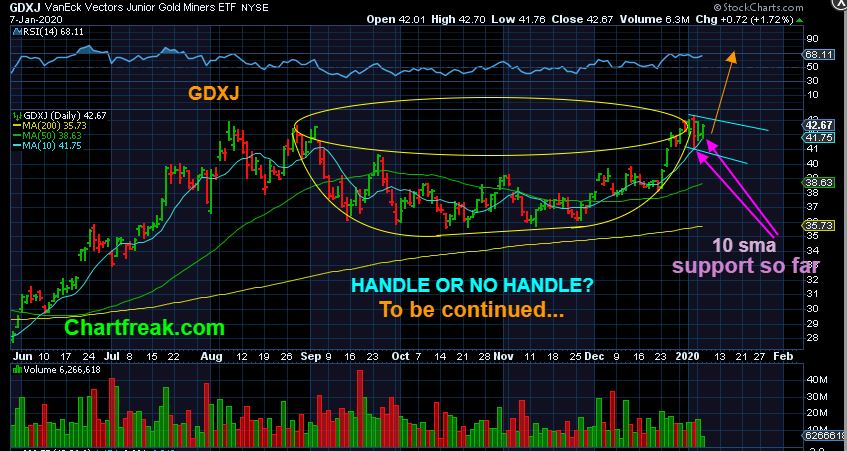
GDXJ – I see that GDXJ has formed the cup, so a handle formed during a consolidation period CAN take place, but price did reverse right off of the 10sma. This may just break out and move higher. I posted this on Twitter yesterday, so you can ignore some of what is written on the chart.
.
EDIT: Due to the ‘News Event’ and the ripple effect into the futures, I may hold off on showing several ‘stock picks’ at this time. Often you will get a gap open in the morning, and then that gap can close on the same day or even a day later. It may be best to let this shake out. Buying Wednesday may cause one to see losses right away if you buy a gap open & watch it close up later. Hopefully you have been invested in Precious Metals or some Energy stocks with my reports. We have seen gains for weeks and it doesn’t look like that is going to change very soon. You can also go back to yesterdays report and watch some of the stock picks from that report. I will cover just a couple of ideas below.
.
Enjoy your Wednesday Trading!
.
~ALEX
.
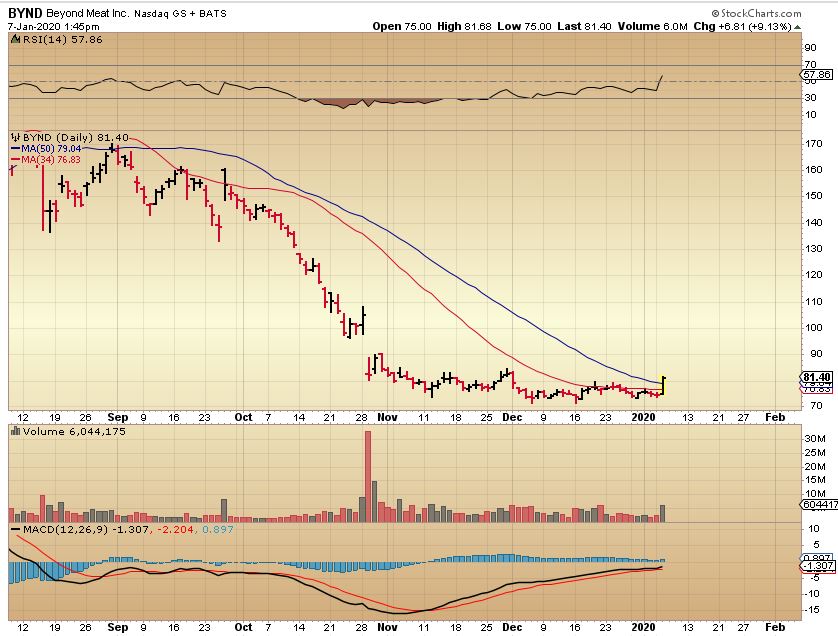
BYND – This is a stock that ran from $60 to $240 in 2 Months! After the Hype finally died down, so did the stock. I’m looking at a base that formed after that sell off & suddenly it Popped with volume (8%). Large divergence also formed. Let’s also zoom in on price…
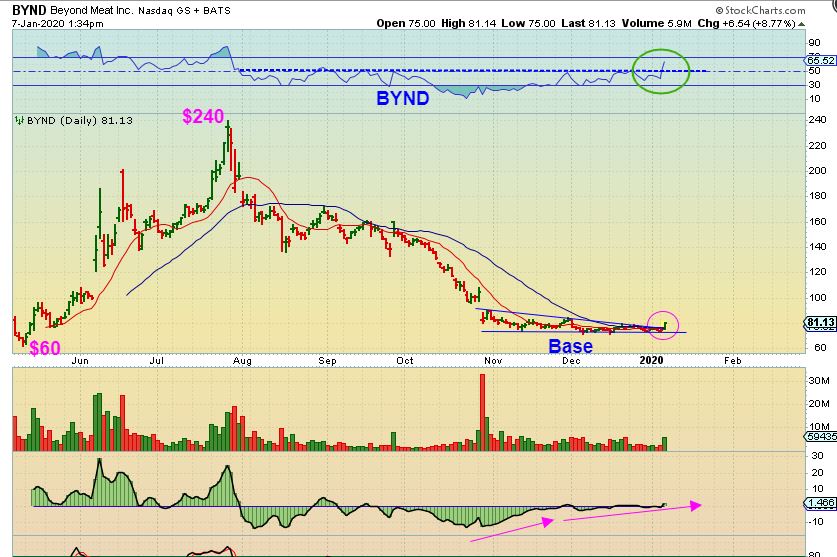
BYND – Price popped above the 50sma too, and this volume was as of midday, it ended up closing up 12%. I think that this has great potential over time. Will it run straight up? I can’t say. I usually start with a small position and try to add on dips.
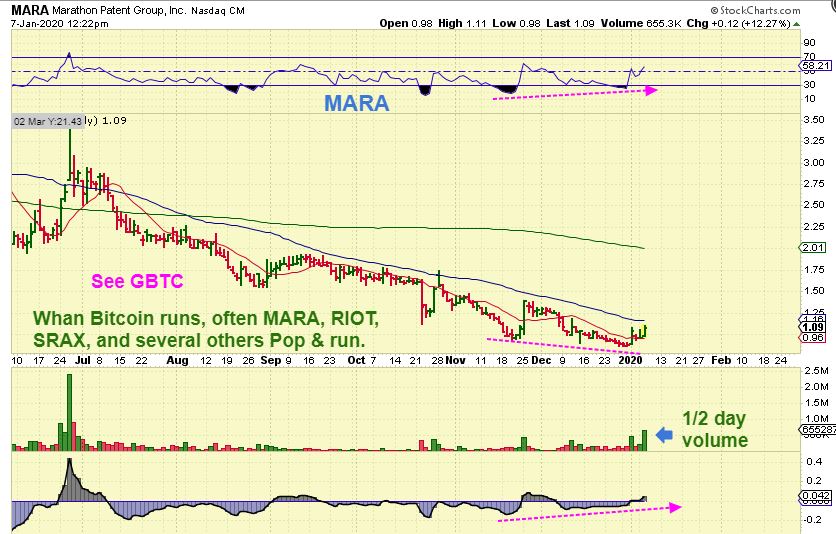
BITCOIN & BLOCKCHAIN Are starting to look very bullish to me right now, so I mentioned it in the live area yesterday (below the report). I am watching it and the blockchain stocks. These can take off like rockets if Bitcoin runs, but they are high risk, so please either start with a small position size, or avoid this sector.
,
MARA – This is 1 example for now. You can look up the other charts of OSTK, RIOT, SRAX, MGTI, etc . This tiny pop was 12% and it could break out & run. The volume came in very strong by the close, and it looked the same on GBTC, RIOT, etc.
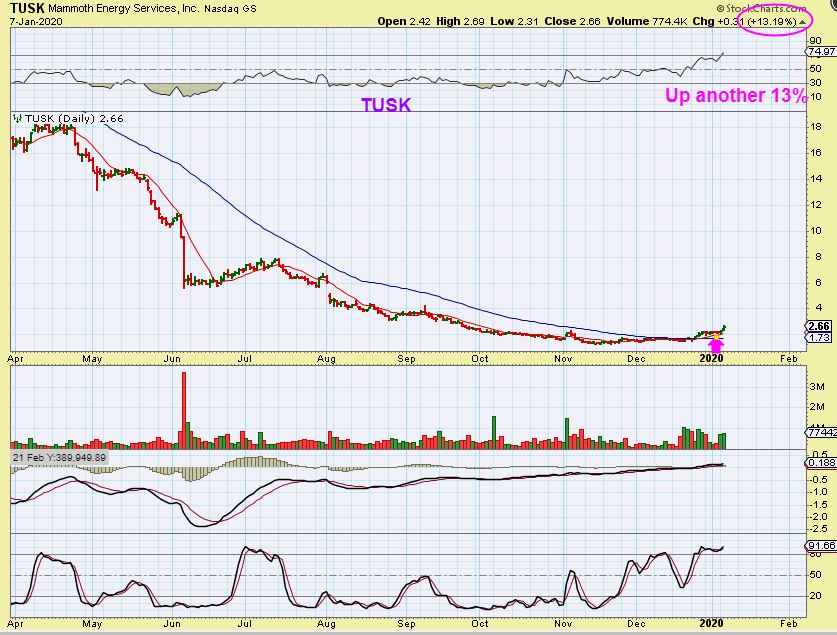
TUSK – The tusk trade was up another 13%, but looking at this chart, it still looks like it has plenty of upside. If it keeps running, I may start to peel some off, I like to take profit on the way up, but this also could be going much higher over time.
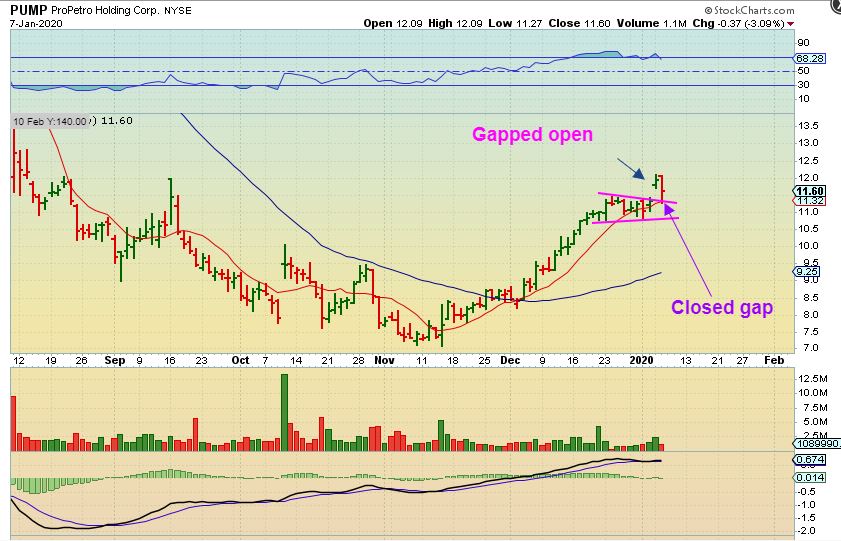
PUMP – And PUMP was another that I was watching. It also moved sideways at the 10sma, but it suddenly Gapped open on Monday. Let’s zoom in.
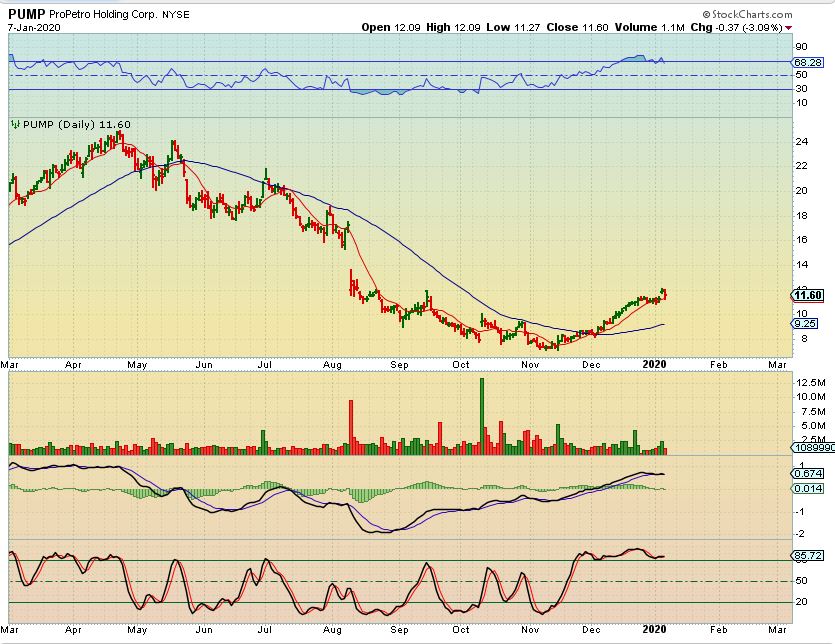
PUMP – On Tuesday it dropped to fill the gap and back test that 10sma. It bounced, so this is a buy with a stop (I’d say a bit loosely) under that 10sma . You do NOT want to ride a back test of the 50sma down if that happens, but this looks ready to run higher.