Wednesday January 29th F.O.M.C.
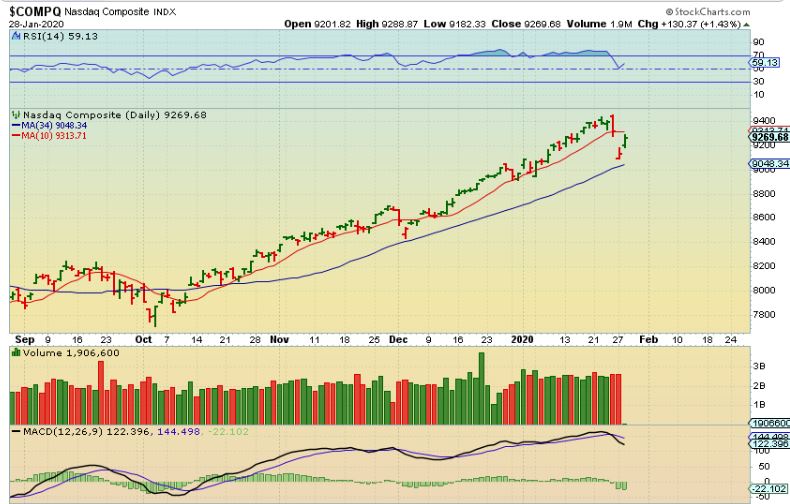
NASDAQ – We have our reversal at a similar point that we reversed in early December. It needs to get above the 10sma to show further signs of recovery.
/
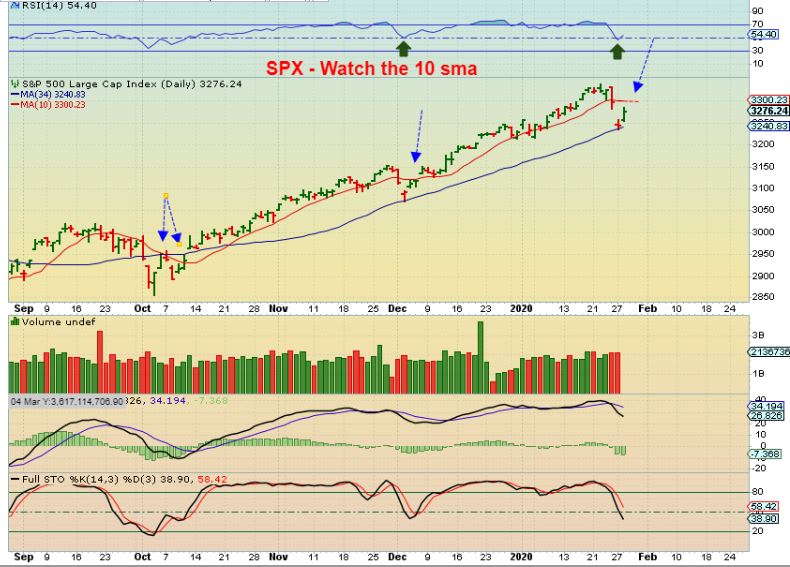
SPX – Since we have an f.o.m.c. decision today, we could get a ‘reaction’ that includes several possibilities , so I will discuss a few of them.
– First look at the OCT DCL. We had a quick drop that didn’t break the lows, so a Knee jerk FED REACTION may involve a drop, but if the lows hold up, the DCL could still be in place similar to the OCT LOWS.
.
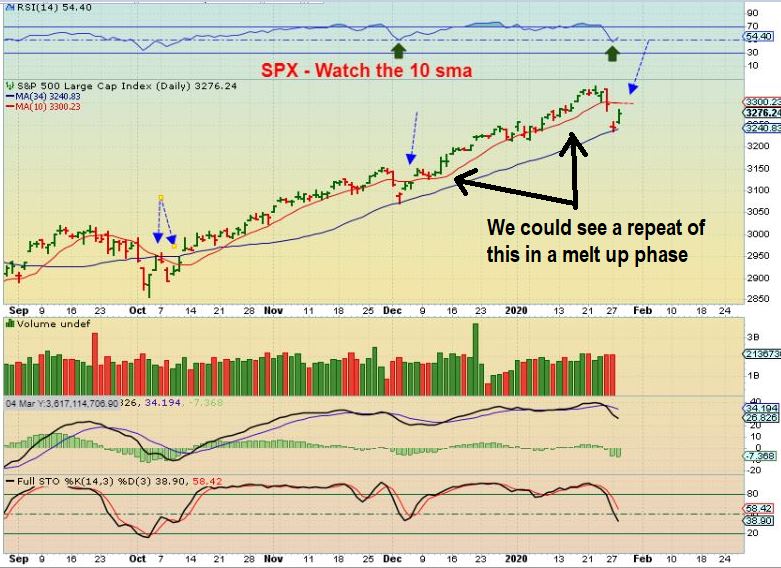
SPX #2 – Breaking & closing above the 10sma pretty much confirms that we have a dcl, because it is now late in the cycle timing & we are due for that DCL. That action would repeat what we saw in December and a ‘Melt Up’ phase could be taking place where the markets run strong with very small pull backs into a blow off top.
.
SPX #3 – We could see the markets make a new high , and then stall & drop as shown. WE ARE COMING DUE FOR AN ICL, and this would start that drop. Since we are due, it is most likley UNLESS we are heading into that blow off top accelerated climb. 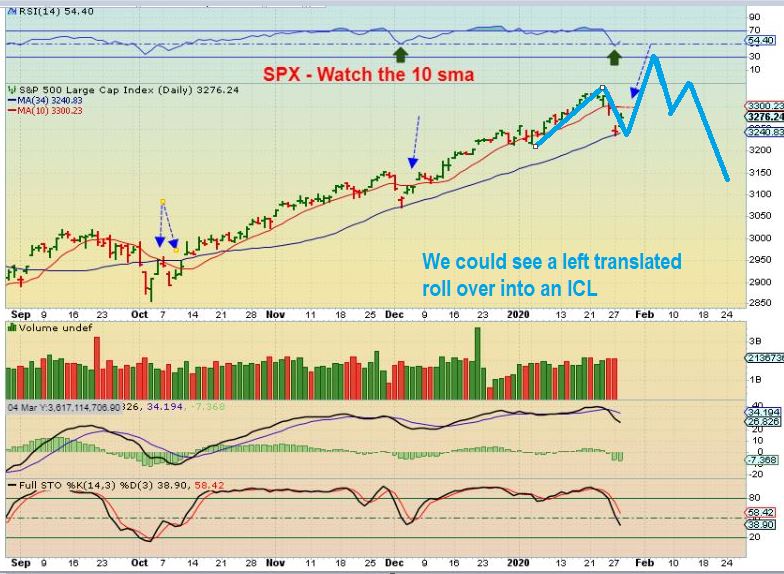
.
SPX #4 – We could get our dcl after being rejected at the FOMC Meeting & 10sma. This would drop the market to the 50sma (not shown), but that dcl would likely be above the Dec dcl.
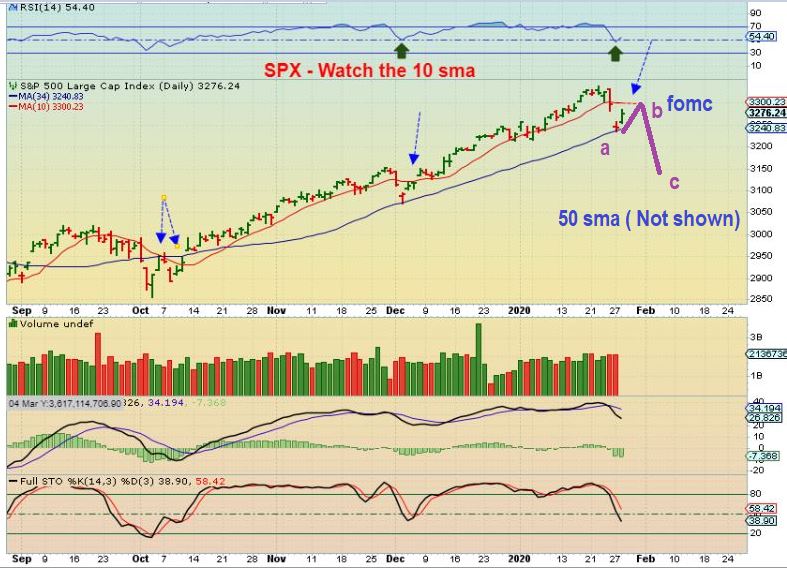
I will discuss all of these possibilities as they unfold, especially in the weekend big picture report. FOR NOW, the way they are traded is that we usually wait for a confirmed dcl, take long positions, and as shown on the last 3 runs, using a stop under the 13 sma keeps you in the trade until it breaks down.
.
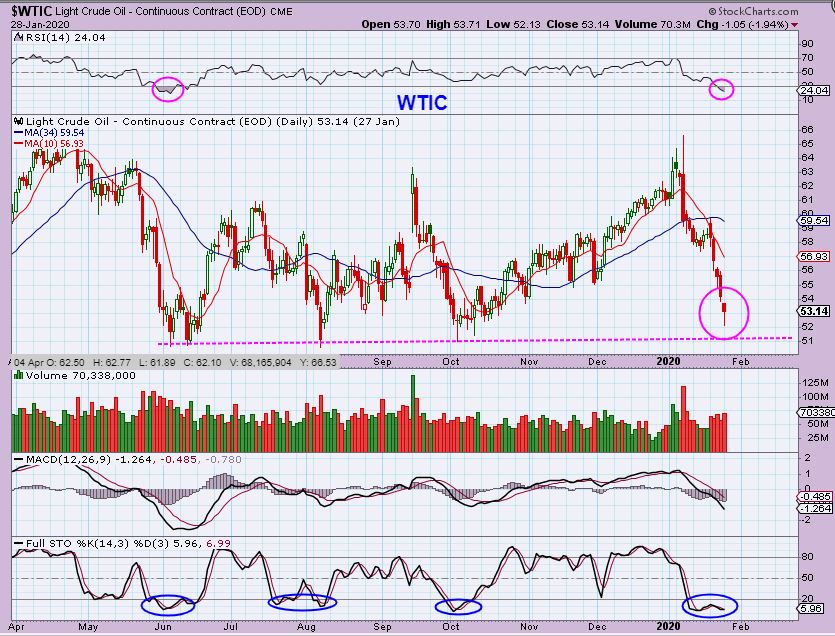
WTIC – Oil has a reversal candle near the lows of a large consolidation. It is due for a dcl, so one could form at any time, starting with a swing low.
.
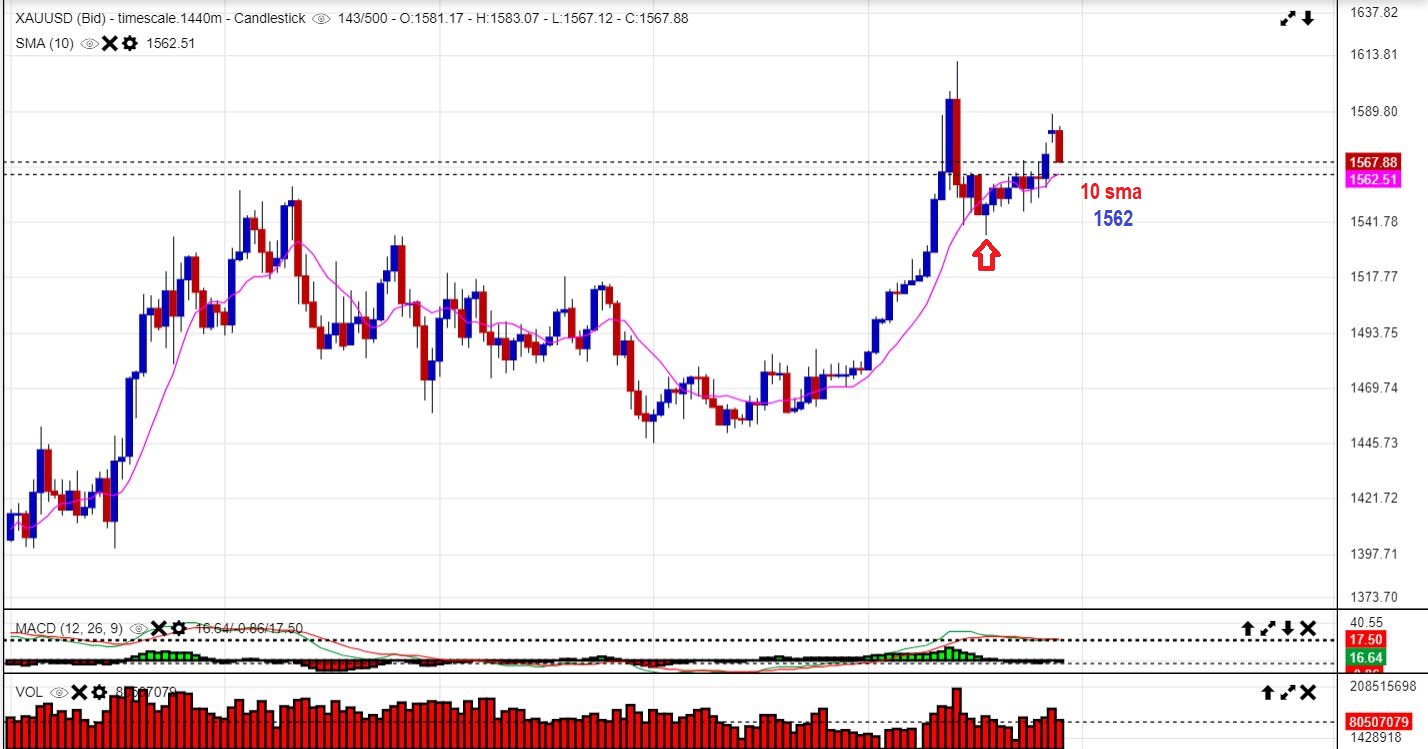
GOLD – PAST FED MEETINGS have not been exceptionally Bullish or Bearish for GOLD. We seemed to get a small knee jerk reaction, but then the pattern that was forming would continue to play out. RIGHT NOW, we have a bullish pattern, but I will explain ‘something else’ at the end of the report that also should at least be discussed. For now, GOLD has been very Bullish for the past 3 ICLs.
.
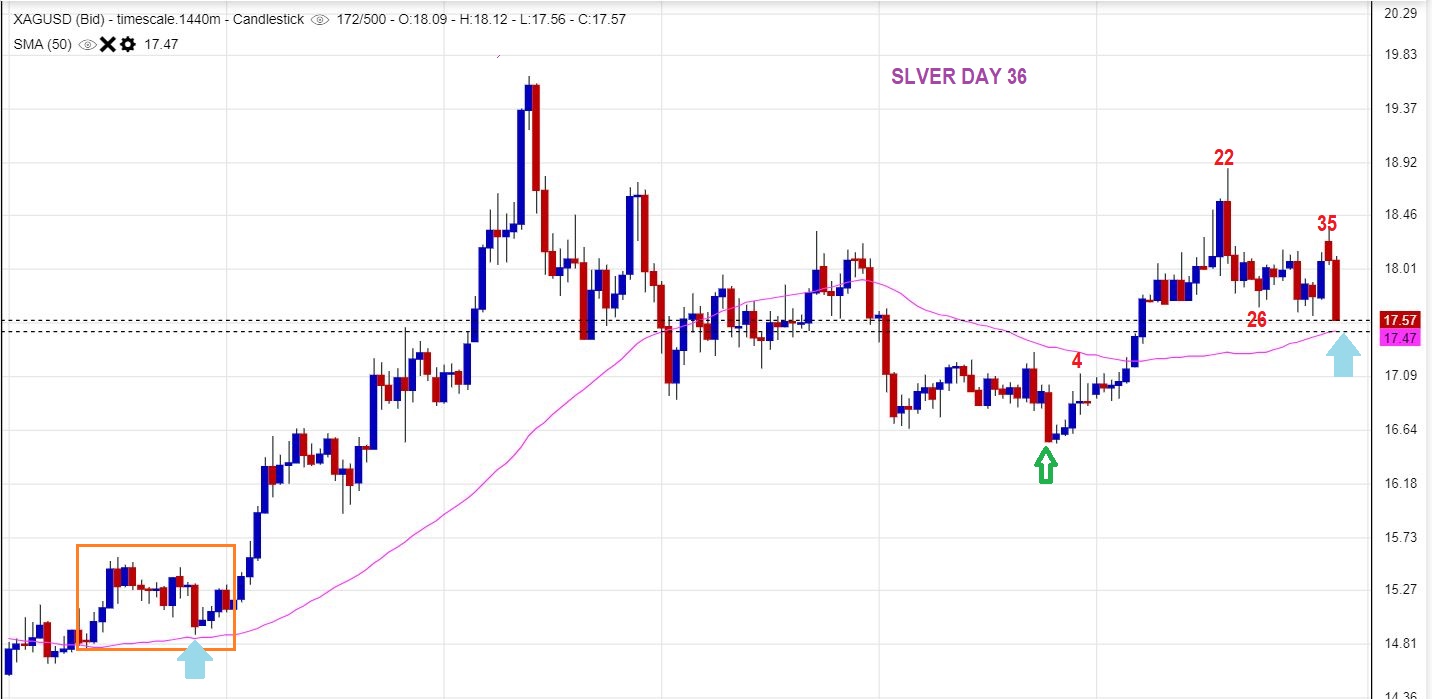
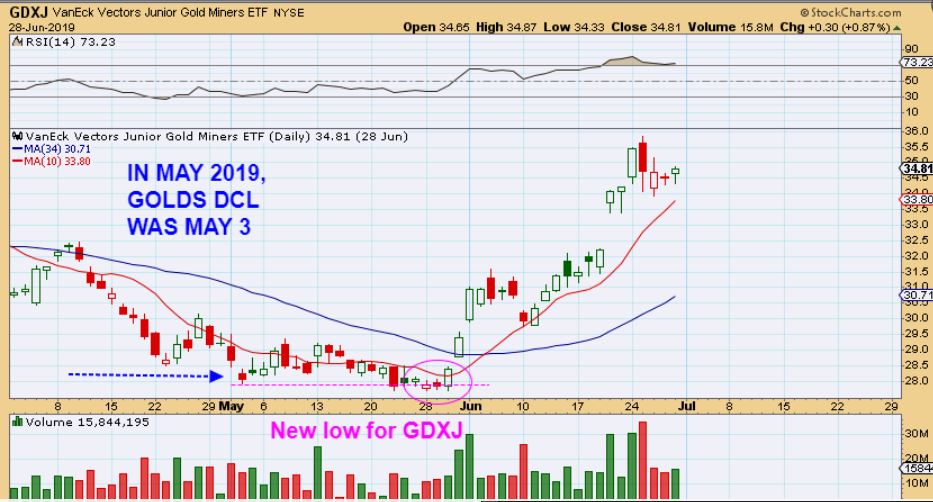
SILVER DAILY – SILVER broke to new lows. IS THIS UNUSUAL? IF you have been with me for a while, then surely you remember how many times I pointed out the MAY 3 2019 ICL in Gold & GDX, but SILVER & GDXJ actually broke those lows at the end of May & then they rallied all together. That simply shows that it CAN happen that SILVER bottoms (DCL) later than Gold. What about such a heavy slam down though?
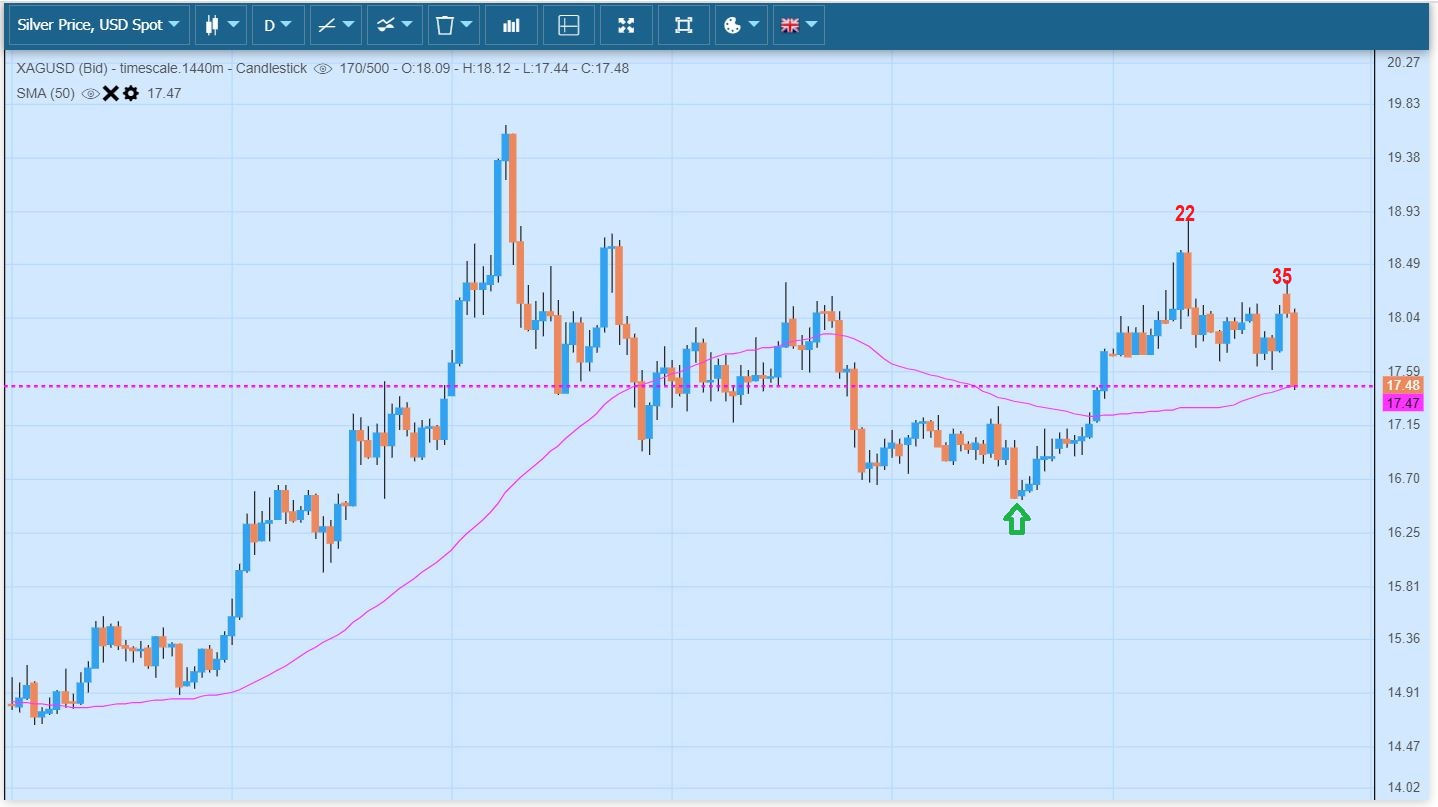
,
SILVER DAILY – We saw a similar final slam down that actually became the lows on the last run higher, so this drop is not unusual. It is a bit concerning to be at the lows at the fomc mtg, because we had taken positions at Golds lows. THAT stops some people out, and some Miners are now near recent lows. lets look at Miners.
.
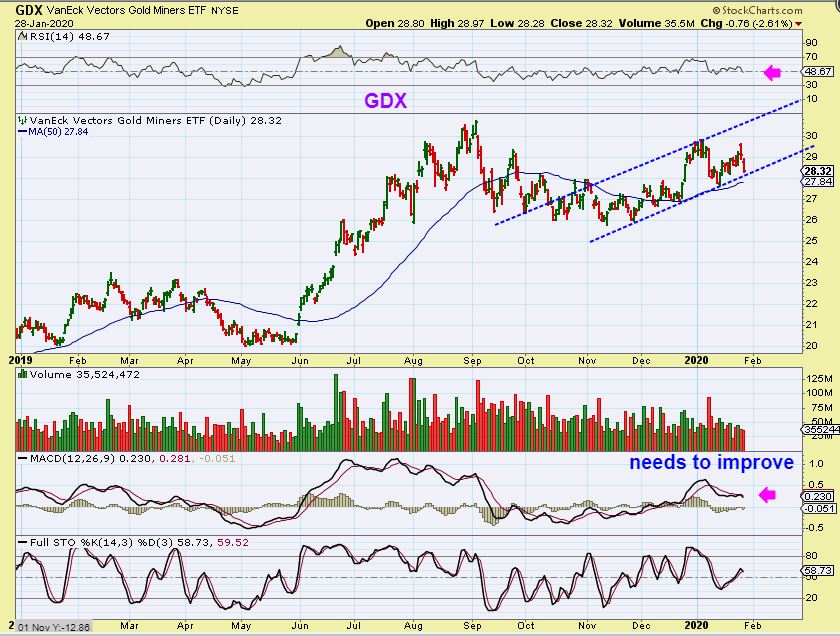
GDX – We had a dcl at the 34 sma 8 days ago. We are back at that 34 sma. I usually go by GOLDS CYCLES, because at times the ‘cycle count’ for Miners is unreliable, but I still track it.
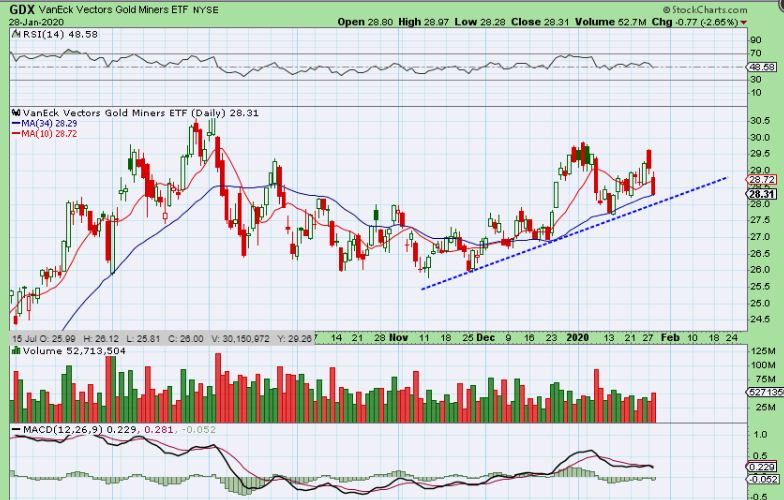
,
GDX –
Being this close to the lows at an FOMC Mtg is unfortunate. WHY? Usually you buy the DCL (lows) & miners move higher. Then at the FOMC MTG, you have ‘WIGGLE ROOM” if it dips & takes off. That space between the dcl & Price allows for a volatile reaction without concerns of being stopped out. Being this close to the dcl is not the ideal situation, but we can’t control that. We can only control positions with stops & then see what happens to the Miners after the fed decision. It would be good if the FED mentioned ‘Inflation’ increasing, and that may cause Miners to JUMP higher & just continue higher – never threatening stops.
,
GDXJ MAY 2019 ICL – And now I have to remind everyone about that time in May 2019, when GOLD & GDX put in a DCL at May 3, yet GDXJ ( & Silver) DID BREAK THOSE LOWS. They all started to run strong together & mentally you just had to be prepared to jump in and ride it. GOLD NEVER BROKE THE DCL, AND IT STARTED TO RALLY AT THE END OF MAY, AND THAT IS WHAT MATTERED. We actually rode this run and collected exceptionally good gains – so we will be ready to react when the time comes.
.
We just have to wait and see how this plays out after the fomc decision is released. It is helpful to remember that the initial reaction or ‘knee jerk reaction’ may or may not be the follow through direction that market sectors will continue in. I try not to trade the first reaction, but getting stopped out is always a frustrating possibility if you are near the lows at an fomc mtg.
.
Below I will discuss just a couple of additional thoughts. It’s a Fed Day, enjoy your Wednesday trading, or set your stops & just go out for a walk 🙂
.
~ALEX
.
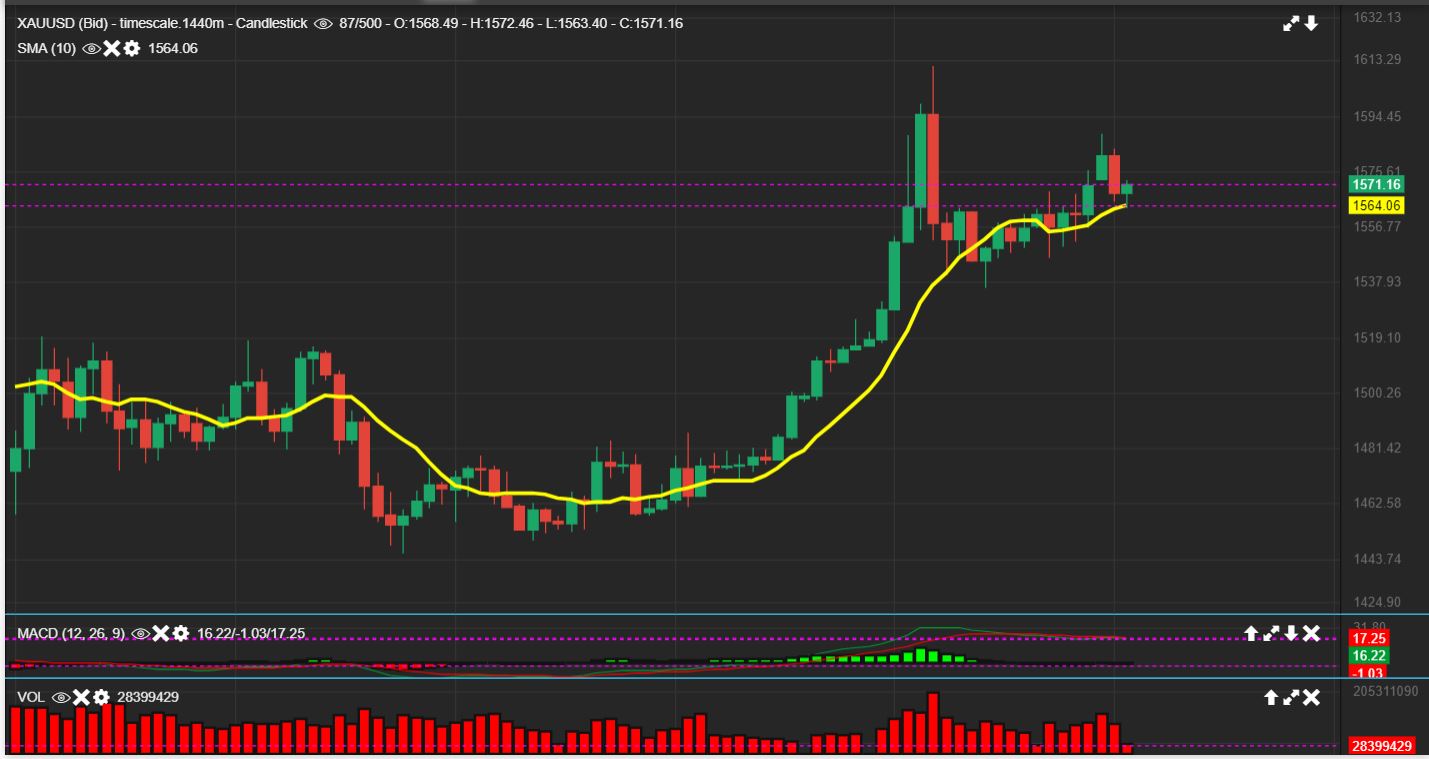
THIS IS GOLD PRE-MARKET – Bouncing off of the 10 sma so far.
.
Next I wanted to mention again what I am following in the MJ Sector. We had the initial break out from the sell off,a nd I mentioned watching the pull back when it comes , to look for ‘signs of strength or failure’. IS THIS THE START OF A NEW UPTREND? OR IS IT A FALSE BREAK OUT? I am looking for signs….
.
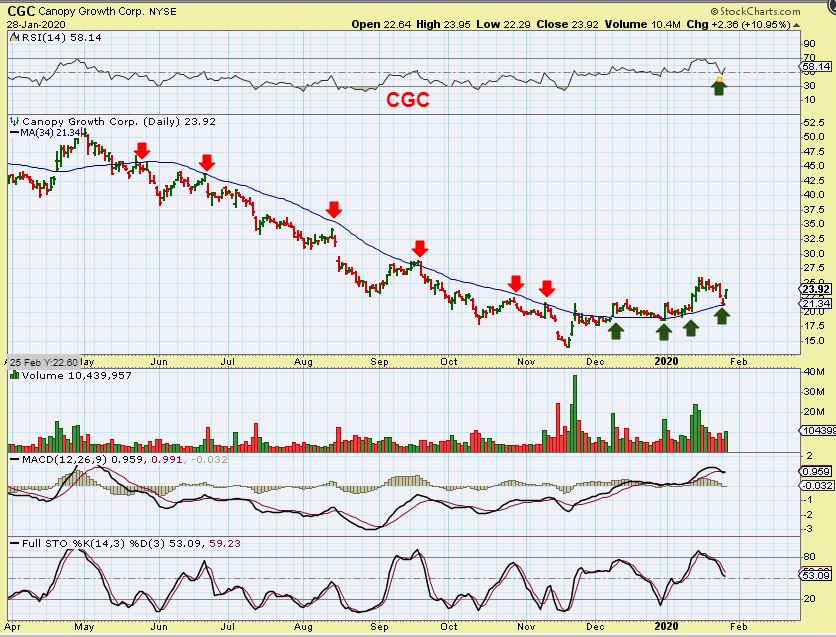
CGC – So many are exhibiting signs of a recovery. CGC is detailed here as breaking the down trend, and finding support on the pull back. This is – so far – a Bullish set up.
,
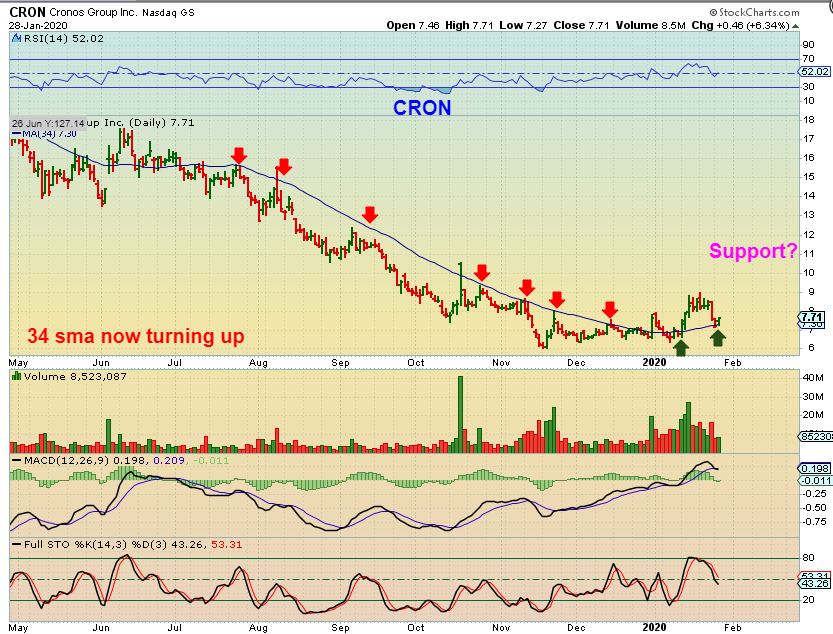
CRON – CRON may be following what CGC has done since it dropped QUICKLY to the 34 sma, and then stopped & reversed. It may take a little more time, but the sector seems to be finding support & buyers now. You could be seeing a bottoming process, and then the run higher will be very profitable, based on past runs in this sector.
,
SECONDARY THOUGHT – THIS IS NOT MY MAIN LINE OF THINKING AT THIS POINT: I’m SORRY, but I have to at least point this out. I have been trading MINERS for over 20 years. I CAUGHT THE LOWS IN MANY MINERS IN THAT 2000 – 2001 period as Tech crashed down and I distinctly remember certain times in my trading that STOOD OUT as different.
I DO REMEMBER CERTAIN TIMES THAT STAND OUT WHEN I WAS TRADING MINERS IN 2000-2011 , and That may be because they were frustrating and maybe even hard to understand as I went through those times. In Hindsight they made sense, and I’ll discuss what was happening here. So let me show you 1 or 2 of those periods of time, and it involves EXTENDED CONSOLIDATION PERIODS. 🙁 I AM NOT saying that we are there, but you need to at least see this for future reference.
.
Let’s take a look…
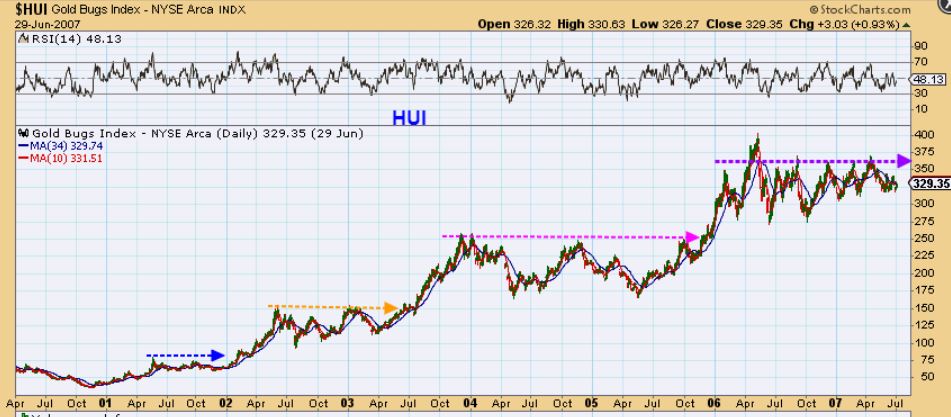
HUI – After a strong Bull run that had a several higher ICLS in place , I would be forced to trade during sideways consolidations. THESE WERE FRUSTRATING AT FIRST, as price chopped up & down repeatedly. This chart shows a few of those times. It is a very bullish chart, but hard to trade. We still had rallies, but I want to point out some of the choppier times. Lets go to the next chart…
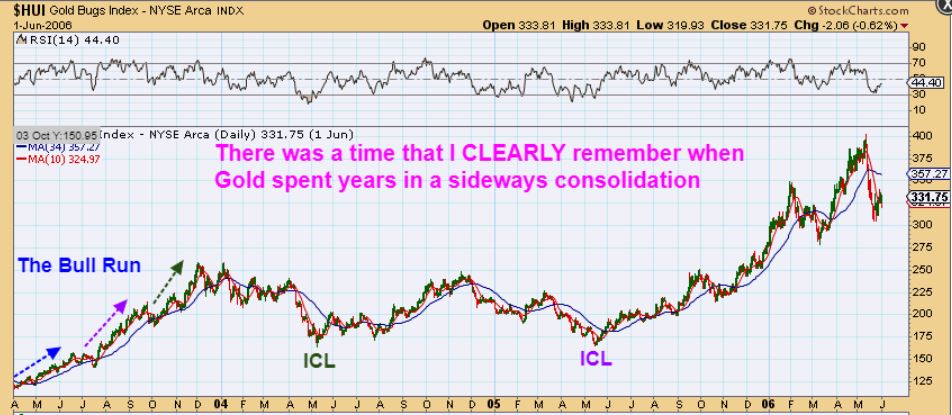
HUI – Left side of the chart : After the big run in March to November 2003, it became a very choppy top for months ( 1st Magenta box) before dropping to an ICL . After a huge Multi ICL run from the May 2005 lows for over a year, it then chopped in a BIG WAY in 2006-2007 ( 2nd Magenta box).
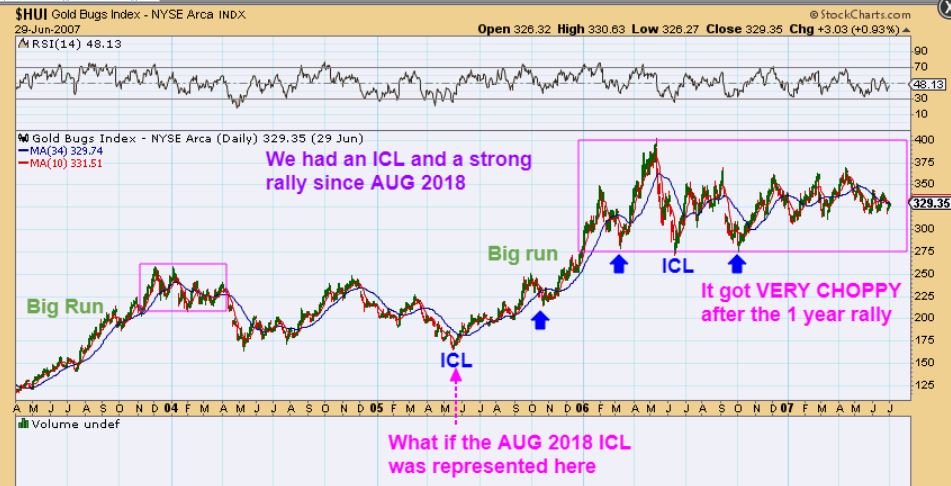
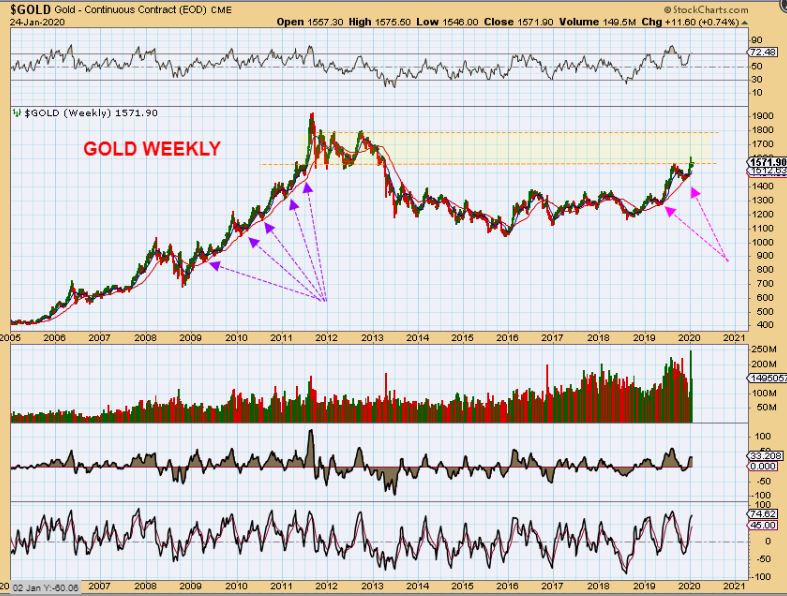
So might we be seeing that first Box now after running higher for over 1.5 yrs? It is not possible to tell, but we are at resistance for Gold. Let me show you what I’m talking about…
In this JAN 24 Weekend chart, I just showed that we are at resistance for Gold. I would have expected it to stall ( it has), but for how long? We won’t know until this plays out. Gold might run straight up through to $1700-$1800, and THEN chop sideways for a while, and that is what I am expecting, but I just wanted to point out why at times things get so choppy. It DOES NOT mean that this isn’t bullish…
HUI BULL RUN- ALL BULL MARKETS CHOP SIDEWAYS ON THE WAY HIGHER. It is called consolidation periods after a nice run higher. Trust me, I traded Miners during this whole time period, and during the boring times of chop or during times that they would begin the drop to an ICL, I had to trade other areas. I think that we will know more about what kind of set up we are in after the fomc mtg. It can blast higher & run swiftly. Or it might remain choppy & somewhat directionless. I EXPECT a run higher, but time will tell.