Tuesday January 14th _ Things That We Are Watching
Todays report is rather long and covers a few different things that I am watching…
,
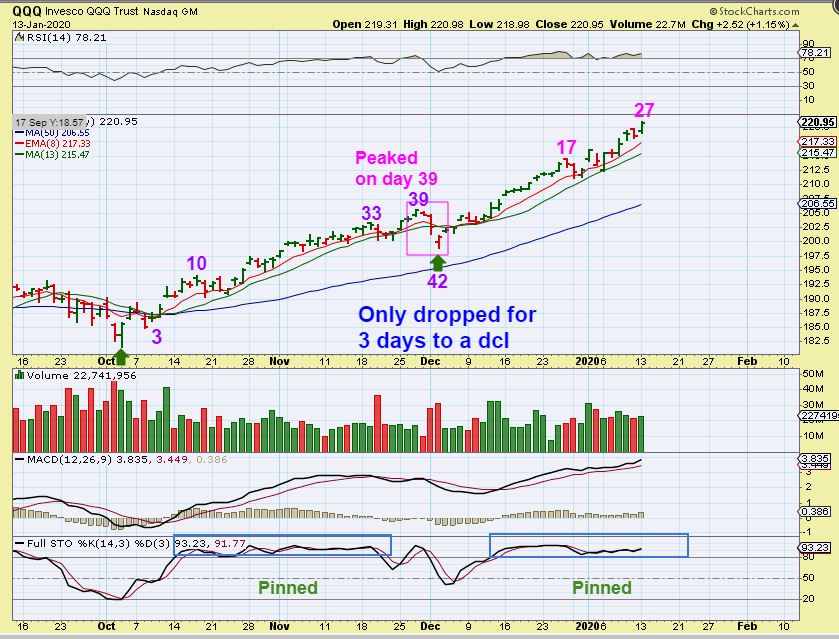
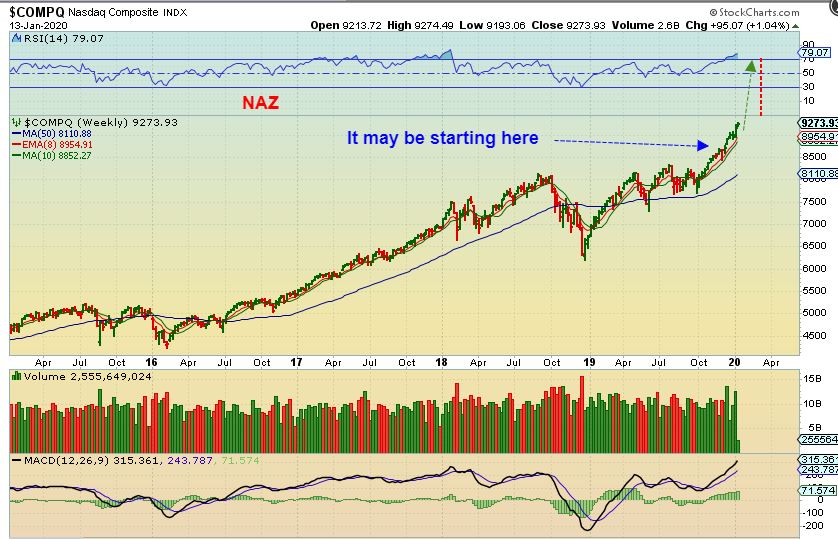
QQQ – We are watching another strong run out of a dcl, and it appears to be even a little steeper than the last one. This has had me wondering if we would see a Melt up type of a run in the General Markets. I have mentioned that a few times.
Notice that the last run ( or daily cycle) peaked on day 39 and bottomed on day 42. Currently we are on day 27 and this run looks a bit steeper, and that could become parabolic, so I want to discuss that a bit next. Use a stop at the 13 sma and you are still in the trade.
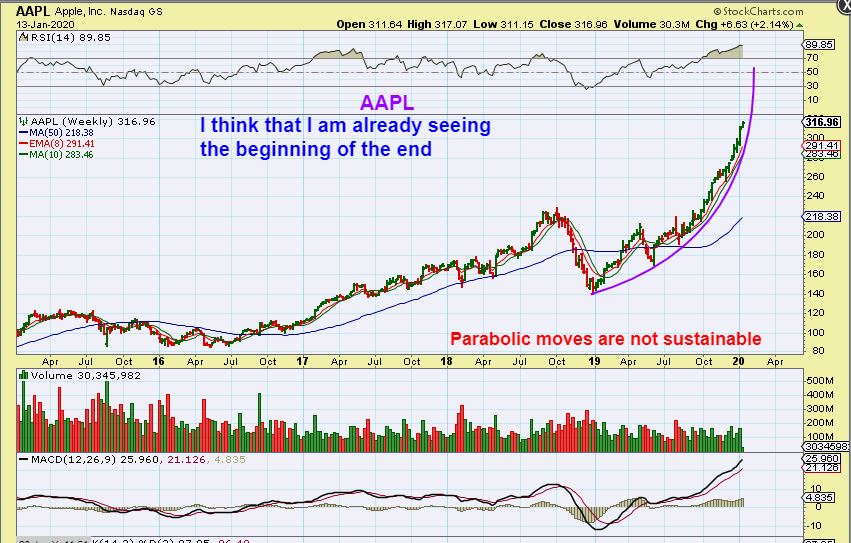
AAPL – I have seen parabolic moves in the past and they do not consolidate sideways on a weekly chart. They get steeper and steeper and suddenly there is a big crash. AAPL and a few other stocks look parabolic already. $200 to $300 had only a slight consolidation.
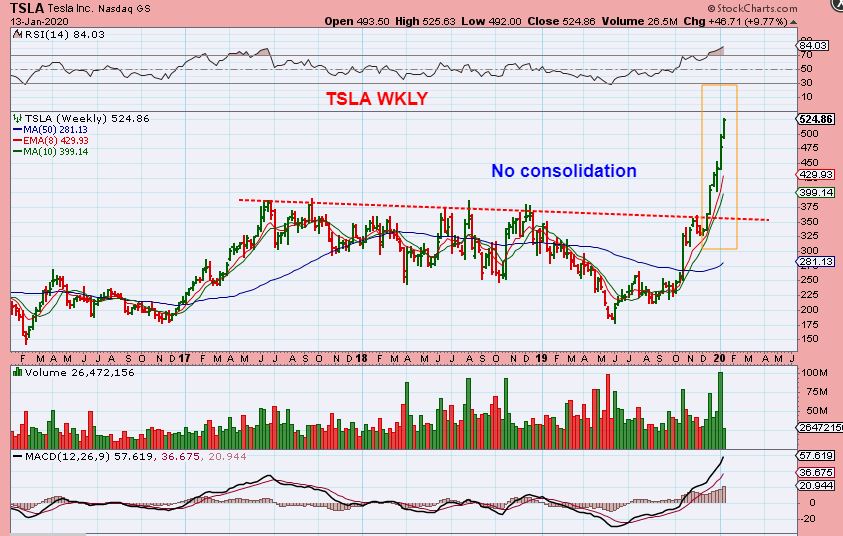
TSLA – When you see 6 weeks straight up with no consolidation, it looks so bullish, but I recommend caution too . Let me show you something eye-opening…
.
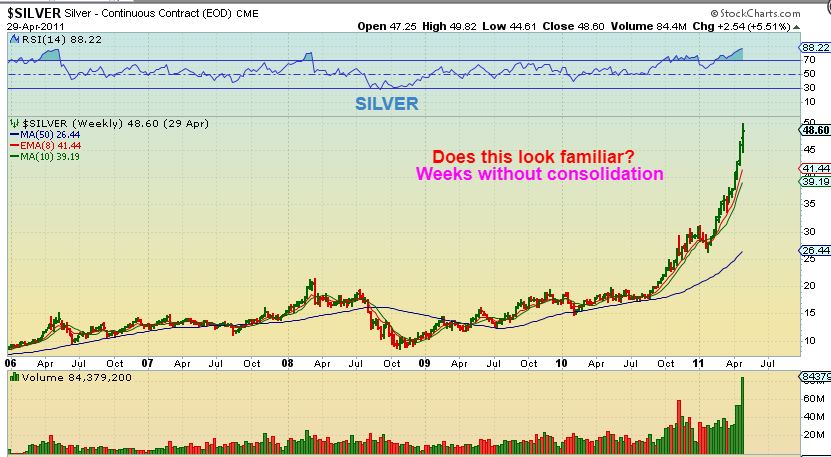
SILVER PARABOLIC – This was the SILVERs parabolic ramp higher. We saw 10+ weeks of straight up without any real consolidation. Great gains, right? And then…
.
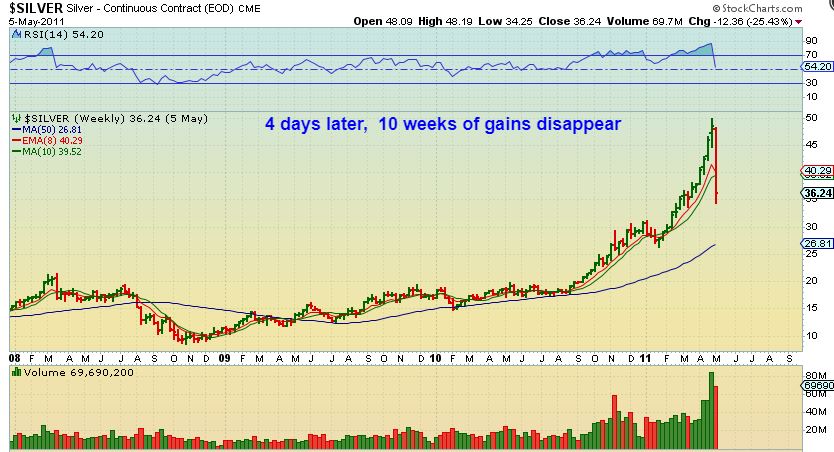
SILVER PARABOLIC CRASH – in just 4 days 10 weeks got wiped out. This is a 1 week drop made up of only 4 days. This is how they end.
So I have been saying that my thinking is that the General Markets may begin melting up. It does look like some individual stocks already are, and when it ends, it drops FAST. If AAPL & TSLA Crash, others will likley follow. Then it is game over for a while. I would then expect some of that Money to flow into Miners, and those Miners will have a BIG push higher. It does not take much to push Miners higher. PLEASE SCROLL UP AGAIN and look at SILVER and then compare it to TESLA and then AAPL. There are others too, and we just need to be aware of that.
.
Right now, we could be weeks away from a top if we do melt up. We could melt up into MAY and crash in the summer, but we’ll just have to wait and see how this plays out. I’ve been watching AAPL, TSLA, and a few others and thinking that if they break down, others should follow and this run will end too. I will still show some Bullish set ups until the cracks appear. USE STOPS.
.
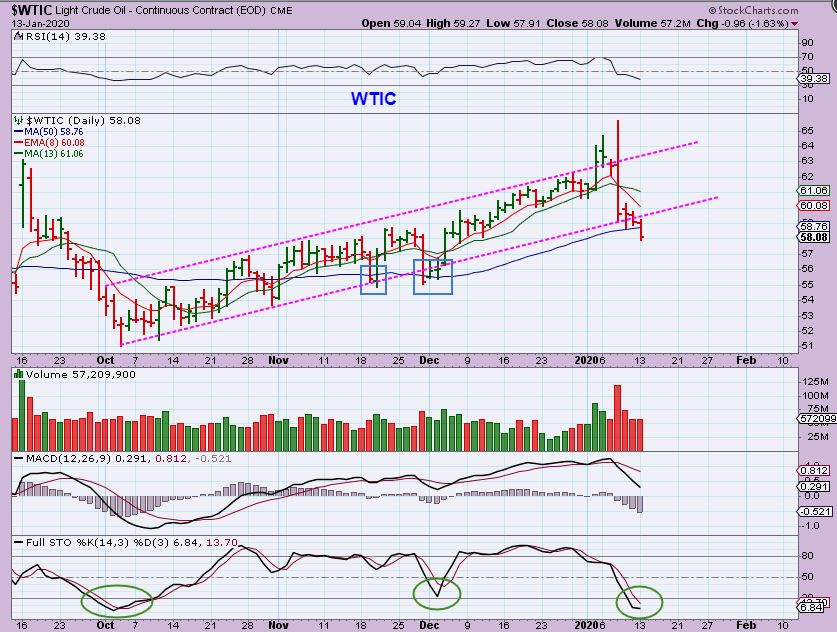
WTIC – Oil continued to sell off and broke below the 50 sma. I put squares to show that we have seen this before, but after the Iran ‘over throw’, it crashed and has continued lower.
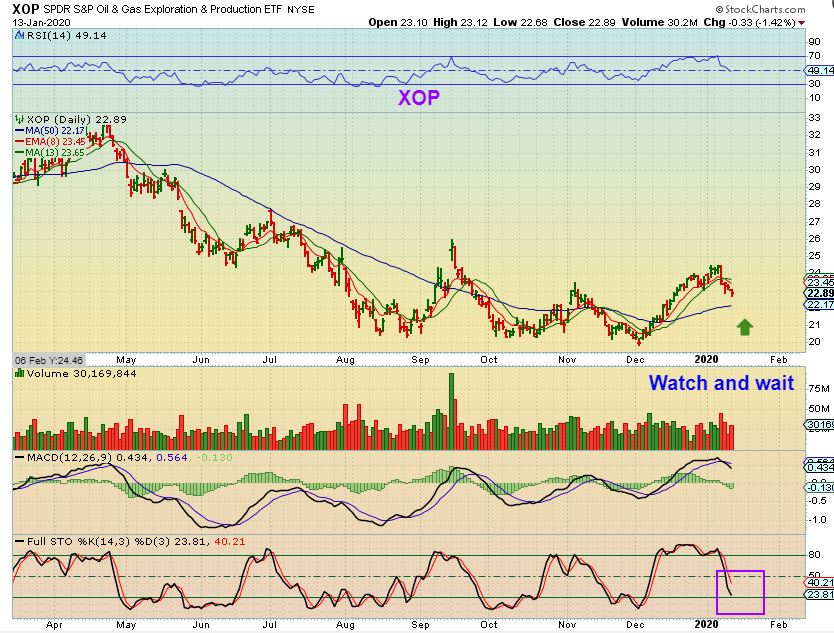
XOP – The XOP looks like it can drop further. The 50 sma is lower and it is not quite oversold. This selling looks lighter than Oils selling, so we may see a reversal near the 50sma , but I would wait to see how this plays out. Look at OAS, WLL, and DNR and you will see that they are near the 50 sma. DNR actually reversed on the 50 sma with Oil selling off , so these are things that I will watch for as Oil sells down.
.
PRECIOUS METALS SECTOR : DID WE EXPECT ANY MORE DOWNSIDE? We did…
.
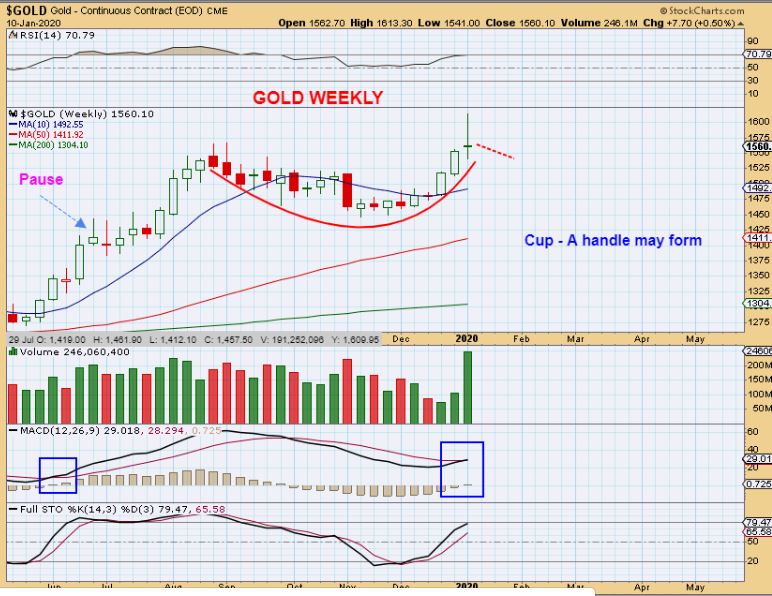
THE WEEKEND REPORT SAID : GOLD WEEKLY– We may see that down sloping sideways crawl here, and it would form a handle on this cup. This is a very Bullish set up, I do NOT think that this is the end of the run.
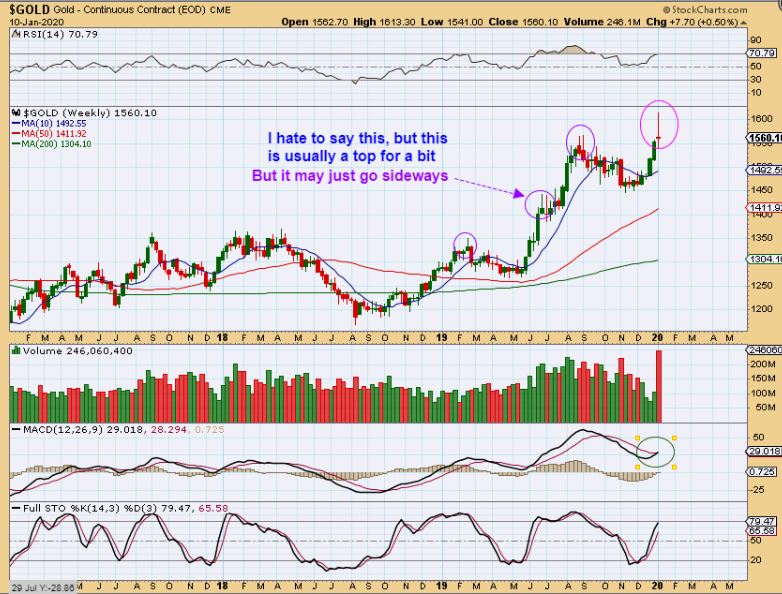
I ALSO SAID : GOLD WEEKLY– Plain and Simple, this is a reversal off of the highs and most often a short term topping candle. so…
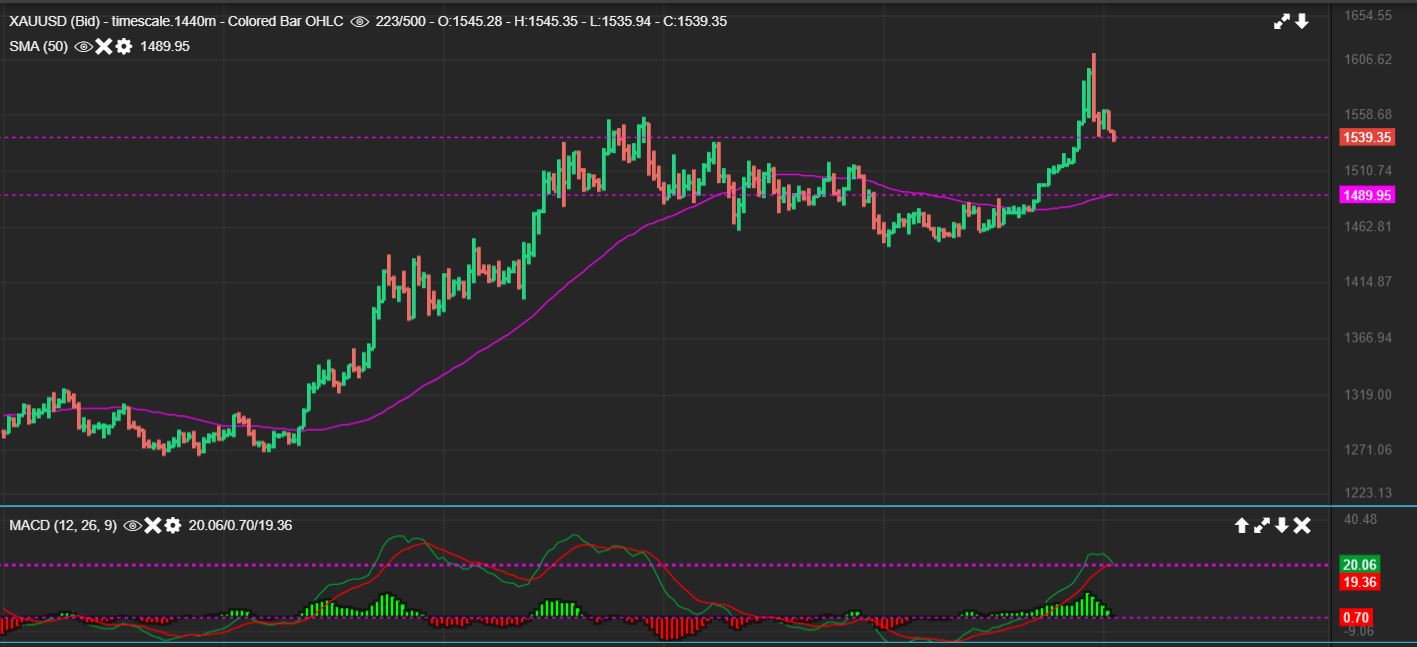
GOLD – Gold was expected to sell off further and may form a handle. We saw some selling and it is not expected to be over with just one day. I would have to say that the $1525 area is a reasonable target.
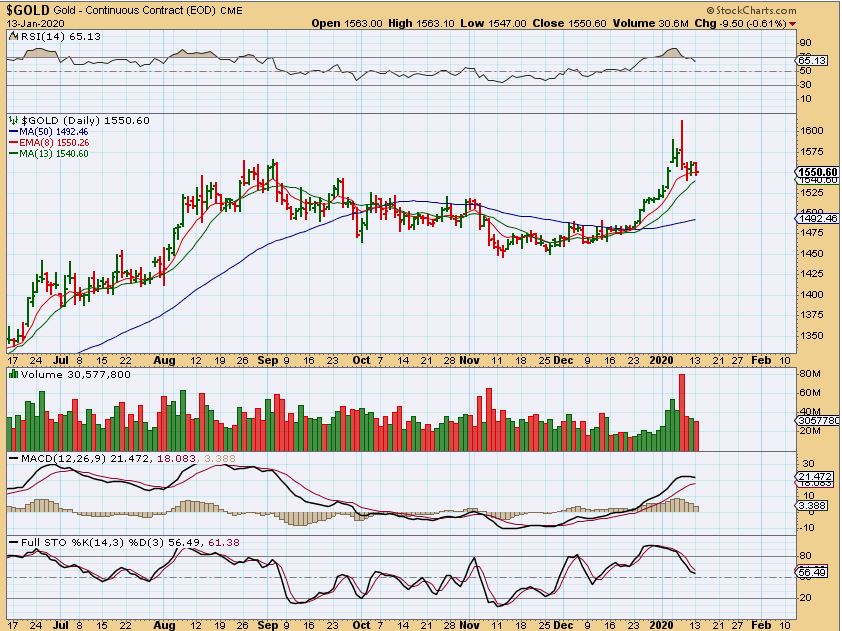
GOLD – As I write the report Gold dropped further, but it still looks normal. Unfortunately the BIG POP at the Iran Missile launch exhausted the run in the short term. I don’t think that it terminated the run, but those exhaustive moves often top it for a bit.
,
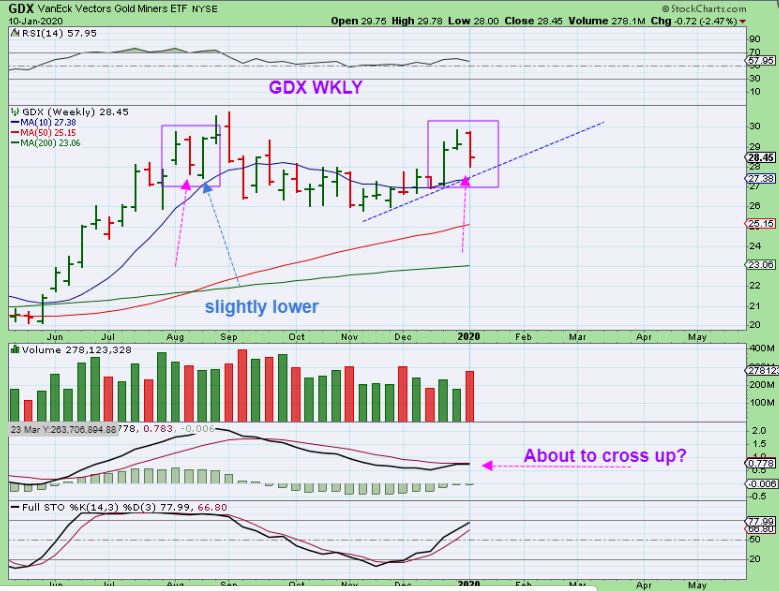
IN THE WEEKEND REPORT: GDX WEEKLY – We had a similar candle with that bounce off of the lows, but it did drop a bit lower the next week before strongly rallying higher. So this might drop to the trend line if Gold stalls next week.
.
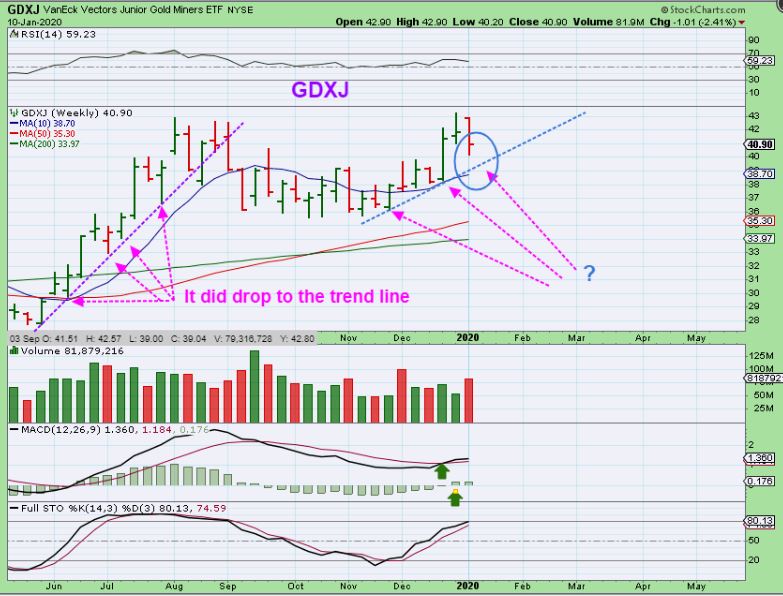
IN THE WEEKEND REPORT: GDXJ WEEKLY – GDXJ could drop to the 10 week ma, a possible target with that trend line too. See the chart.
.
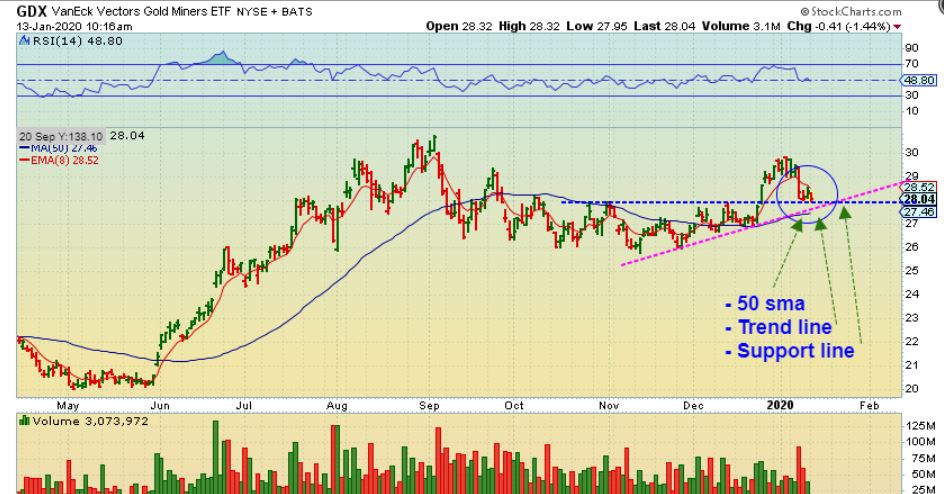
GDX 10 a.m. Eastern time – I captured this chart after 1/2 of trading to show where this drop may take us in GDX. Let’s just say roughly $27 ish?
.
GDX at the close – We knew it could drop & it did. This could be a bull wedge, but we’ll have to see if it breaks up after tagging the 50 sma or not. We saw lighter selling on this drop than we did last week, so sellers may be in control, but they also may be drying up. We need some buyers to come in and prop up price.
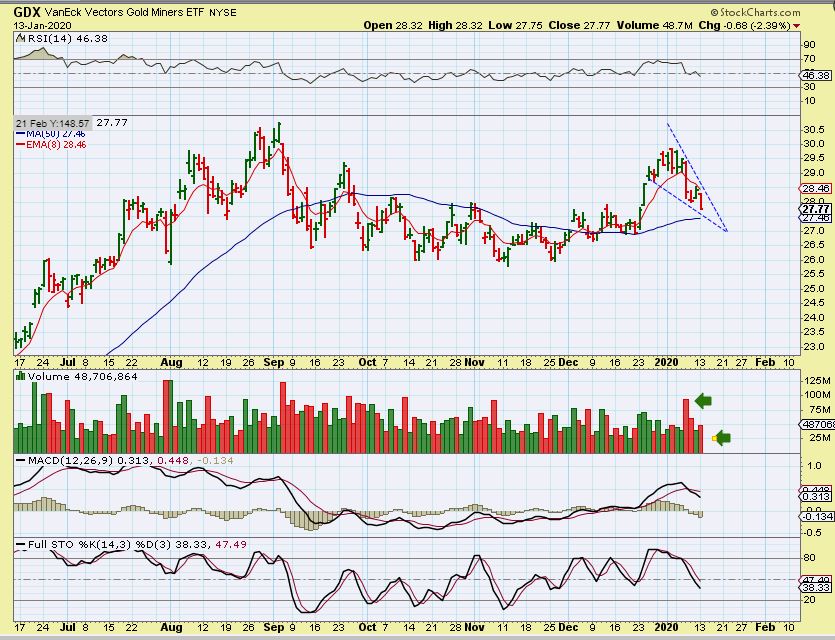
MINERS OFTEN EXAGGERATE THE MOVES IF GOLD SELLS DOWN, SO I WANT TO DISCUSS THIS TOO, SINCE GOLD MAY DROP SIDEWAYS FOR A BIT.
.
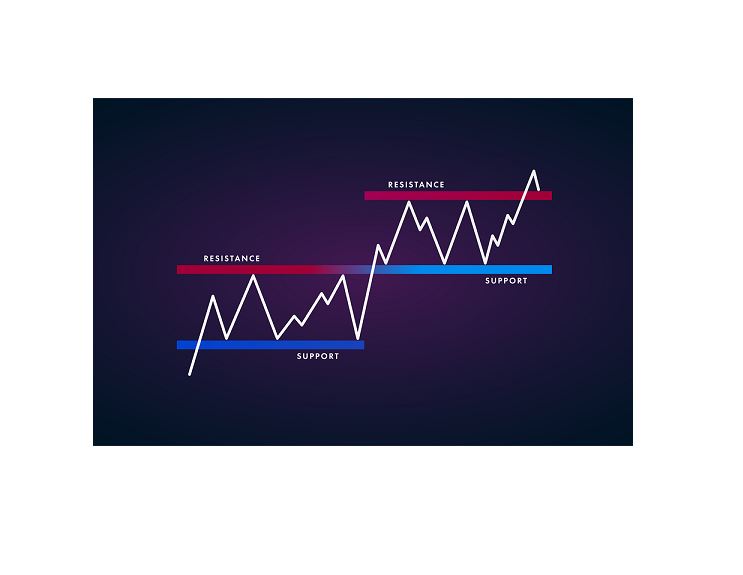
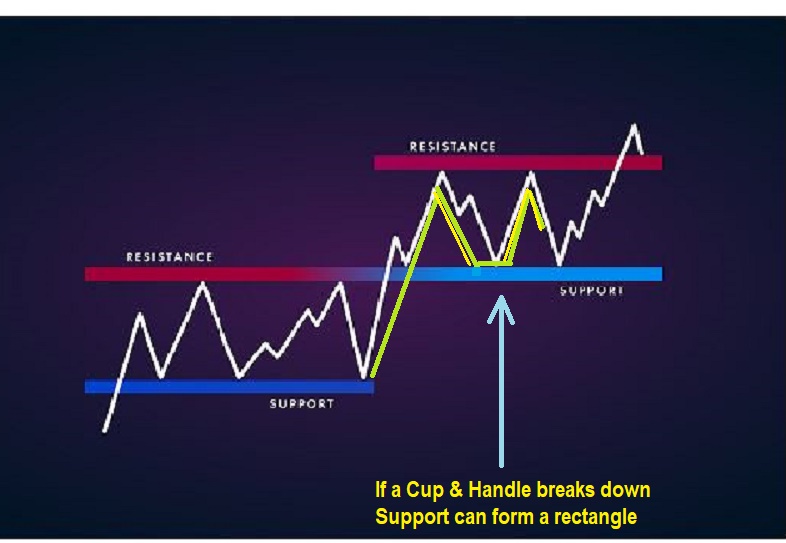
This is the opening Theme picture, but I have doctored it up a bit with a green cup. I DID NOT EXPECT THIS TO HAPPEN, but I was asked, “WHAT HAPPENS IF THE CUP & HANDLE BREAK DOWN WITH GOLDS SELLING? DOES THAT MEAN IT IS BEARISH?” It doesn’t, but it can happen. So here I am showing that rectangle consolidations form when price rolls lower between upper resistance and lower support. If a handle drops down too far, it is no longer a ‘cup & handle’ and it can become a normal box or rectangle consolidation. The blue arrow that I drew in here is pointing out a cup & handle that failed. What may have started as a cup turned into a tag of lower resistance. Currently I am looking for a bounce from that wedge shown above and do not expect this.
.
So we knew from the charts in the weekend report that we could have further downside in the Precious Metals Sector. We have to watch and see how this plays out from here, but so far nothing is ‘broken’. We have to see what Tuesday and the rest of this week hands us and go from there. I also wanted to continue to share some additional trade ideas below outside of precious metals.
.
Enjoy your Tuesday trading.
.
~ALEX
.
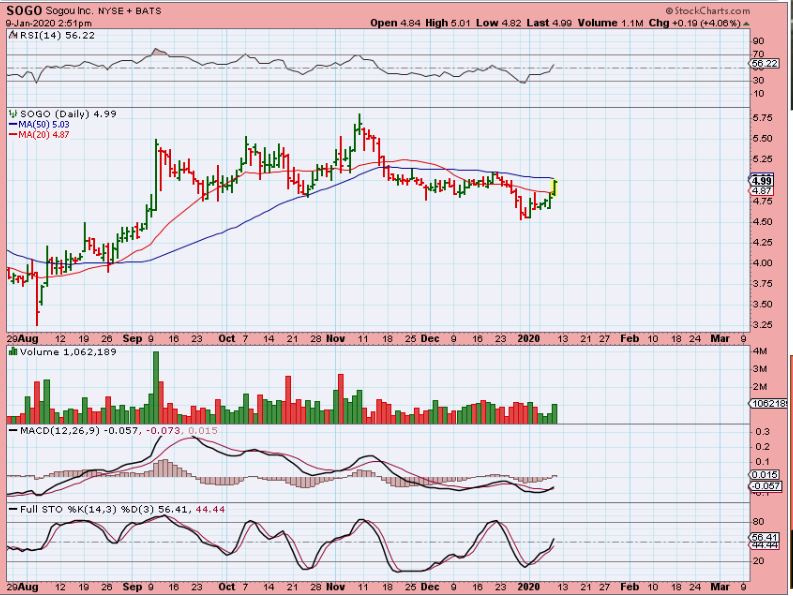
SOGO – The Chinese Companies were popping ( YY, YELP, BIDU, etc), so I discussed SOGO on this chart. It looked ready to break that 50 sma ( a buy) .
,
SOGO – It gapped onto the 50 sma yesterday , so I bought it and mentioned it in the live area. I want to point out…
,
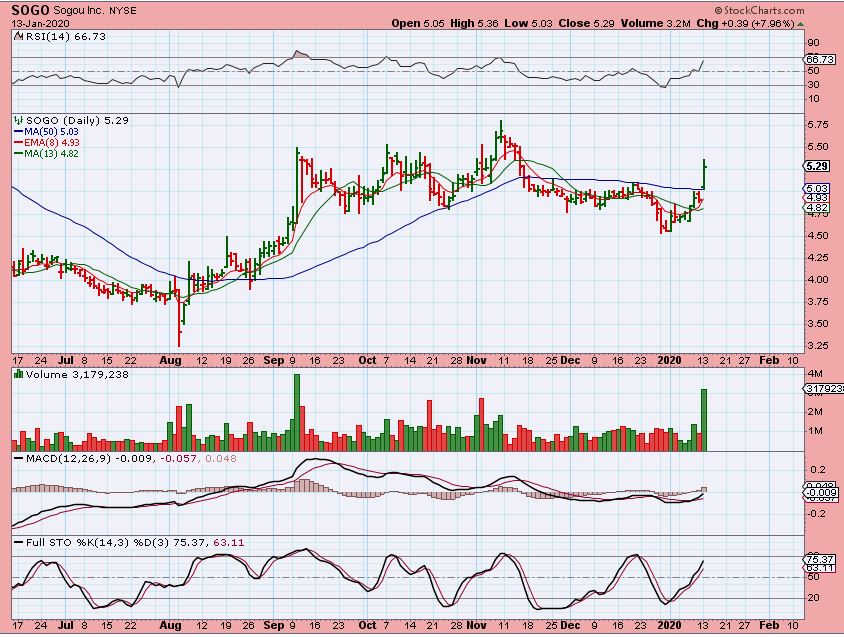
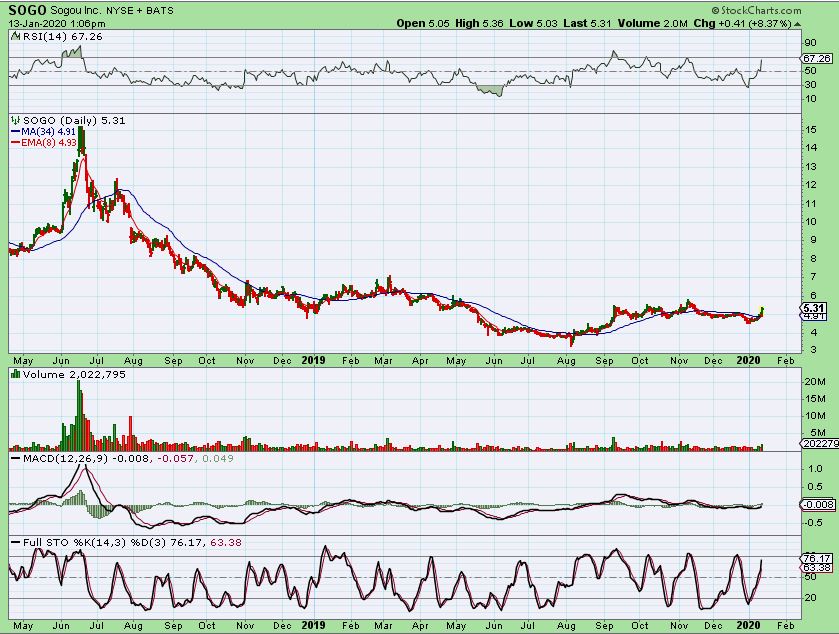
SOGO – The long term chart. This shows a massive base area that could lead to big upside potential, so I still think that this is a buy. Notice that SOGO went parabolic in 2018, but had its crash and based already.
,
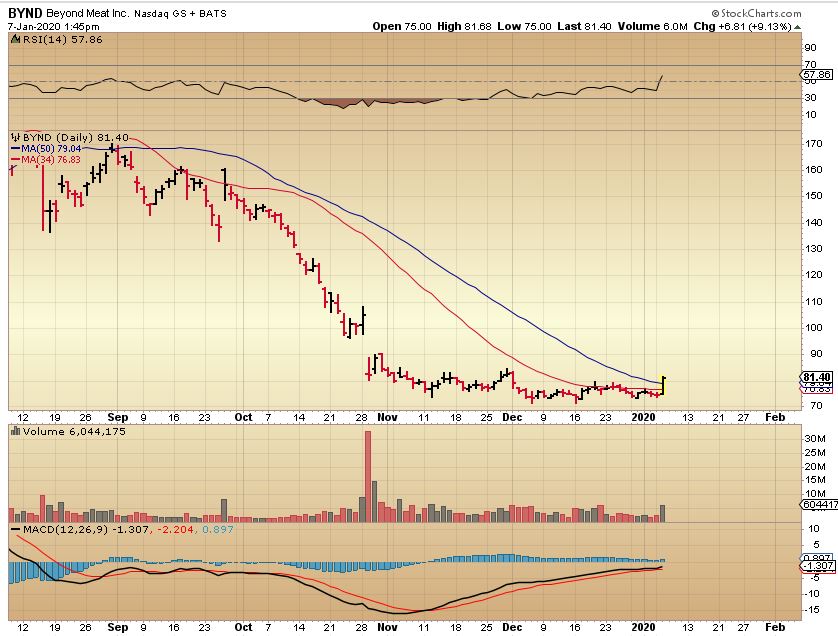
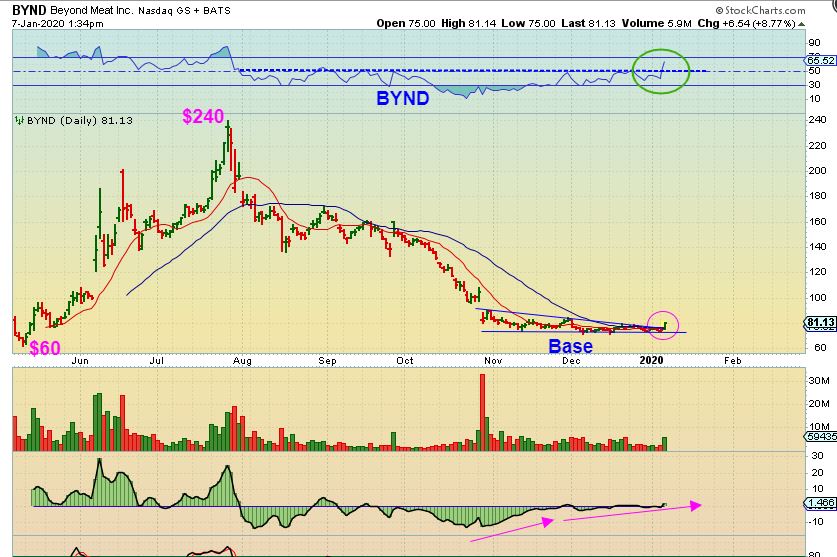
BYND – I used these 2 charts of BYND to show that it was a buy as this base pushed through the 50 sma with a volume pop.
,
I also mentioned that it ran up 300% in 3 months in May – July
,
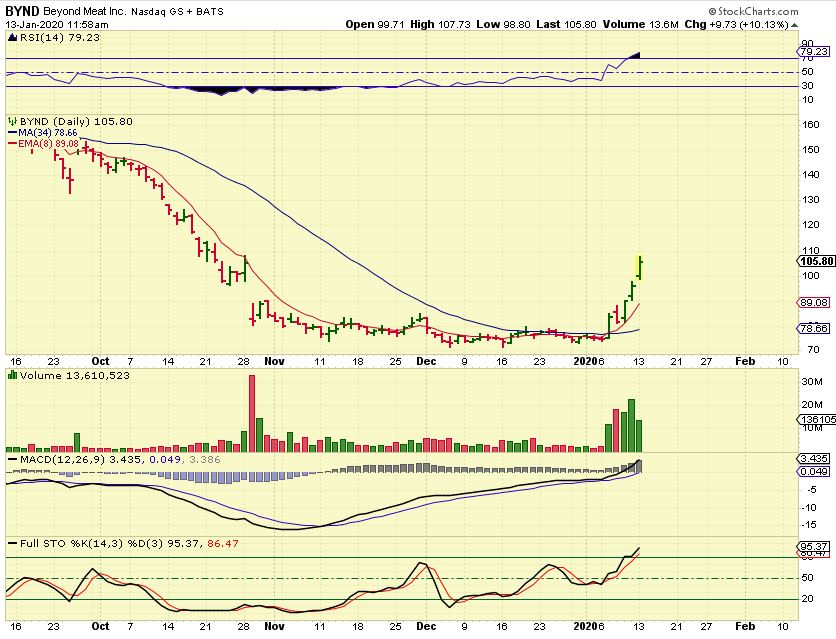
BYND – I grabbed this midday to show that it is running again. It actually closed up even higher at $114+, up another 20%. I always say that a move out of a base can be simply acceleration and just run to prior highs. Waiting for a pull back can leave one behind.
,
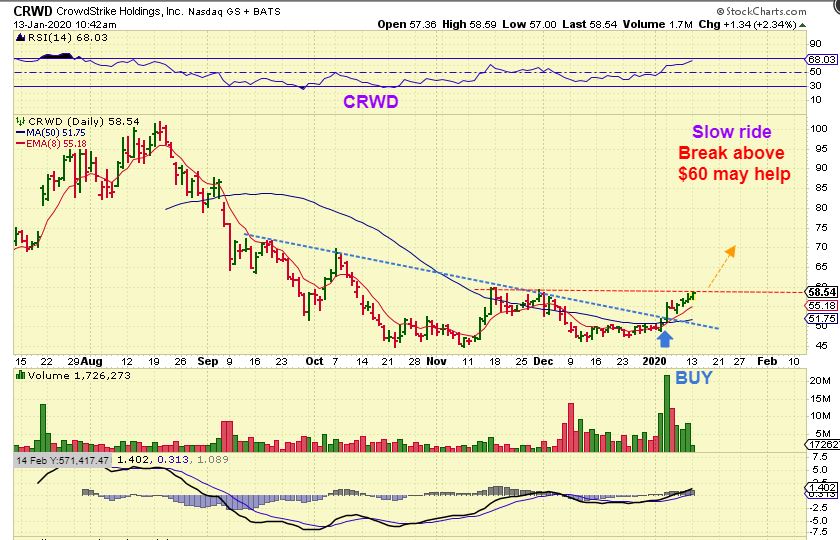
CRWD – CRWD was a buy near $50 and it is still progressing to the November highs too. I think that it could pick up speed if it gets through this resistance. Let me show you what I mean…
,
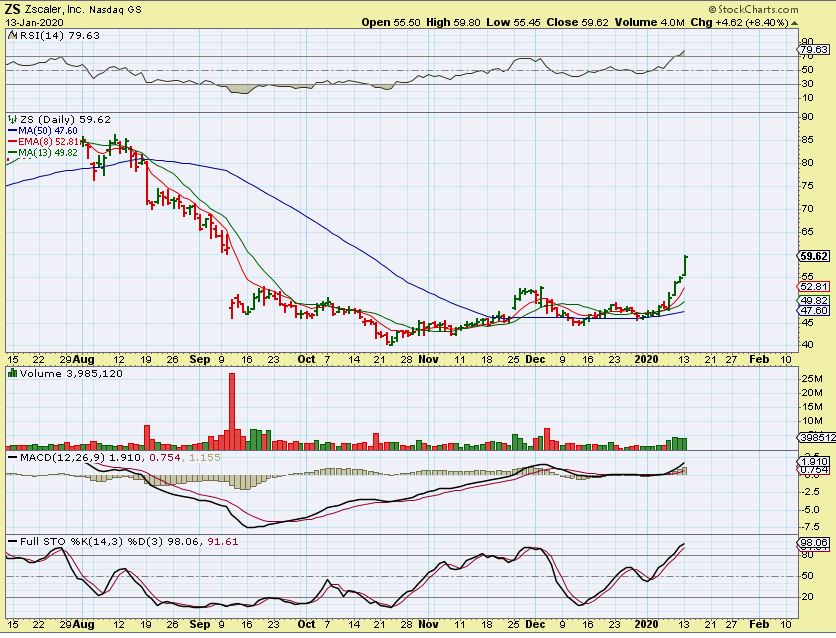
ZS – This is what I mean. ZS also started up slow off of that 50 sma, but once it broke, it is really stretching out now. It was filling a gap with no resistance, but leaving a base can accelerate a move too.
,
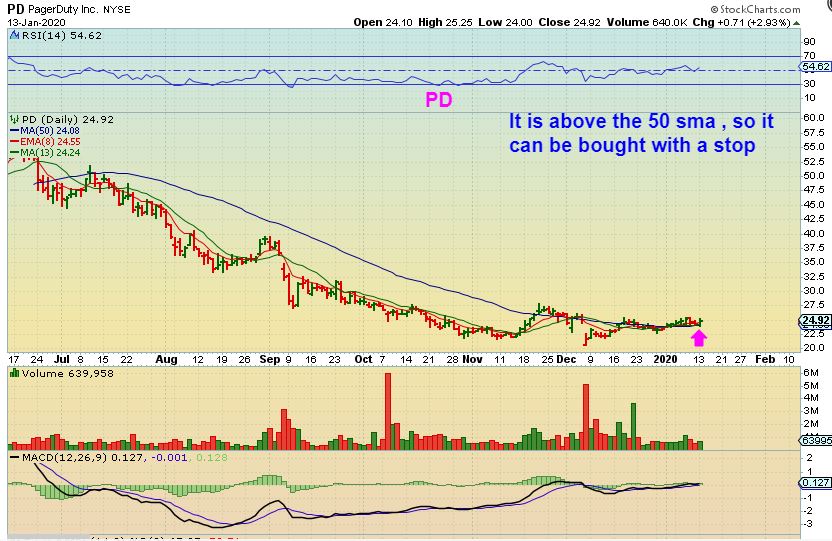
PD – This is another candidate that can be bought above the 50sma & hopefully it just starts to take off. SO PD is a buy with a stop at the 50 sma
,
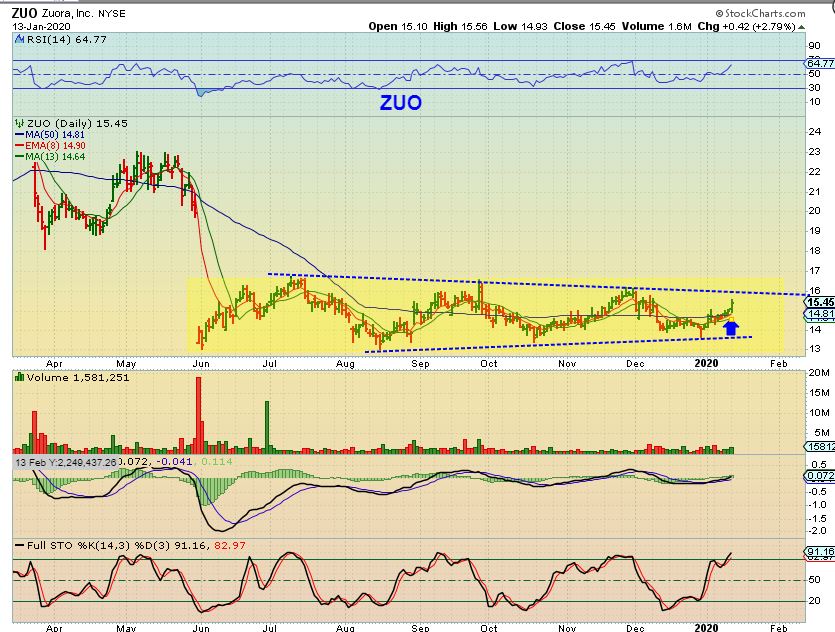
ZUO – ZUO popped above the 50 sma and is also in a multi-month base with a gap on the left side of the chart. It can be bought here , but there is no guarantee that it’ll break out.
,
IF THE NASDAQ IS GOING TO JUST RAMP UP HIGHER< MANY OF THESE MAY RECOVER BEFORE ANY LARGER DROP COMES ABOUT, but caution is warranted in case AAPL , TSLA, etc start to crash. The Markets would likely follow. At that point MINERS, ENERGY, and COMMODITIES COULD REALLY BENEFIT…
.
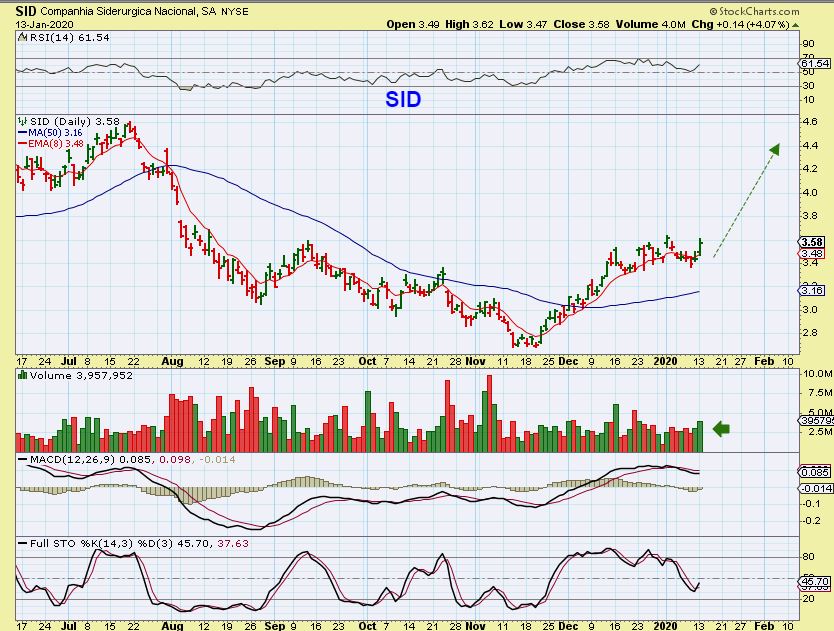
SID – A Steel stock that looks ready to break out. I see it as a buy with a stop under this consolidation. FCX is breaking out too. So Metals may be getting a head start too, on an eventual market dip / crash?
,
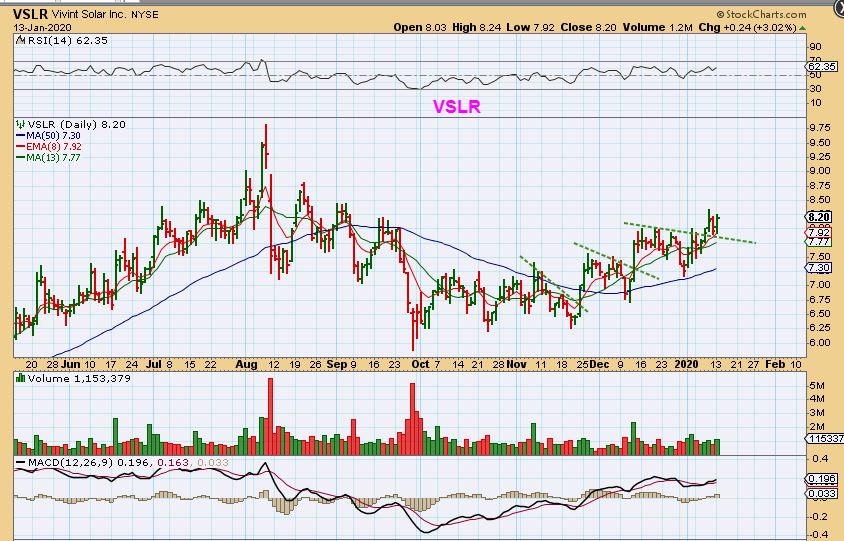
VSLR – We discussed VSLR, ENPH, CSIQ, JKS , and others as Solar stocks bullishly set up. VSLR is still trying to push higher, but it is a slow process with this one.
,
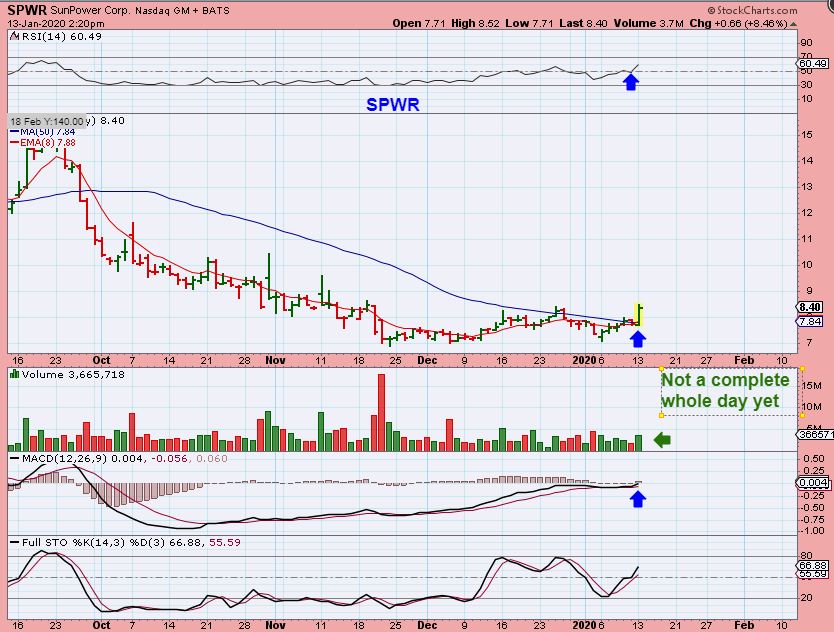
SPWR – Now SPWR has popped out of a base and above the 50 sma. This is worth watching and it could be bought here too, but it may bull flag or dip & then run. It is a good base in a good sector. Look at 3 month charts of JKS & CSIQ to see how some of these can run out of the lows.
,
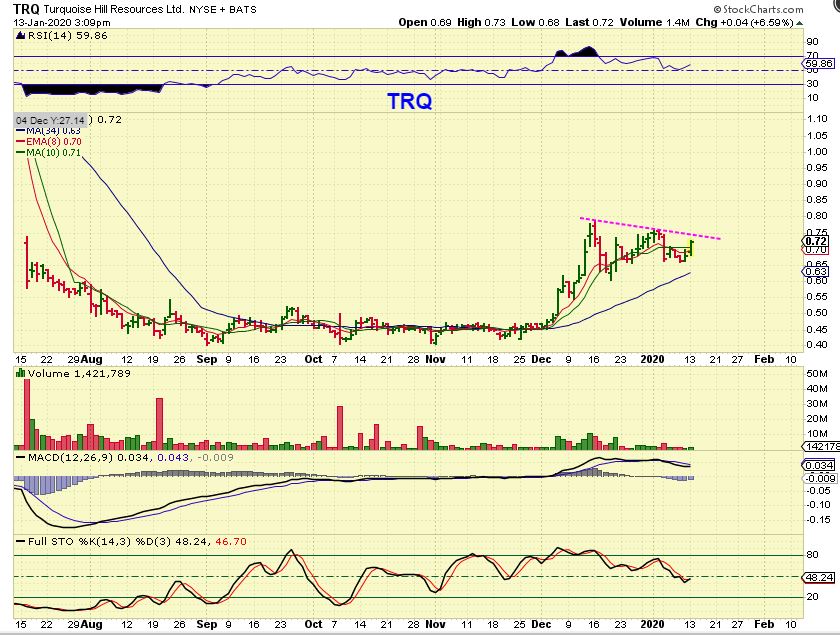
TRQ – The Precious metals Sector isn’t quite ready, but TRQ is a bullish set up. It may dip to that 50 sma one more time, or it may break out. A break out could be bought with a stop.
.
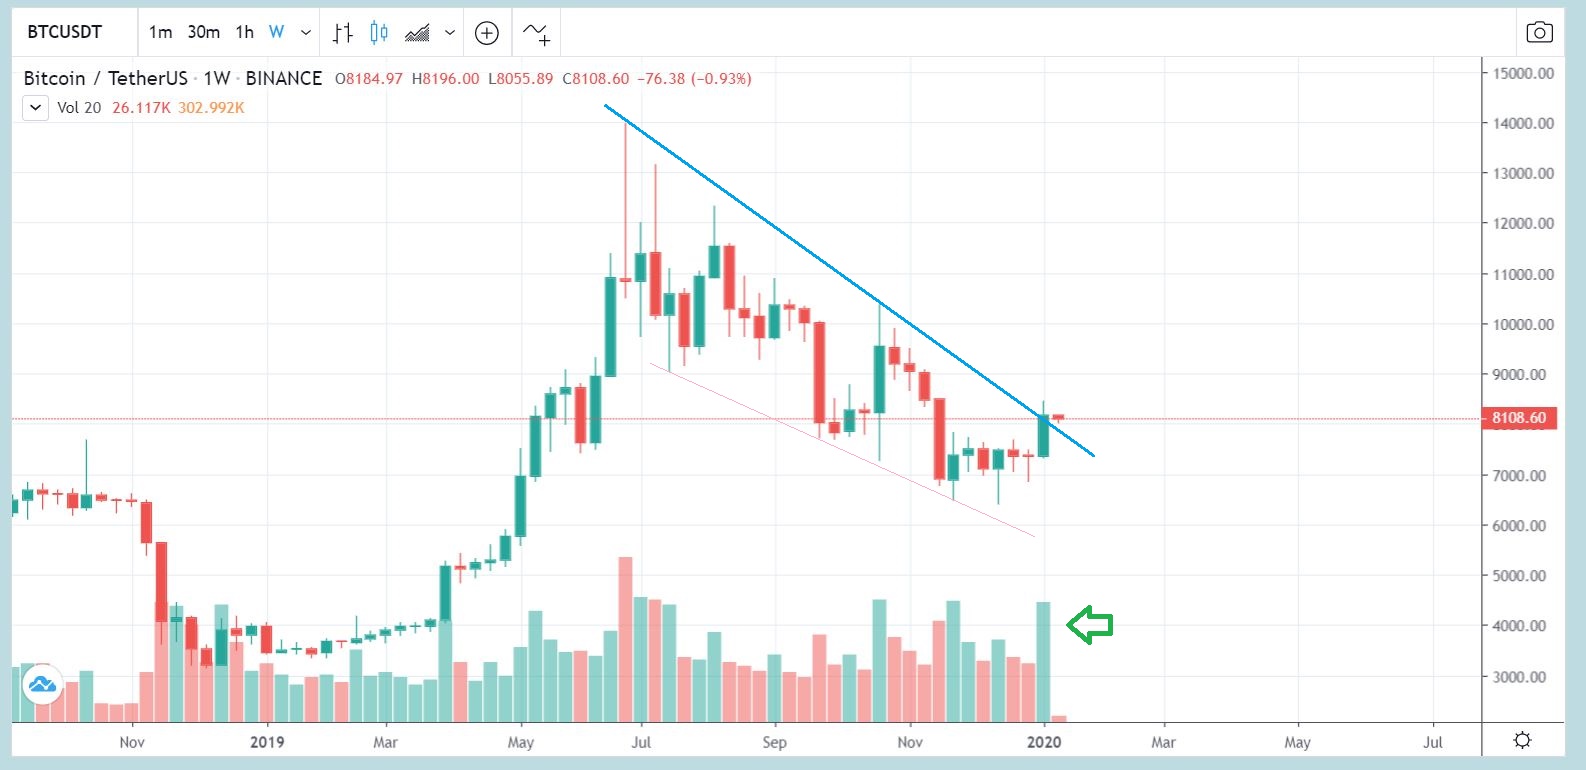
BITCOIN – I see BITCOIN as a weekly break of the down trend line, so I mentioned stocks like RIOT, OSTK and a few others that are involved with blockchain and they often do well when Bitcoin moves higher. Well…
.
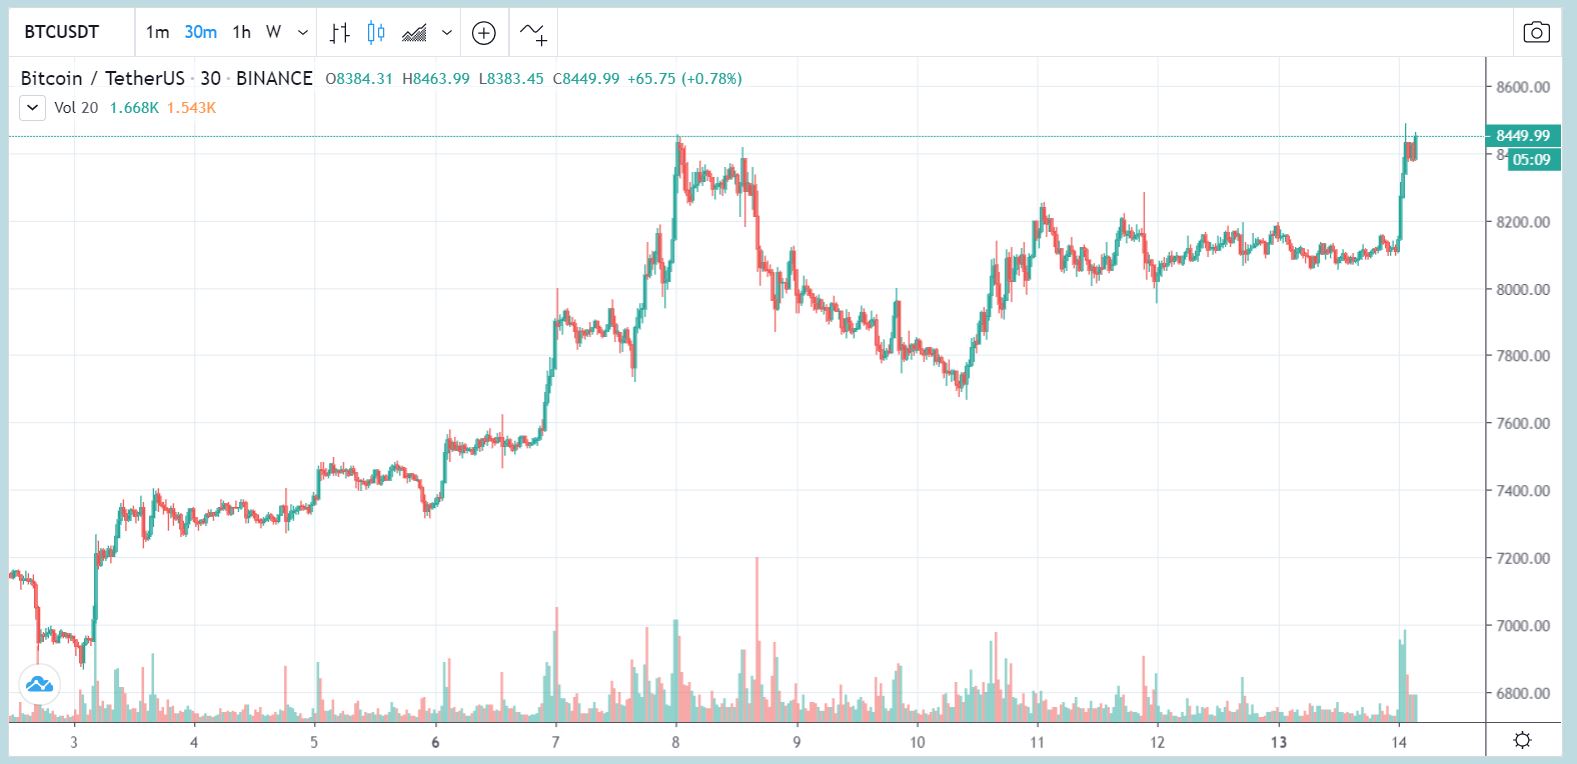
BITCOIN did a $400 Pop after hrs as I write this report, so …
.
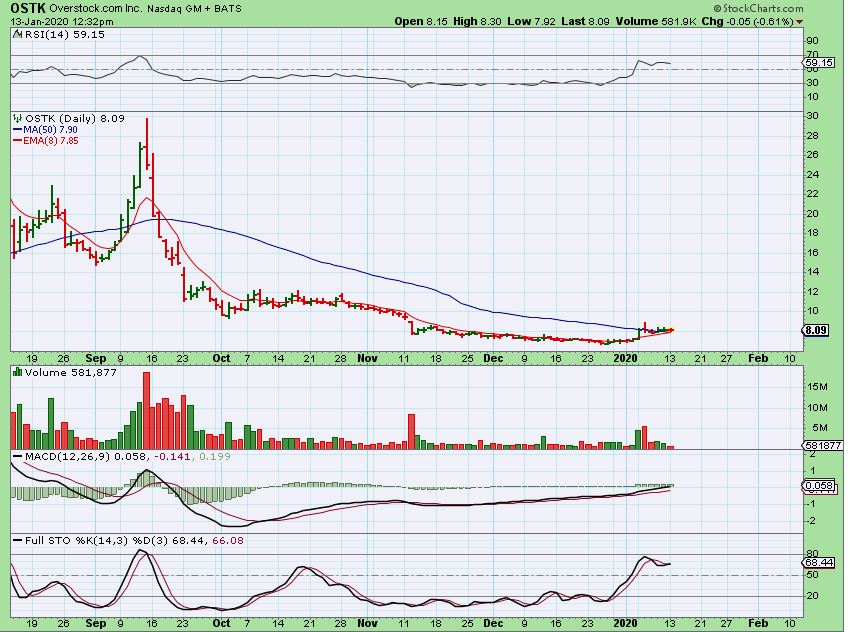
RIOT & OSTK were in the weekend report – OSTK that was building this base & bull flag type of run across the 50 sma and with the Bitcoin Pop, it may break out too.
.
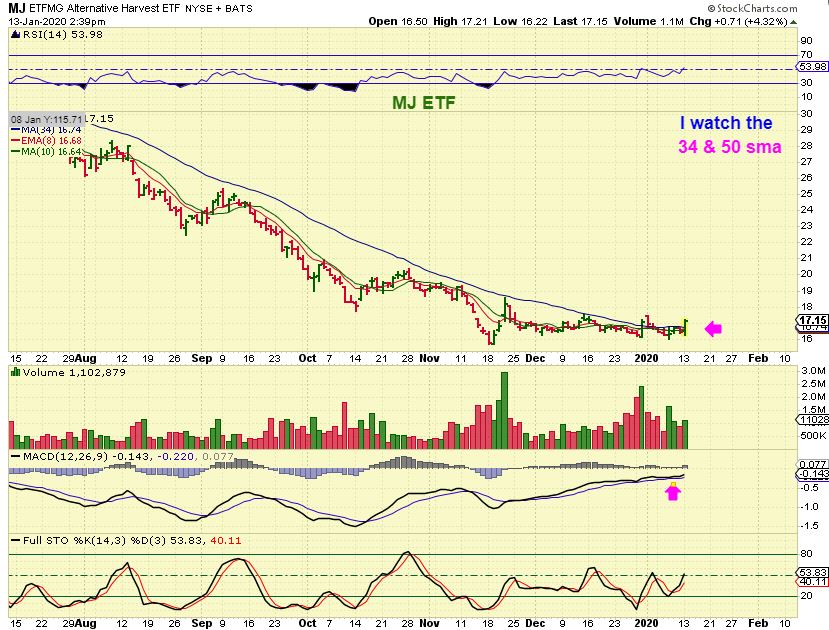
MJ ETF – I have covered this sector in December as a deeply oversold sell off that looked to be basing out. Some of the MJ Stocks have been very progressive. This is a flat base and on Monday MJ closed at $17.34 and that puts it above the 34 sma & the 50 sma too. Now lets look at a few stocks again…
.
CGC– I posted this chart of CGC on Dec 9th and it broke the 50 sma, however…
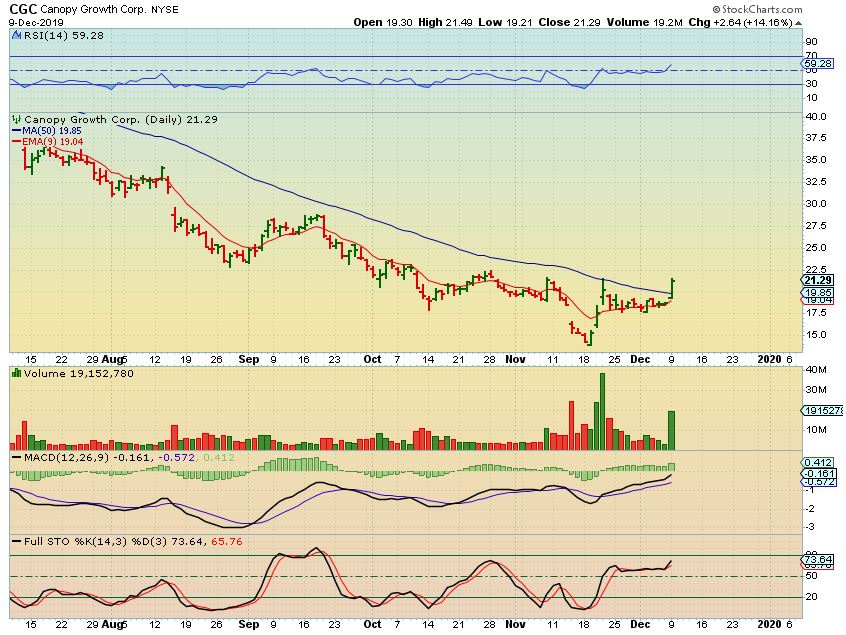
.
CGC– It didn’t run. It needed more time and built a base. I posted this on Dec 31. It looked ready to go…
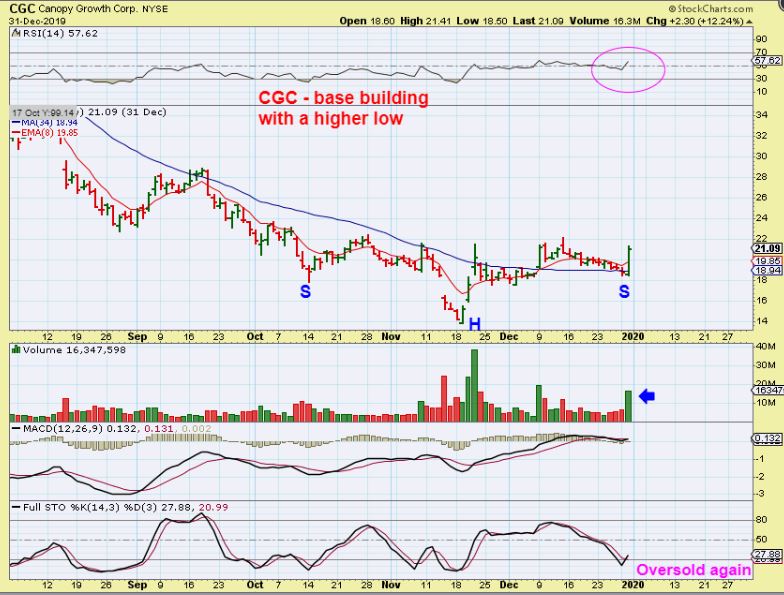
.
CGC– Well, it dipped back to the 50 sma again and now really looks ready to run. It was up 12%, it broke all of the prior highs of the base and volume is Bullish. IF THIS IS LEADING THE WAY, others should follow.
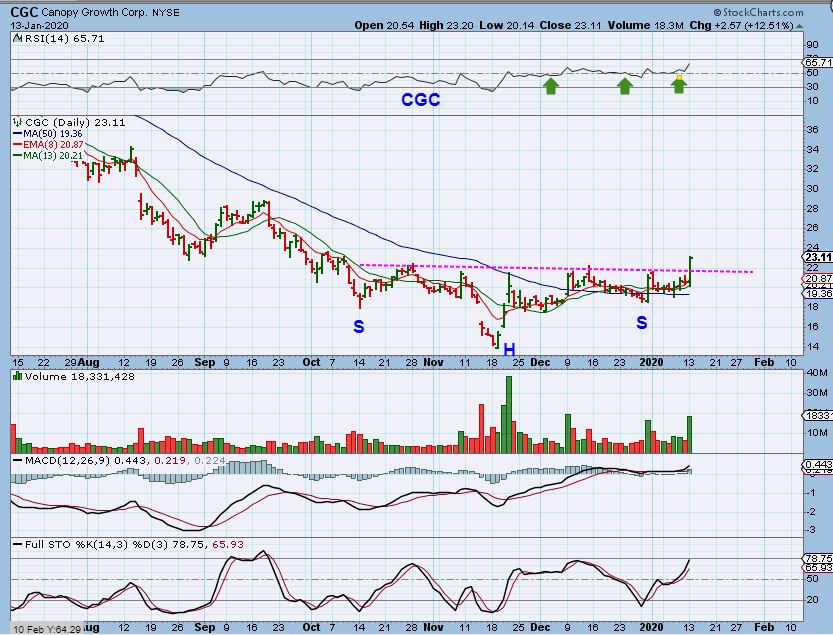
.
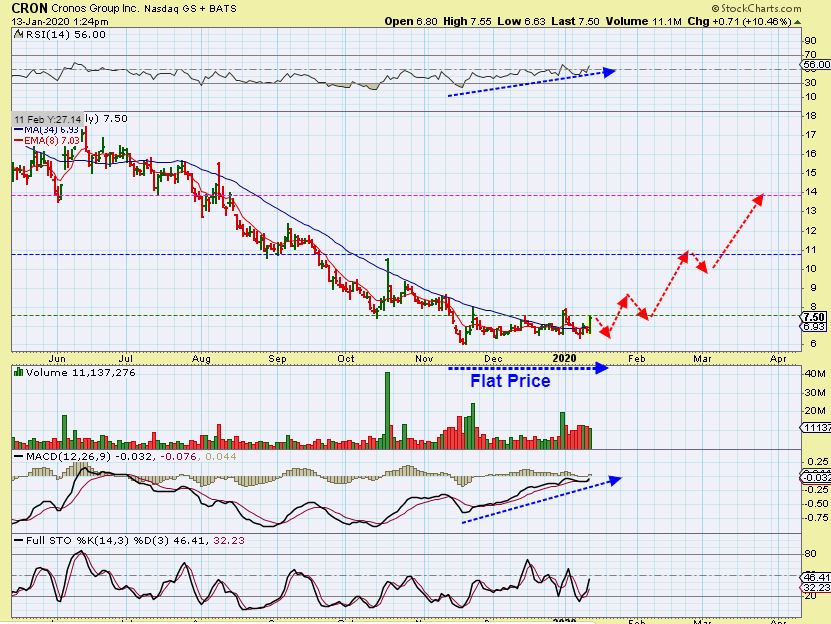
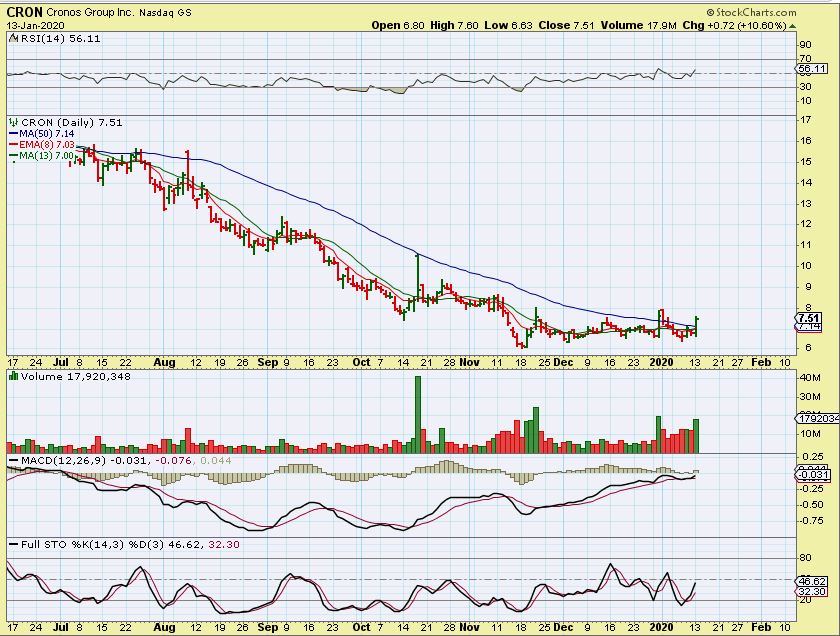
CRON – So I posted CRON at $7.18 in our live trading area and bought it as it crossed the 34 sma Monday. It also has a long flat base.
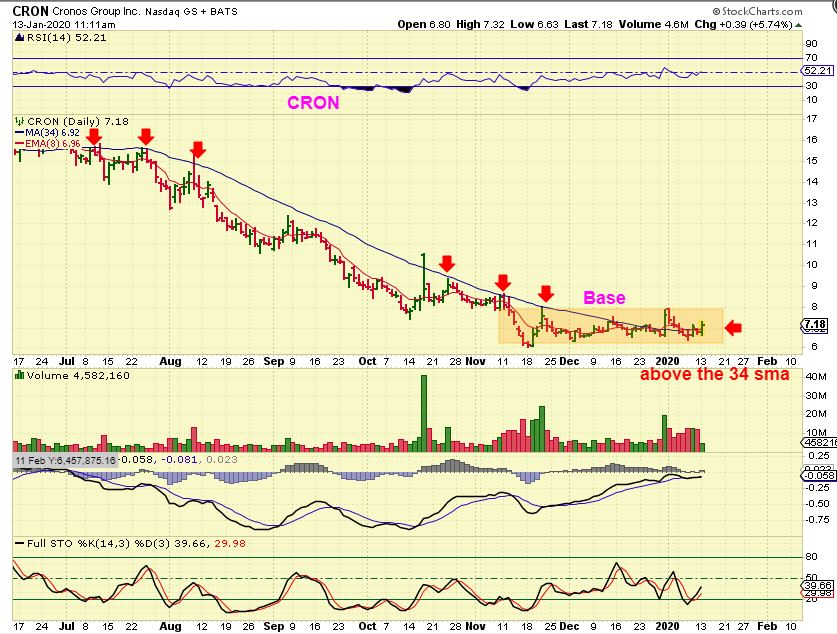
.
CRON – By Midday it was at $7.50 and near prior peaks of the base too.
.
CRON – CRON closed above the 50sma and volume was good. If CGC is going to run away now, the rest of the pack may follow. These can make quick gains, but they are also a but tricky, because they drop sharply too, so it is best to start small until you get a feel for them.
.
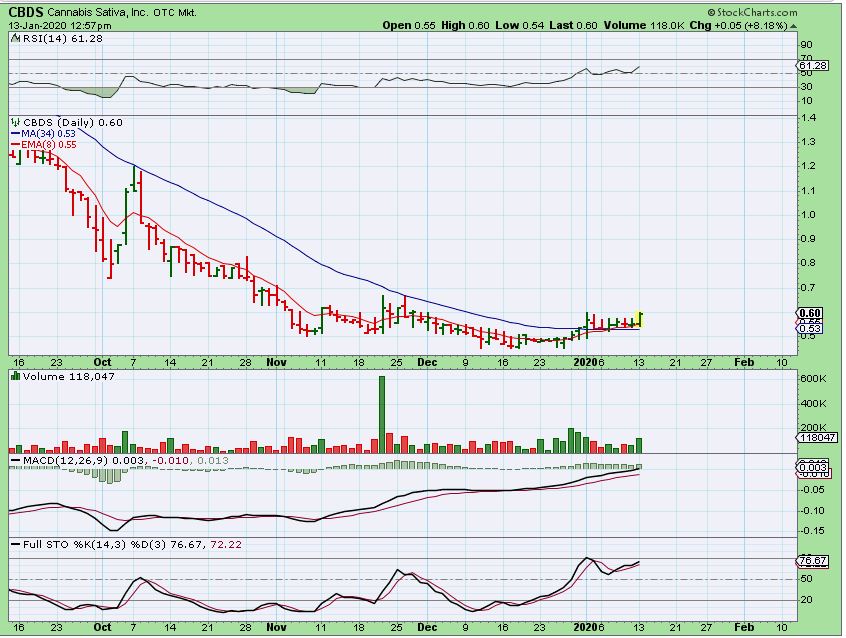
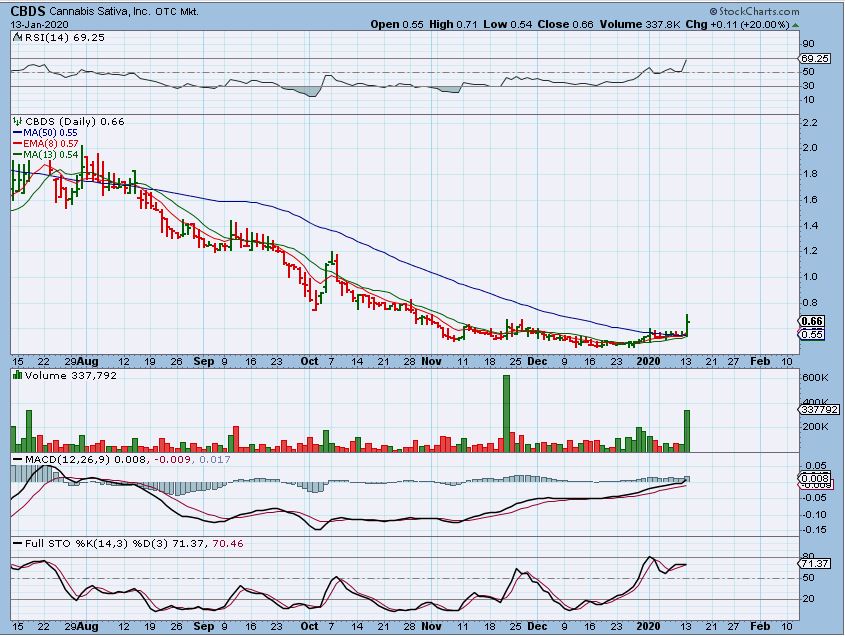
CBDS – I bought this as it moved higher too, and posted this chart.
.
CBDS – It ran to 71 cents ( up 26%) and then pulled back. I really like these long bases, so I want to try to hold this for a few days and see if we get some nice follow through. Some of these have had incredible follow through lately…
.
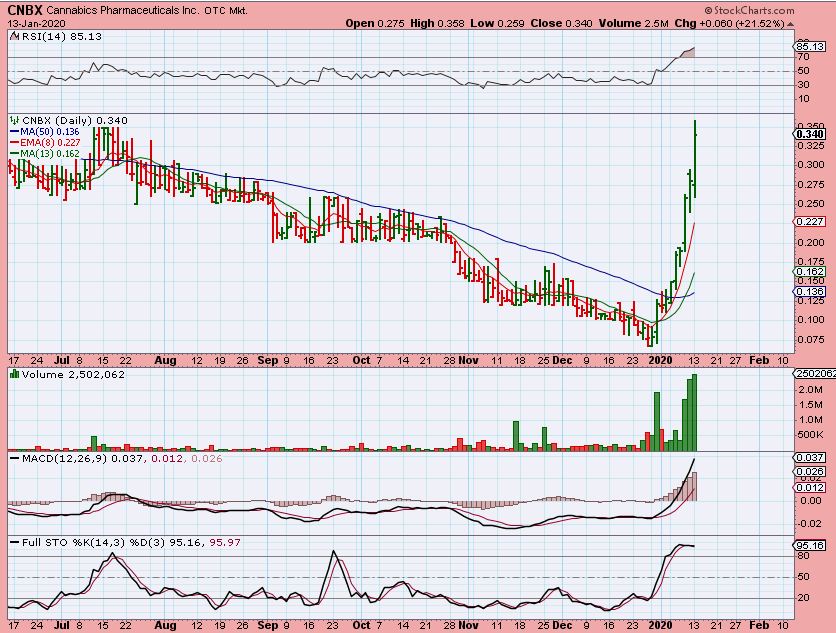
CNBX – See also OWCP, BLOZF, etc. I’m not saying that they’ll all run like this, but when these get going, they have done this in the past.
.
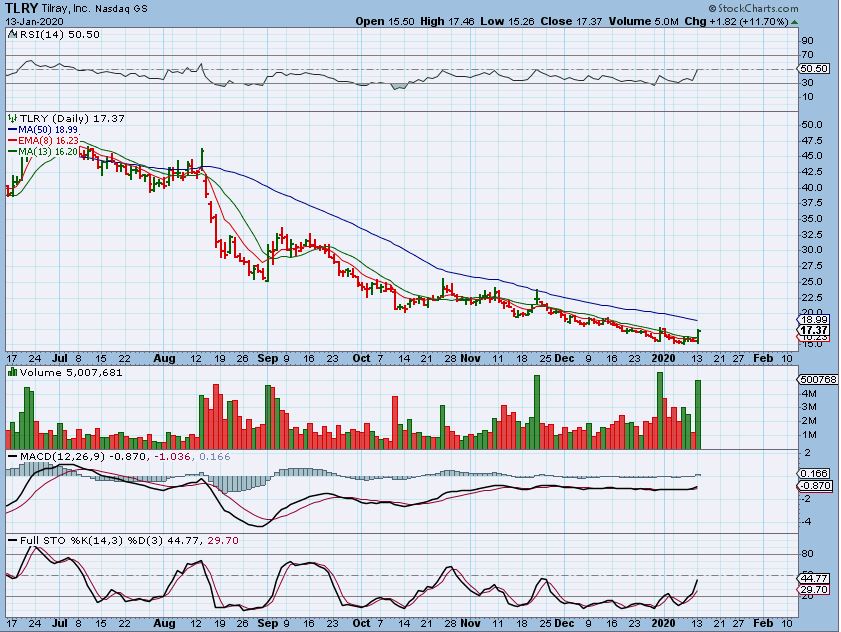
TLRY – TLRY can make up some lost ground fast. If this gets above the 50 sma, it will attract attention quickly. These could be the lows in this $16-$17 area.
.
OGI – Is it ready yet? I can’t say for sure, but this dropped from $8 to $2 over the past 8 months. When it runs, it could make some nice gains percentage-wise So far this has not had a double bottom low that didn’t break down though, so a TIGHT stop would be necessary if this reversal is bought.
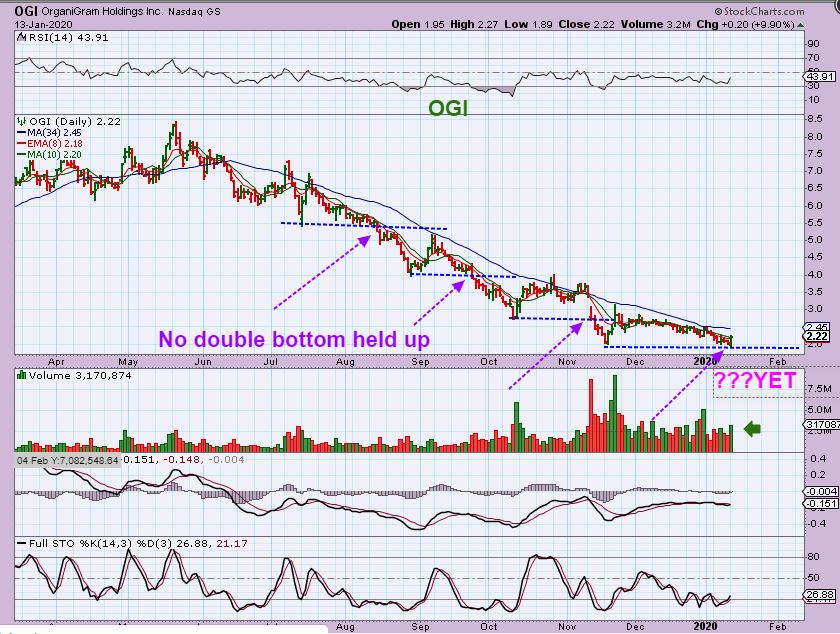
IF CGC is ready to go and the entire sector starts to run, the selling to new lows may be over for many of these. I will post more of them as they begin to shape up, but you can keep your eye on a watch list too, for progress. See HEXO, ACB, TGODF, ISOLF, TRTC, SPRWF, etc

