Thursday January 9th – What was That In The Road?
.
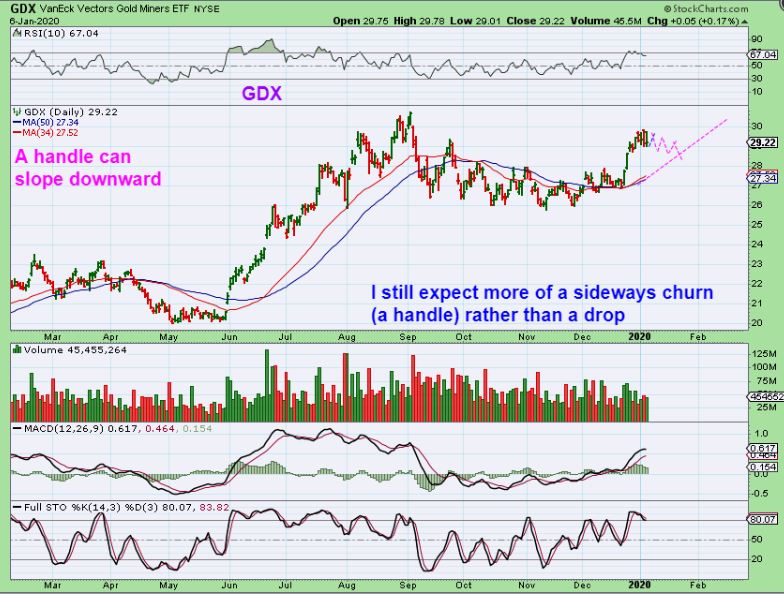
Was a Pullback in the Precious Metals Sector possible? Yes, I even posted this chart as an example of what we could see…
FROM MONDAYS S REPORT:
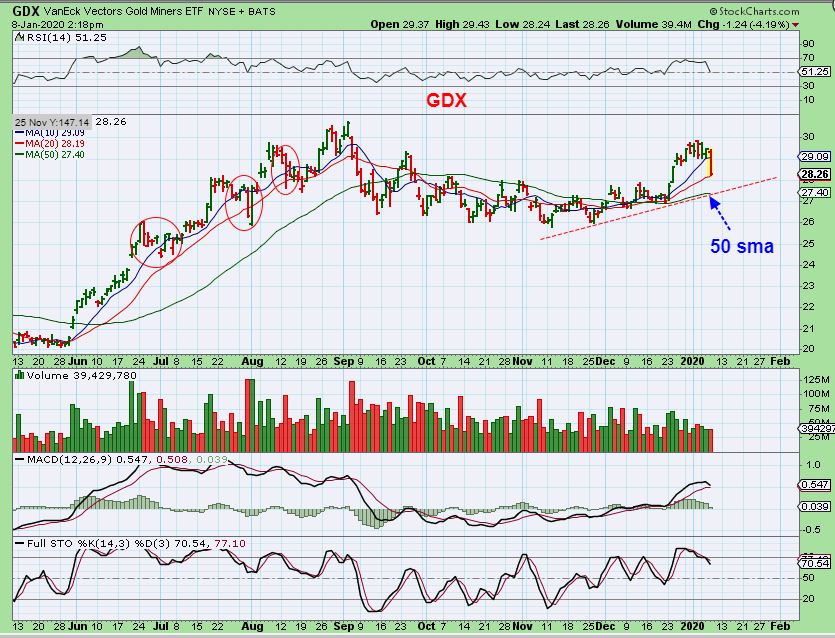
GDX – We also could build a handle to the 50 sma if the pause or dip continues. Churning sideways is normal action, you can see it in June/July and the end of July.
.
I wouldn’t exactly call Wednesdays action just a normal churning type of a pull back, so let’s discuss what we saw and also discuss what may come of it. First we’ll cover the General Markets and Oil…
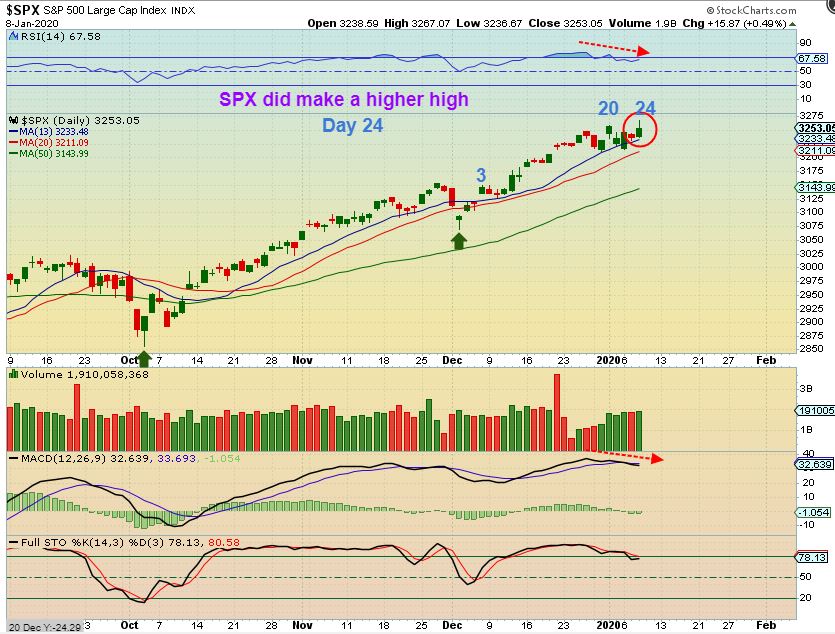
SPX – Futures dove down overnight and by the morning you would hardly know that anything had happened. We now have a higher high on day 24, so this will most likely be a R.T. Daily cycle (Right Translated). It still looks like it wants to just chop sideways before a dip to a dcl, but it avoided a crash due to geopolitical tensions.
,
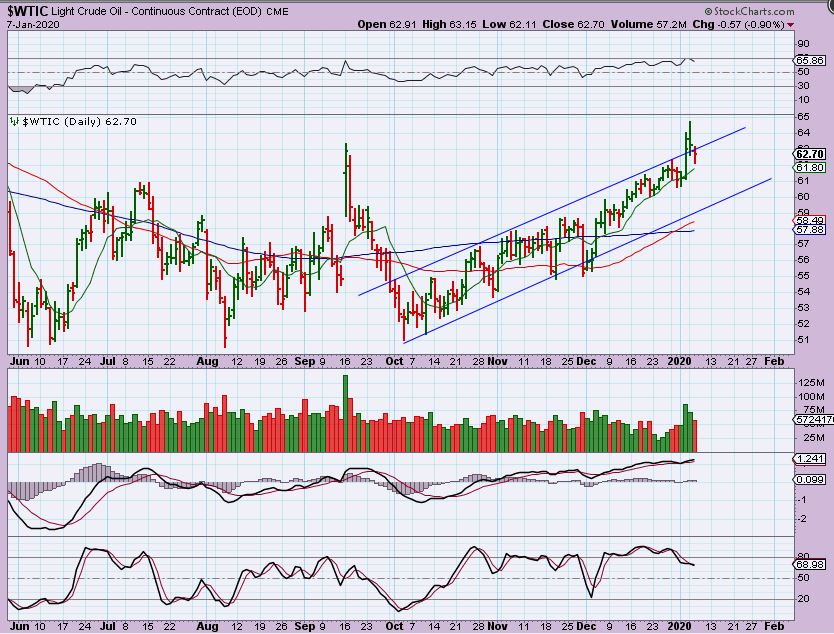
WTIC THOUGHTS FROM YESTERDAYS REPORT – Oil popped on news and then dropped back below the upper channel line. This looks like a throw over and it should eventually drop back to the lower channel line, or stay above that upper channel line . SO far, it broke back down.
.
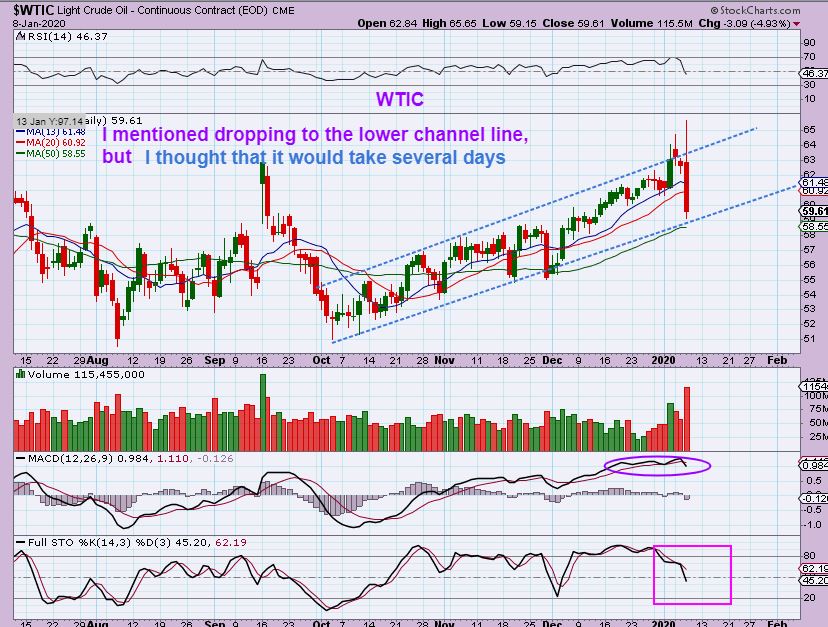
WTIC – With the Iran Missile Launch, Oil burst higher to new highs Tuesday night, but then crashed down on Wednesday. I missed the oil Inventory report, so I’m not sure if that weighed in on the selling too, but Oil now finds itself all the way back down to the lower channel line & 50 sma already. I would have expected this to happen over a week or so after watching Decembers strength. A similar crash at the end of November was capitulation, so this may be too. We’ll have to wait and see.
.
.
THIS WAS IN MY LAST REPORT:
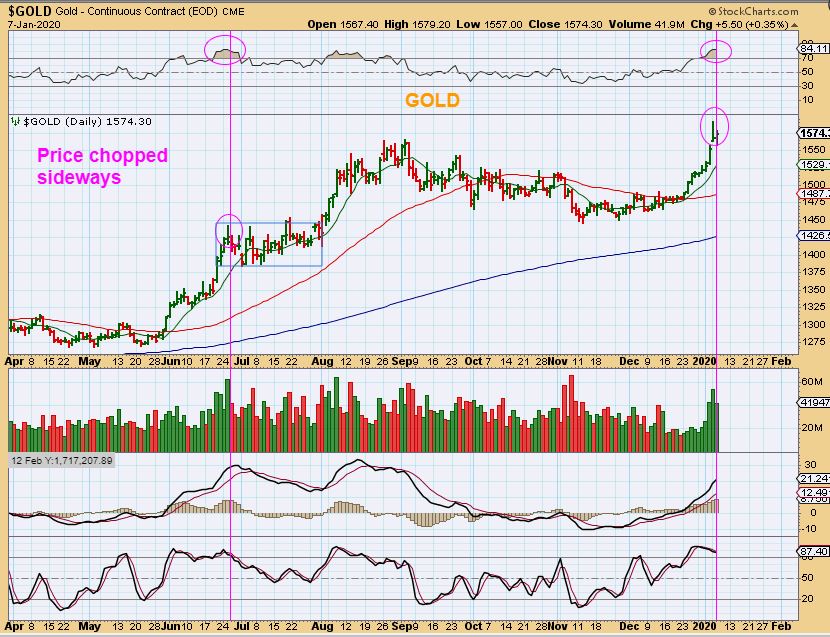
GOLD – Gold is entering an overbought area that could cause a consolidation. We should expect a possible consolidation soon, but that doesn’t really change anything. I’m not selling, shorting , or losing position, and a sideways churn won’t bother me. Look at July 2019. We stayed invested and some Miners continued higher, others stalled.
,
GOLD – Gold burst higher again breaching the $1600 mark with the Iran Missile launch. It then got exhausted and sold off all day. With 2 or 3 ‘topping’ candles, it would seem that we will definitely get a little more downside with Gold or we could also see that sideways choppy consolidation that I pointed out in that chart above. 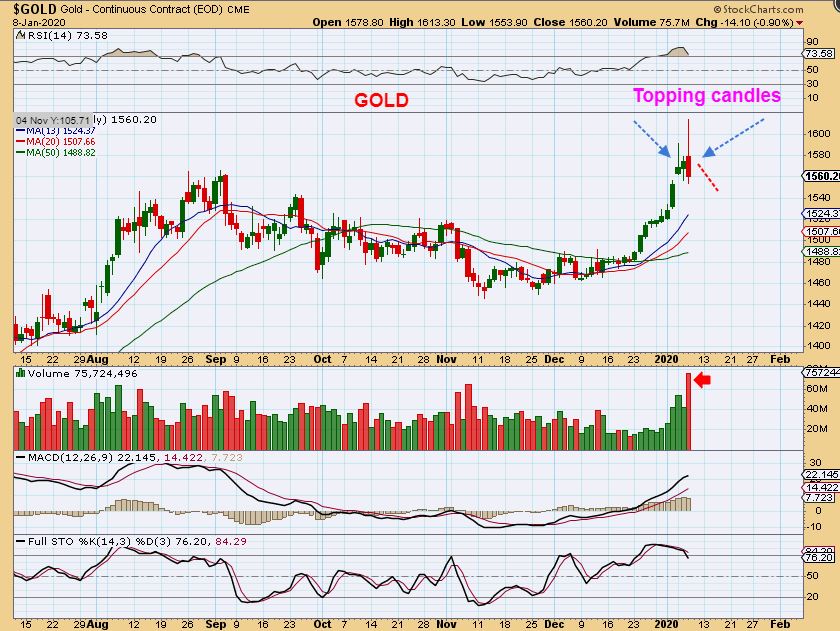
.
As you can see, Miners actually started chopping sideways over a week ago, so they may actually stabilize and begin to start their move higher a little before before Gold does. Right now we have to see where this wants to go. Lets go to the Miners.
..
GDX #1 – I expected possibly a slow drift lower, but we crashed. I have circled the areas of consolidation in the May – Sept run. GDX was down 4% Wednesday midday and landed on the 20sma. It did do that in prior runs too, so lets continue with GDX…
.
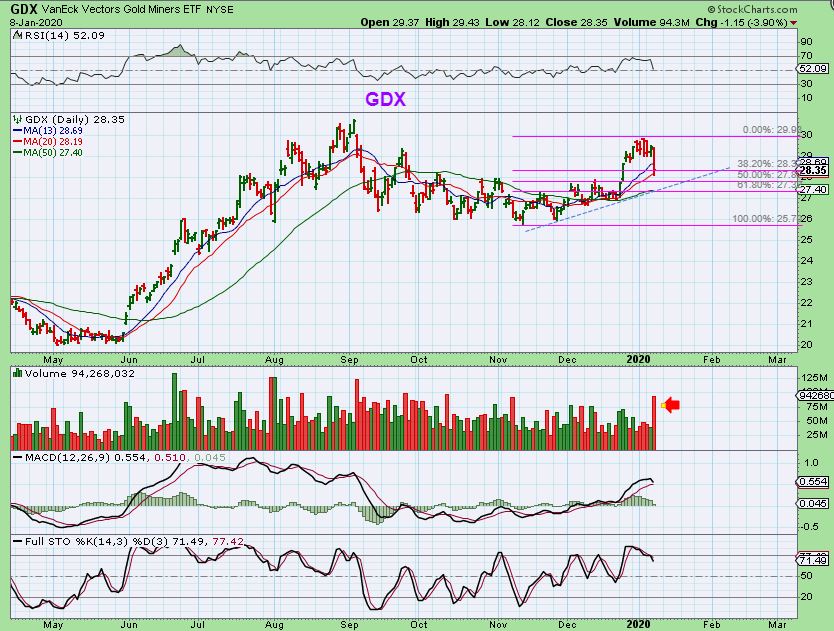
GDX #2– Here we see a 38% drop, and a 50% drop or 61.8% is normal too. Notice that a drop to the 50sma is also a drop to that blue trend line. It is also a drop to the 61.8% Fib Level, so it is not out of the question that GDX will drop there if Gold keeps selling down. Next I want to look back at the run from May to September.
,
GDX #3 – These were 2 large high volume drops on that last run. They also just dropped from a sideways choppy period. Let me zoom in on the one at July 31, since it is similar to Wednesdays drop…
,
,
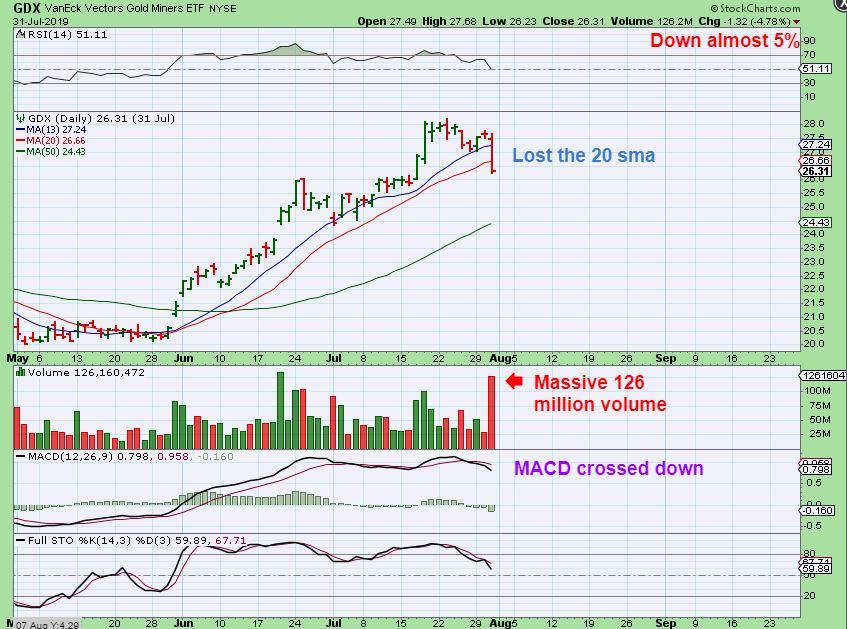
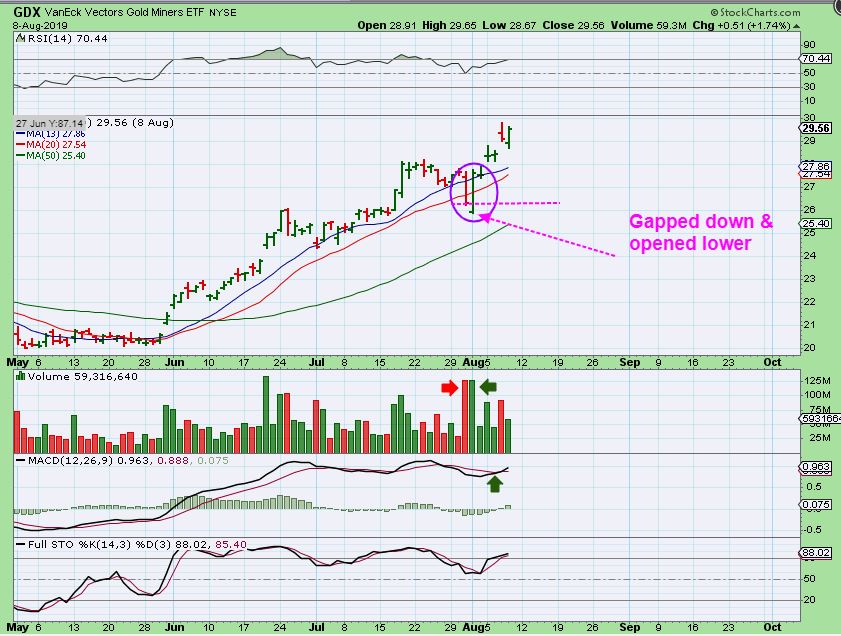
GDX #4 JULY 31 – Look at this drop. It was almost a 5% drop & closed below the 20sma. It also had massive volume of 126 million, so this is actually worse that Wednesdays drop of 3.9% on 94 Million in volume. What happened next? See the next chart.
,
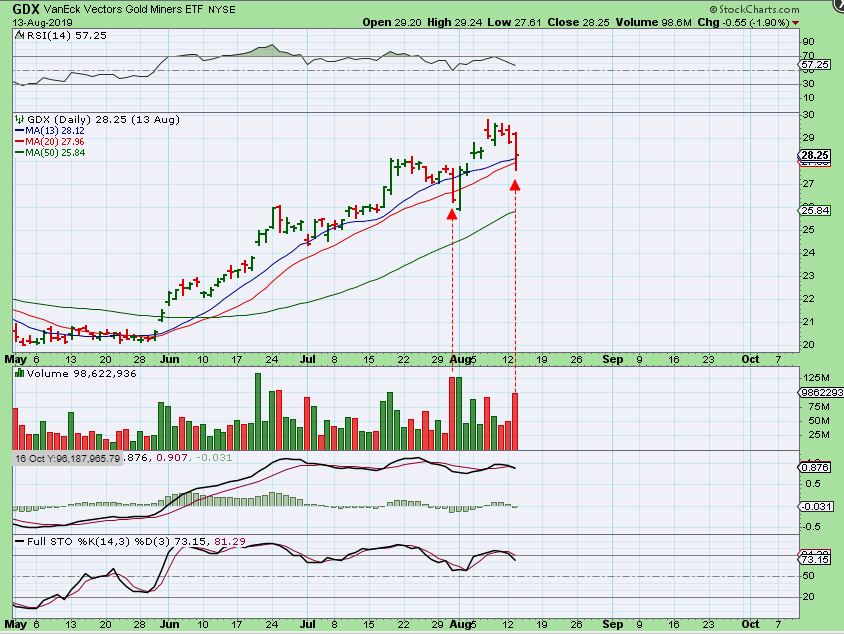
GDX #5 – GDX gapped down and then bullishly engulfed that whole down day, resuming the uptrend. I can’t say that we will see that exact same thing with Wednesdays drop, but it at least shows us that these shake outs can quickly recover in Bull Runs.
,
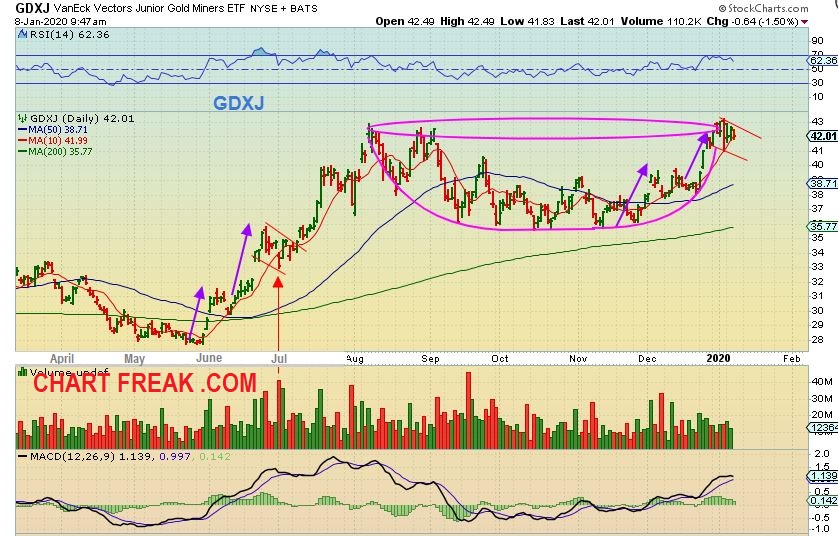
GDXJ – I had drawn this cup in the morning and by the close price dropped to the lower line closing near $41. We could still just form a handle here if Buyers step in & buy the dip sooner than later. It can be more choppy sideways action.
.
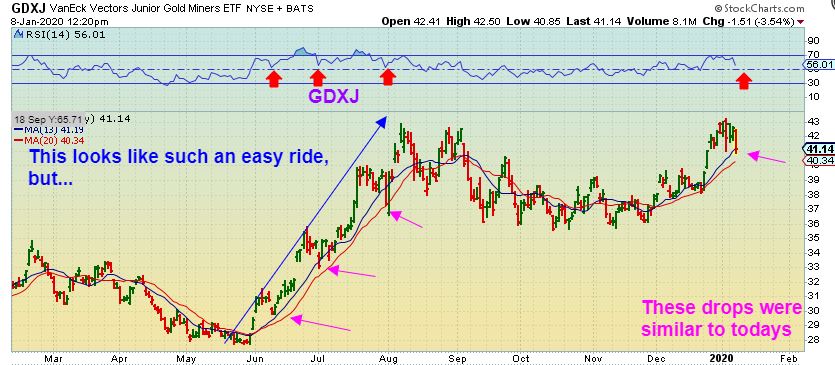
GDXJ – And again with GDXJ, we have seen dips like Wednesdays drop and still watched it run higher so we are looking for that sooner than later. GDXJ closed just above that 20 sma ( red line). It doesn’t look like much, but if you own Leverage ( like JNUG or NUGT) – that drop hurts. GDXJ closed down 4.2% and that was 12.5% in JNUG.
.
You do NOT want to ride 2 or 3 days down like Wednesday in JNUG or NUGT, if for some unforeseen reason this were to fall apart. The set up remains Bullish, but when we get a swift drop like that, we need to be pay attention and have some kind of a plan. For some it could be the blue trend line. Others may lighten up & just jump right back in on a reversal if it stabilizes. Others may have grabbed a little JDST as a hedge, and will dump it when things start moving higher again. Lets look at it this way…
.
Imagine that you grabbed JDST or lightened up to smaller position size on this drop, picturing that it could drop to the 50sma. What happens next?…
It reversed higher again & you would simply re-adjusted as the next day reversed higher. That is a pain in the neck to have to trade that way, especially for those working all day. It would be difficult, but it is at least 1 way to lighten the leverage & protect oneself from further damage until the picture clears up. This drop just turned out to be a 1 day wonder- and hopefully we have that today too, but you can’t tell until later.
It was not a fun day for the Precious Metals or Energy with Irans surprise missile attack. It feels like we got 3 days worth of a move all in one night.
Gold shot up $26 or more on Tuesday night and it looked like Miners were just going to take off higher & run Wednesday. Instead, we saw the selling start and it didn’t let up. It doesn’t look pretty, but it has happened before and only turned out to be a short lived slam down that recovered. If this action is too hard to take, and I am especially talking about leverage, you do have choices like cut the size or add some JDST as a hedge, just until things settle down. That will mute some of the gains if & when a reversal & recovery starts, but it lets one sleep at night now. Sometimes peace of mind is worth a little hedge for some. We’ll see what Thursdays trading brings. Many of the trades in the General Markets are still playing out too. I’ll discuss 1 or 2 below.
.
~ALEX
.
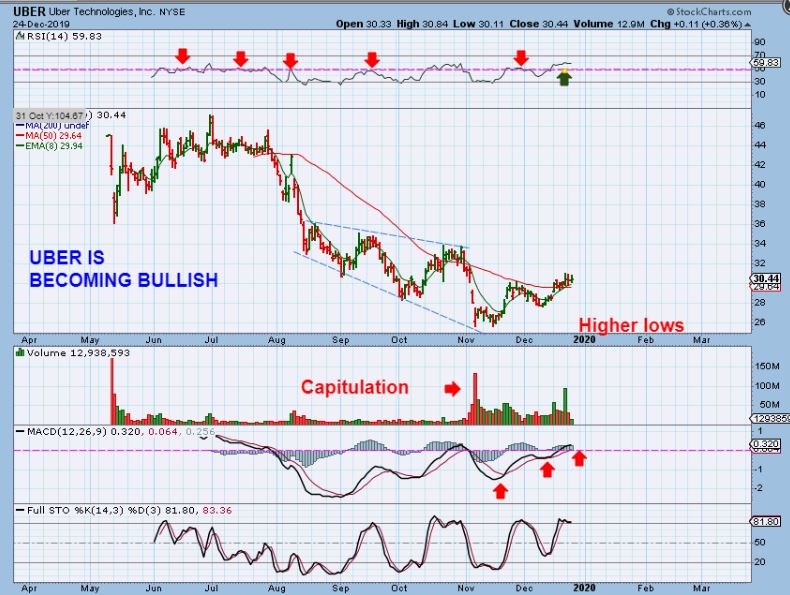
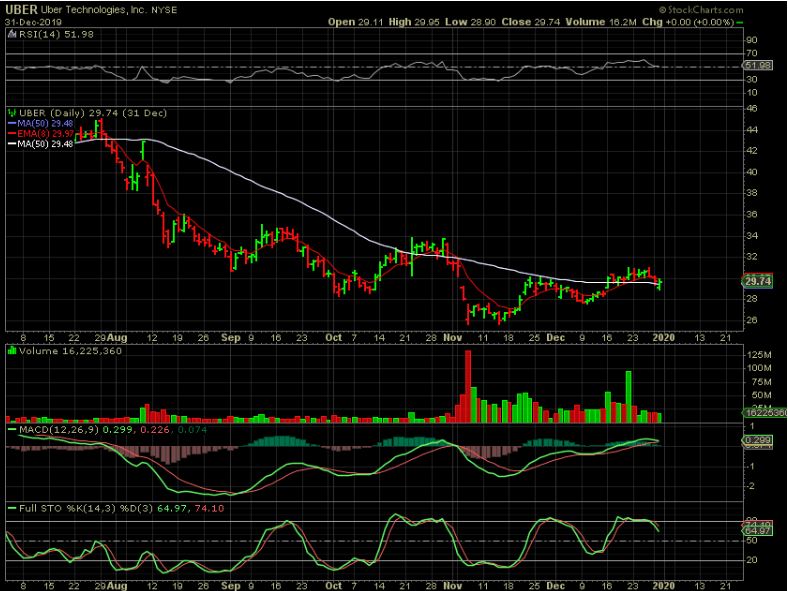
UBER – Recently I pointed out UBER as recovering. I used these 2 charts .
.
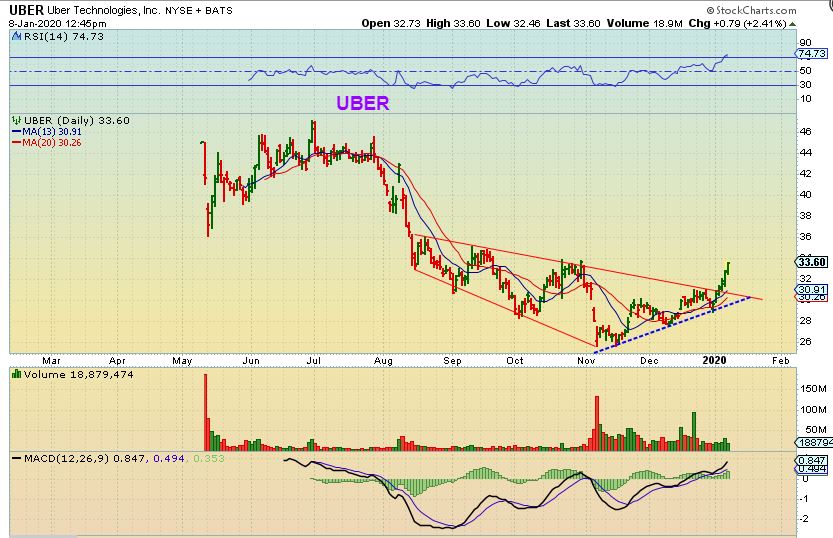
UBER – Here I pointed out that it was recovering the 50sma with a reversal. What came next…
UBER – It has been gaining a little more upside daily, this was midday Wednesday.
.
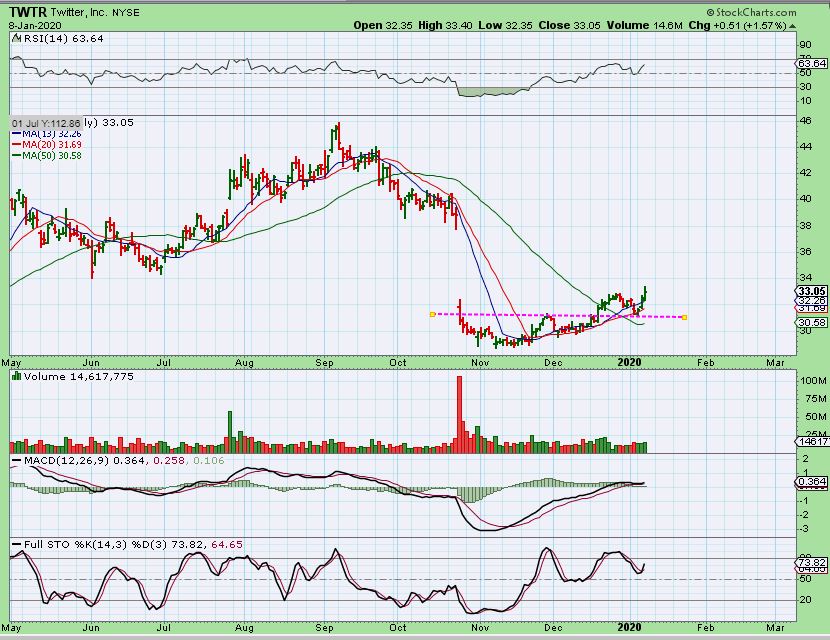
TWTR DEC 18 – TWTR was approaching that 50sma and formed a base.
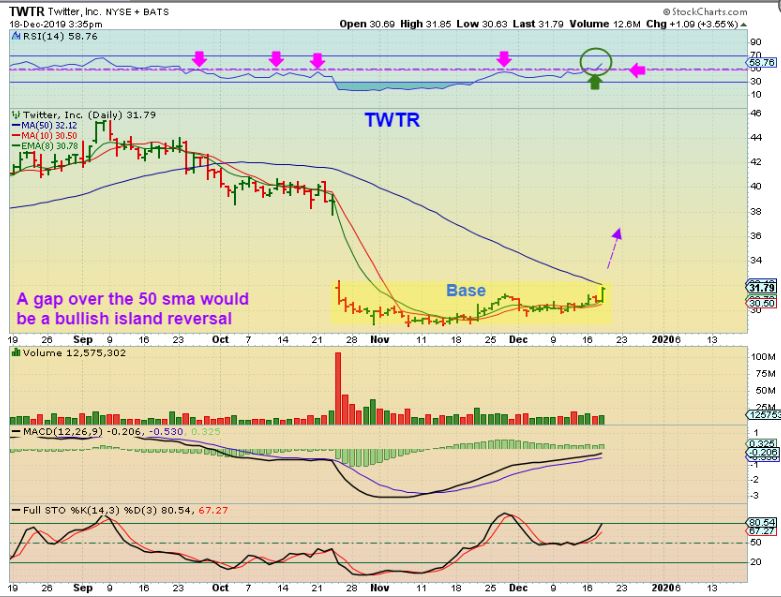
TWTR DEC 18 – After breaking out and back testing the 20sma, TWTR is rising too. A Gap fill is still $33 to $38.
.
I still like the set ups of ZM, PD, VSLR, UBER, TWTR, LASR, DBX, SNAP, CRWD, WORK, PD, WTRH, etc etc , but I have been heavily invested in Miners for weeks, so I only took a few of those trades. The charts still look good. I sold my position in WORK, I own TWTR & WTRH.
.
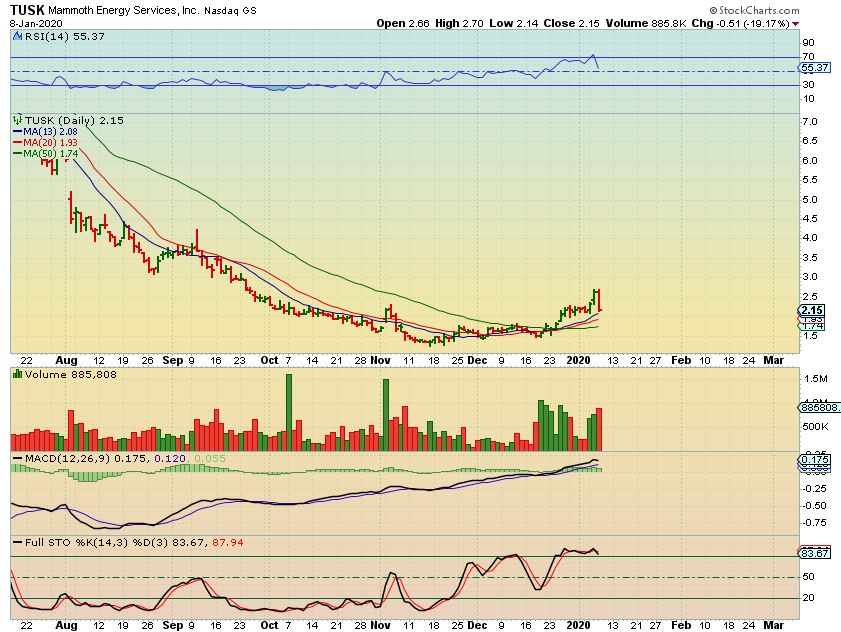
TUSK – This drop was too much for me, and I got stopped out . Oil dropped sharply Wednesday and many Oil / Energy stocks dropped too. I’ll be keeping an eye on the sector to see if WLL, BE, PUMP, TUSK, OAS, LPI, etc remain bullish after a pull back or will they break down.