January 25th Weekend Report
I have discussed the basic market set up with Cycles and timing and expectations so much in recent daily reports, that I want to Just cover the Big Picture in this weekend report and try to keep it brief & to the point. Let’s get right to the charts…
.
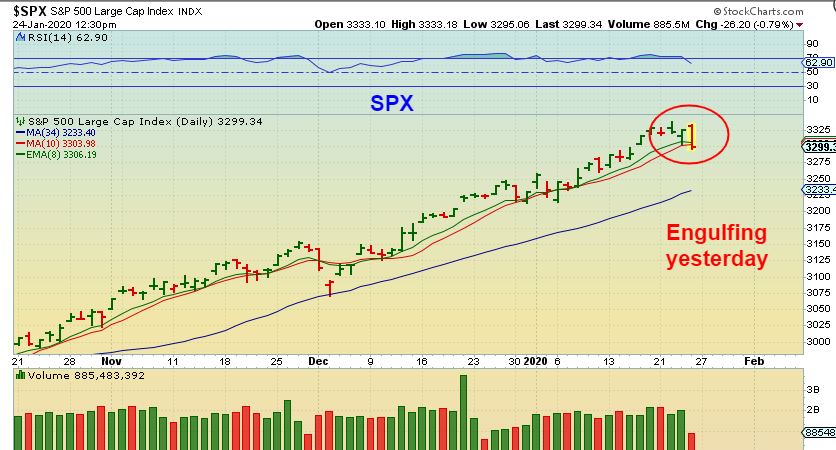
I posted this chart midday Friday as the markets sold off, and that would be a bearish engulfing candle. We are due for a dip into a dcl, you can see that the last one only lasted 3 days, and the markets did close with that bearish engulfing candle. I would expect more selling, maybe to the 34 or 50 sma…
.
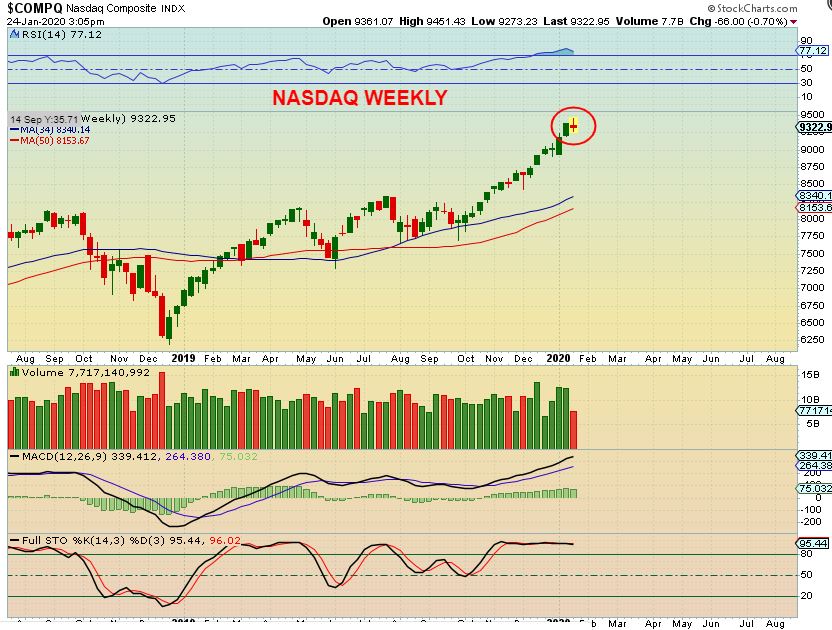
NASDAQ WEEKLY – So we are due cycle wise for a dip into a dcl and we have a doji candle that could be a top. The last daily cycle dip lasted just a couple of days, so soon we would be looking for a swing low to form as a dcl. Then we either top on the next daily cycle, or we continue to melt up, but either way I do expect higher highs before this ends.
,’
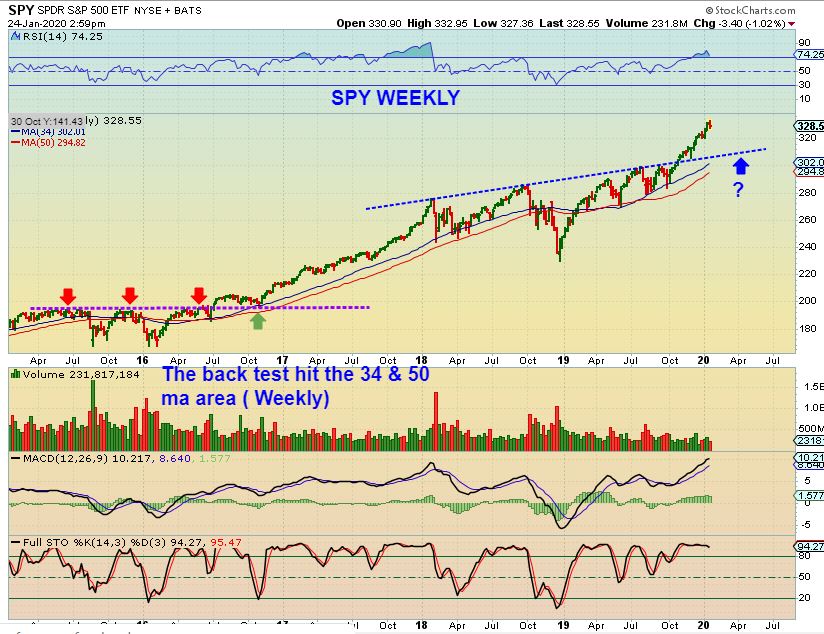
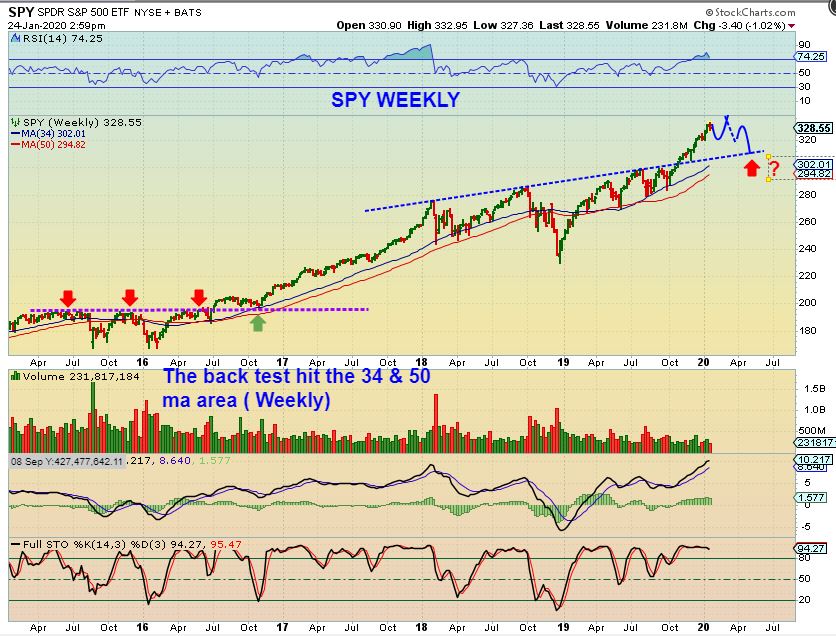
SPX WEEKLY – The last big consolidation in 2016-2017 broke out and back tested about 6 months later, but it was more of a sideways move, & then it ran higher. Will this back test at the next ICL, or will it just melt up into a parabolic blow off top? We have to wait and see.
,
SPX WEEKLY – Just to give you an idea of what we could see if we DO NOT melt up right away.
1. We’d dip to a dcl now, then we’d
2. Rally to a new high
3. Roll over as left translated ( H&S?) and
4. The eventual ‘back test’ would be the next ICL at the red arrow.
,
Gold could rally higher as the Markets drop to an ICL.
,
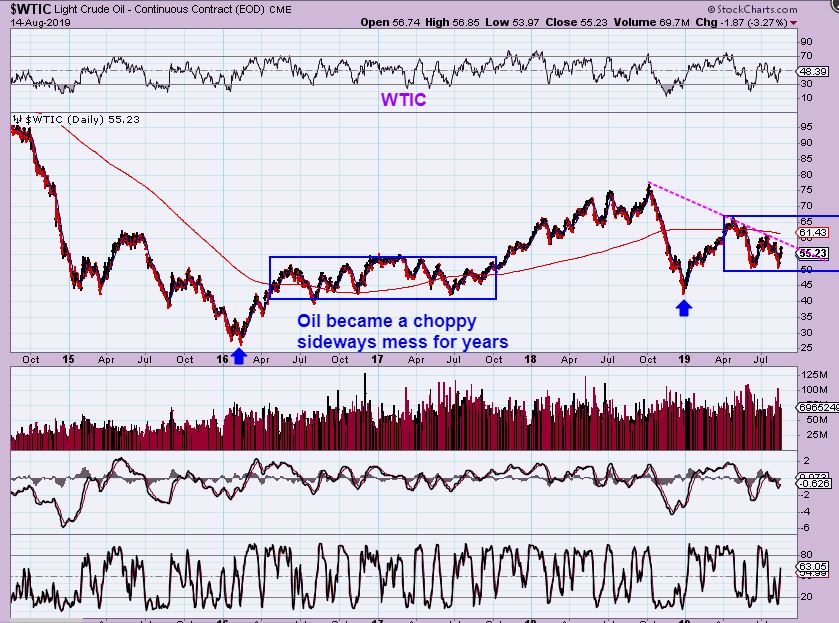
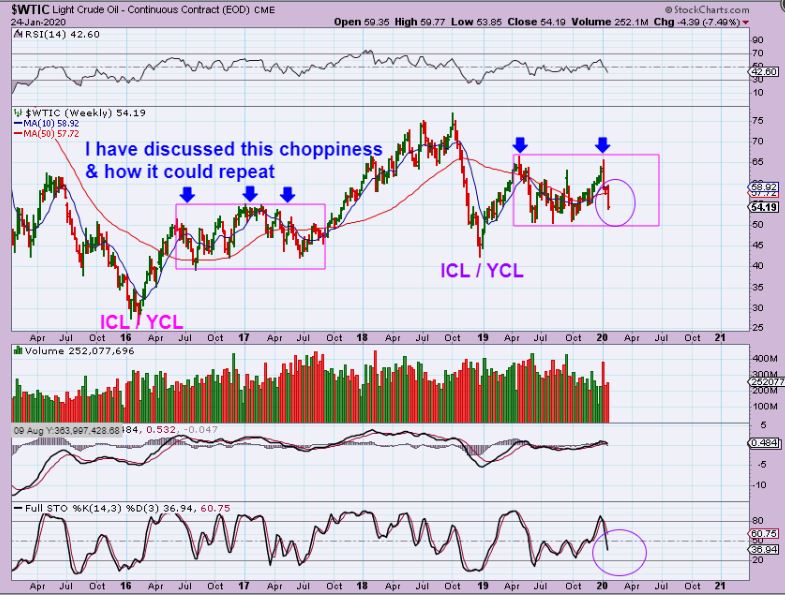
WTIC WEEKLY – Long ago ( This chart was created on AUGUST 14 2019!) I pointed out how OIL might rally, drop, rally, & just Chop in the same choppy manner that we saw coming out of the ICL in 2016. That could be short term trade-able, but really kind of frustrating.
.
So far, that is exactly how this is playing out. Oil is choppy and sideways in the big picture.
,
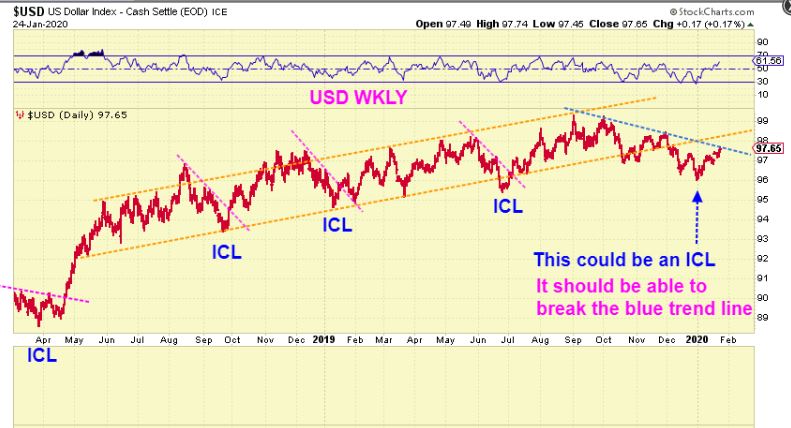
USD DAILY – I felt that the USD was breaking down and it was due for an ICL. I think that it just put one in place, but I want to add that the USD temporary strength has not hindered Gold. How far this can recover remains to be seen. It may just back test the orange line.
.
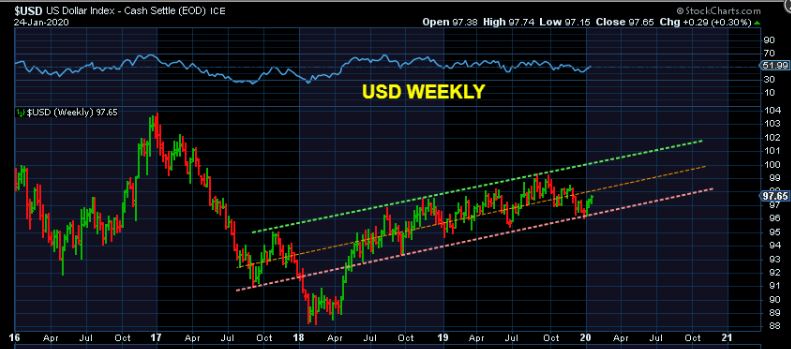
USD WEEKLY – If I draw it going back 4 years like this, it looks to be chopping higher. I will point out that the USD has been rising for almost all of January, and Gold is still near the highs, so USD strength does not bother me at this point.
.
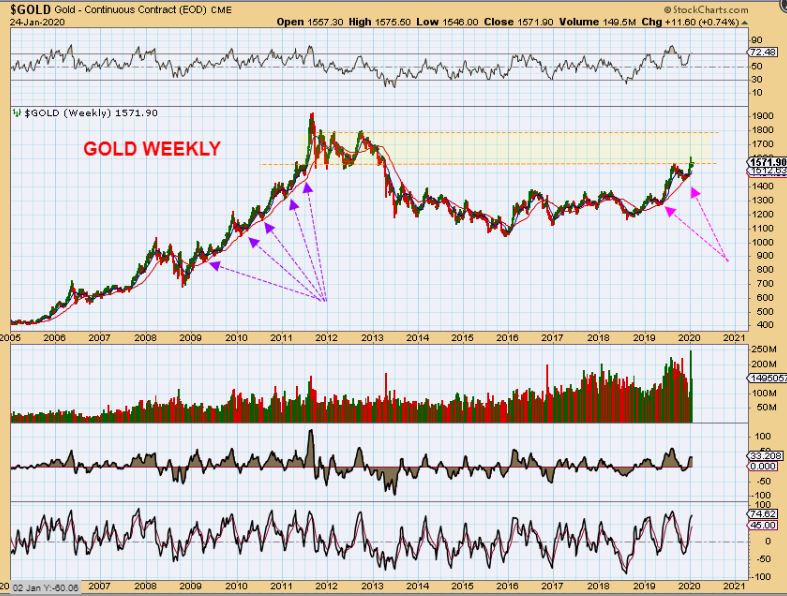
GOLD – Gold is near the highs, but it is that major resistance area again. Resistance isn’t the end of the run, it just takes time to chew through it, so we’ll see if Gold has what it takes to work its way through it sooner than later. It is a FED WEEK and we are early in the 2nd daily cycle, so that leans Bullishly for Gold possibly pushing higher.
.
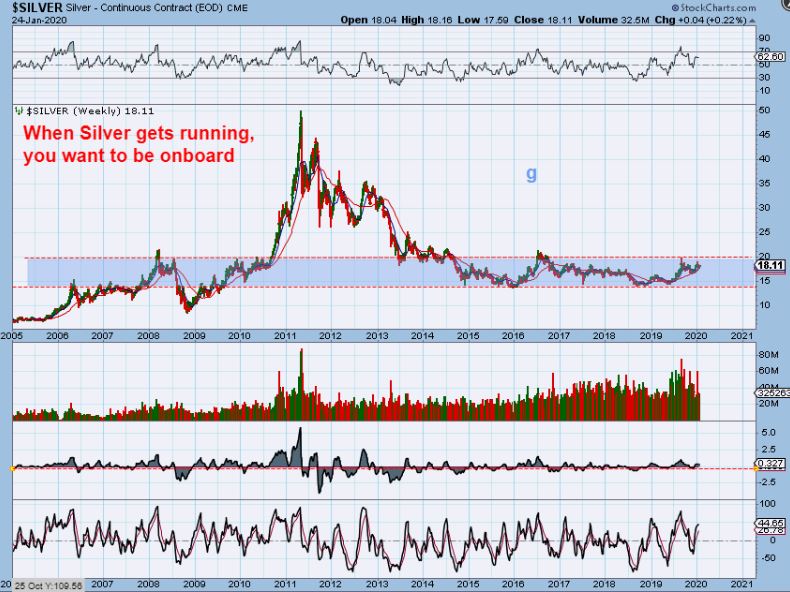
SILVER – Silver will eventually break from this large base that formed after the 2011 blow off top. When it breaks higher, you want to be focused on this sector, and so far many Silver stocks are already being accumulated ahead of time. For example…
,
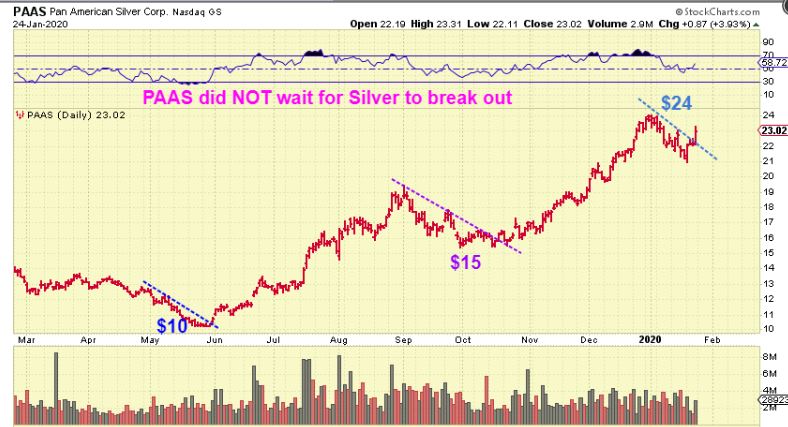
PAAS, SVM, SSRM, etc are silver companies already shaping up into very beautiful charts with Silver still in that base. PAAS is a buy again too.
.
GDX – There was a small case of panic Thursday when GDX sold down and Gold didn’t, and I didn’t quite understand that anxiety. There was no damage to the charts, but some wrote emails telling me that they panicked & sold out, others also posted in the comments concerned that Gold held the days highs & GDX didn’t. So after trying to write a small Friday report of reassurance, at least explaining the parameters that would tell me that something bad may be happening, we then saw GDX move to new highs of this daily cycle again on Friday day 7. Since we had that somewhat emotional ‘reaction’ on Thursday when GDX dipped, I want to say something ahead of time…
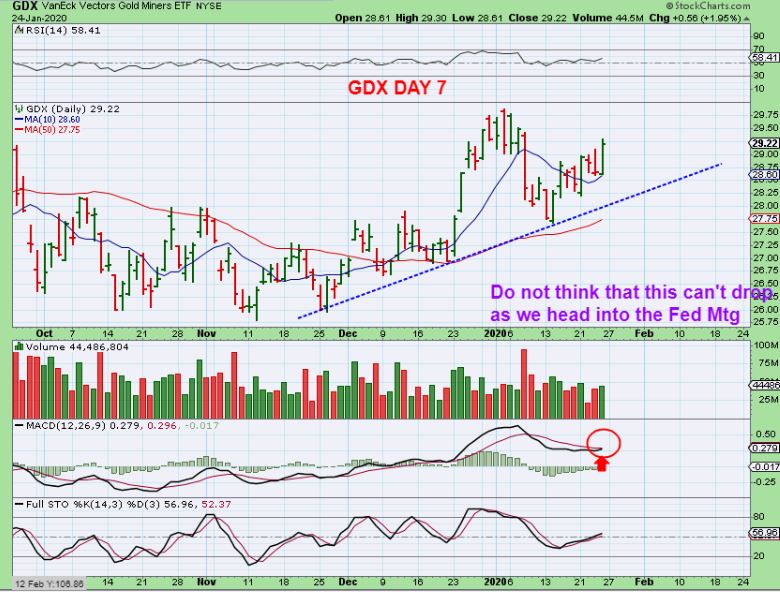
.
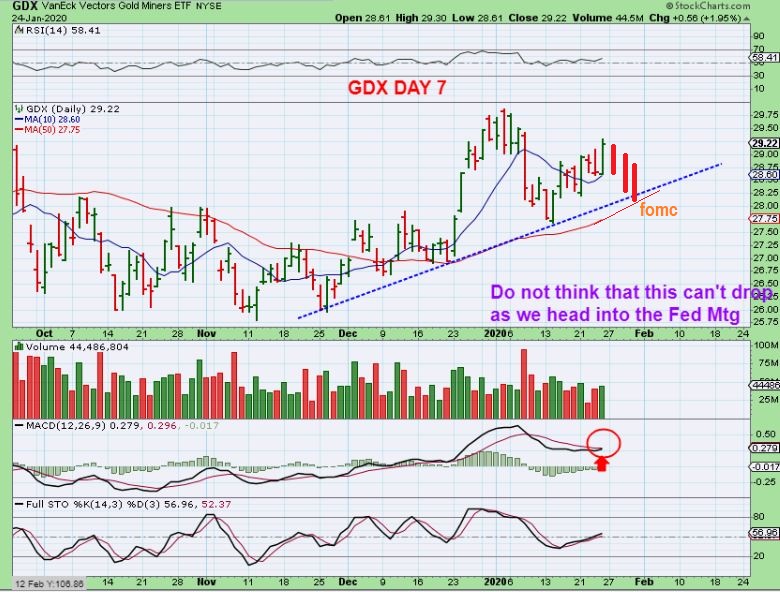
Since we had that ‘reaction’ on Thursday as GDX dipped, I am going to say this now to prepare the readers for what could happen next week. We could rally higher, but please know that YOU MIGHT SEE GDX DROP HEADING INTO THE FED MTG too. If you see this on day 8,9,& 10- it doesn’t change anything about the daily cycle unless recent lows get taken out.
.
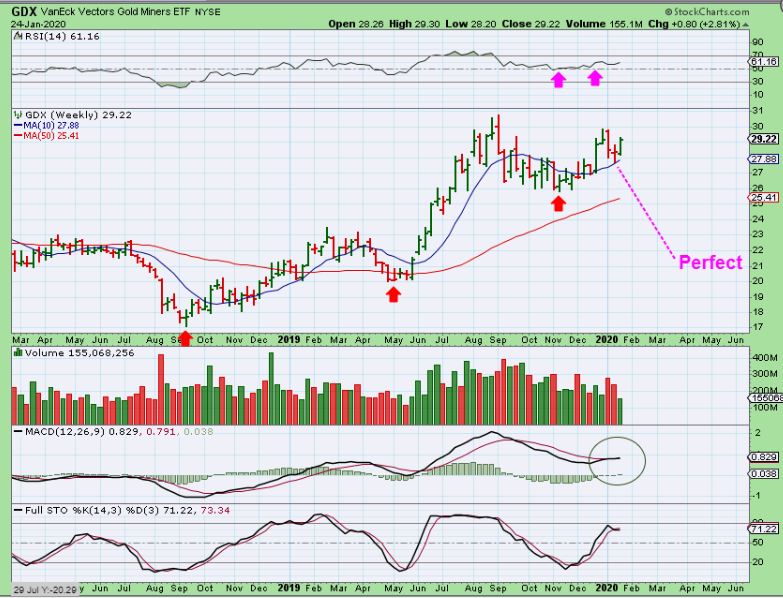
GDX WEEKLY – Now look at the weekly chart and we actually had a perfect dip to the 10 week ma as that dcl & then it reversed higher. I admit that this could just chop around and form a handle on a cup, but at this point it looks pretty bullish, and could just break out & run higher.
,
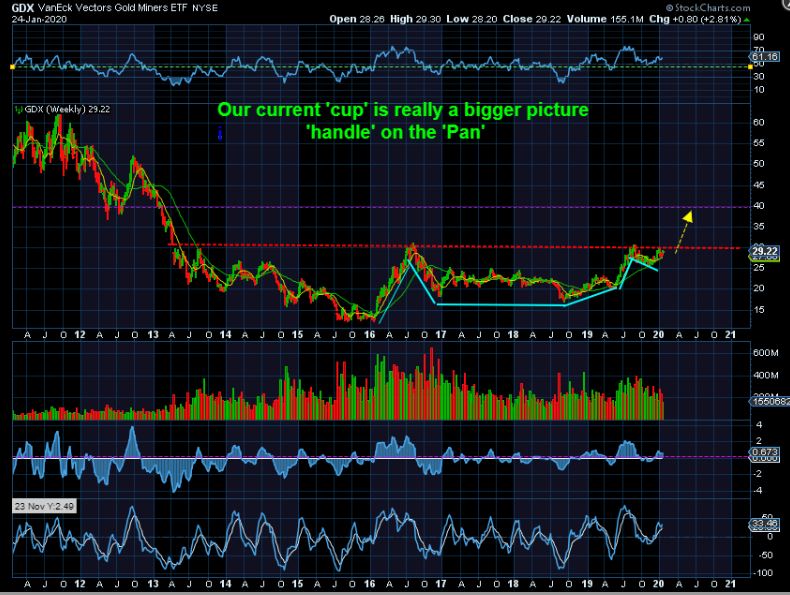
GDX WEEKLY BIGGER PICTURE – The ‘Step back & look at the Bigger Picture‘ view that I love to present here in the weekend reports remains absolutely Bullish! This is actually an enormous 7 year base! We have also recently formed a giant Pan with a handle at multiyear resistance. When this breaks out higher, it could rally to the $40 area before hitting significant resistance.
.
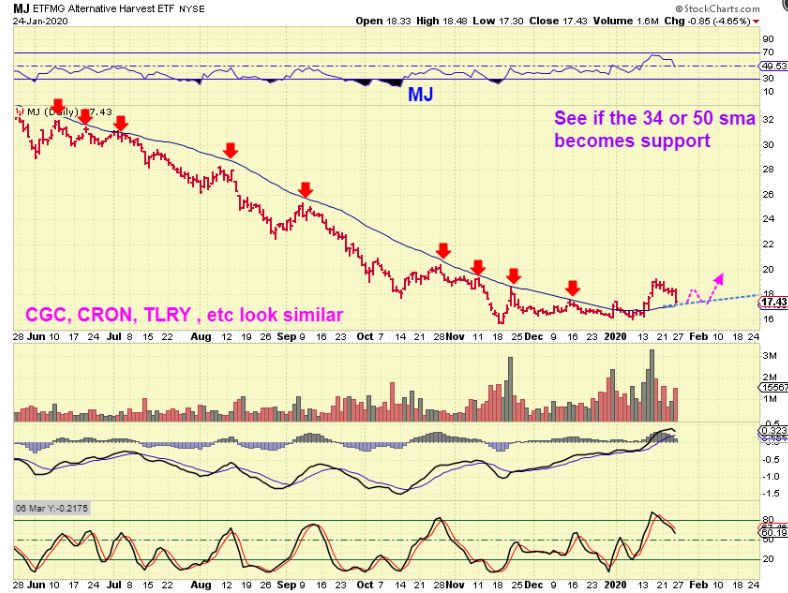
The General Markets are due for a Daily Cycle Low ( DCL). The last dip only lasted 3 days, so we can keep an eye on the markets and see if they try to sell off & bottom around the time of the FED MTG this week or not. The MJ Sector dropped with the General Markets and several MJ Stocks like CRON, CGC, TLRY and so on seem to want to drop to the 34 or 50 sma. When we get a General Market DCL, MJ Stocks may or may not begin the next leg higher too. I will be watching for that.
.
Oil has been choppy and is selling off, likely back to the lows of that range shown in the charts. I am not really trading that sector, but it could be done short term when the next dcl / swing low forms.
.
As for the Precious Metals? The set up is currently Bullish. The timing cycle-wise would be good for a nice run higher since we are only on day 7 of a 2nd daily cycle. The only problem would be the resistance areas. If resistance makes it become choppy, we may see more sideways action like a handle on a cup for Gold. We have a Fed Mtg this week, so I’ll discuss that in Tuesdays report, but it also could cause a break through that resistance area. The big picture remains a very bullish set up for this sector though.
.
Enjoy the rest of your weekend & thanks for being here at Chartfreak with me 🙂
.
~ALEX
.
MJ ETF – I’ll be looking to see if the many break outs in this sector are the start of a trending move higher after this pull back.
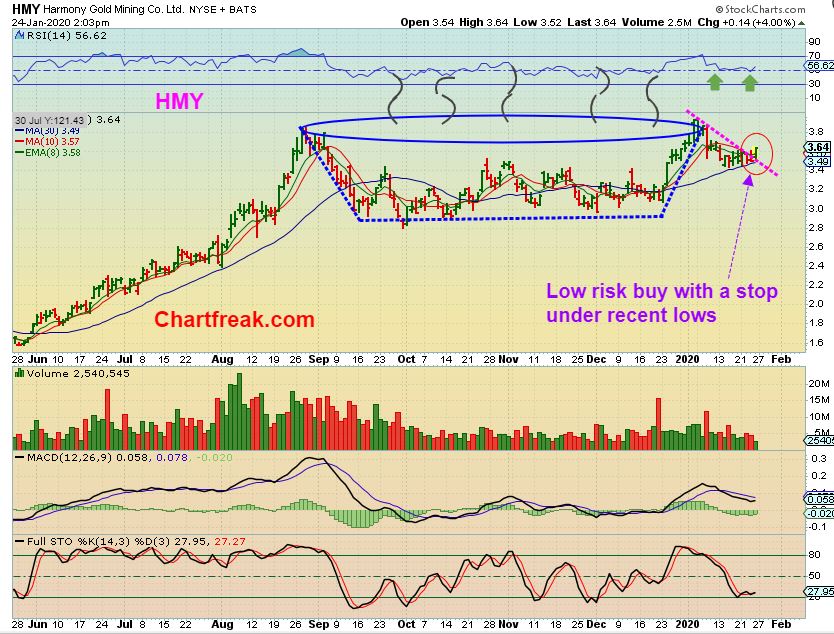
HMY has been posted as a buy
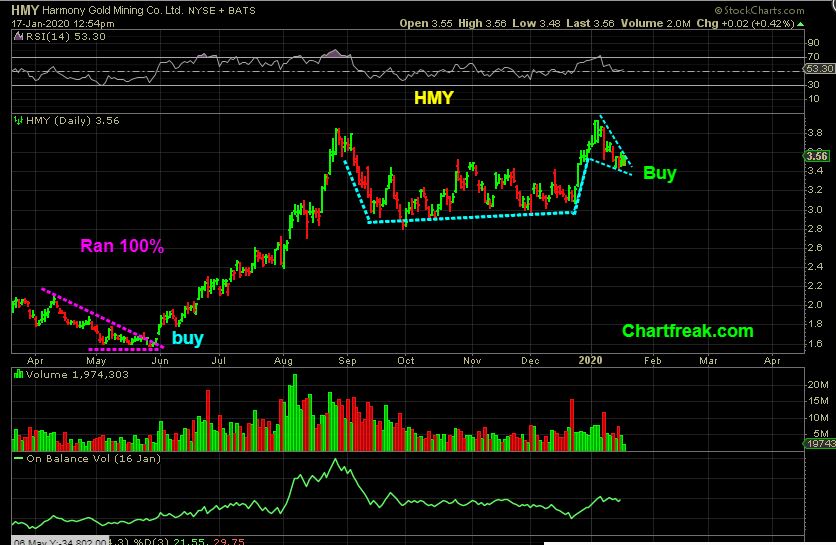
HMY – It is now breaking out. I own it.