
Weekend Review – The Good News First
.
Well, getting to the good news first shouldn’t be very difficult this week: It was ALL good news. 🙂
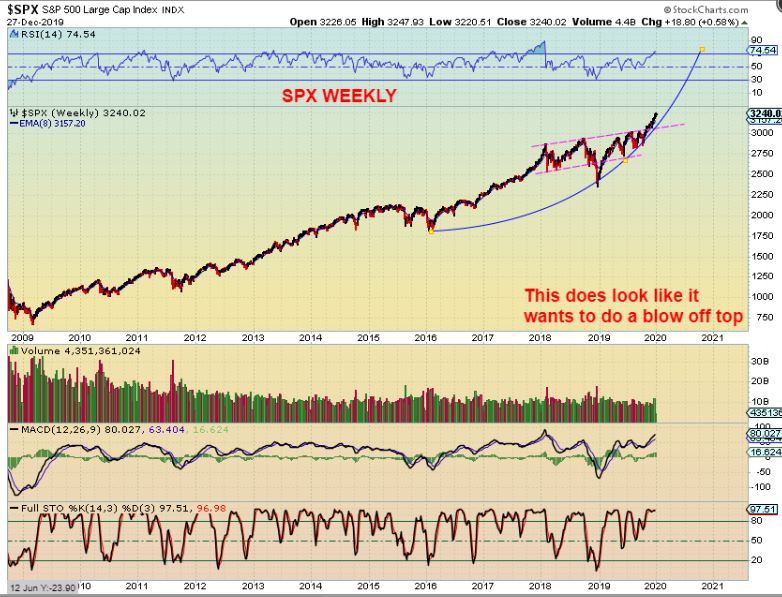
SPX WEEKLY – The move out of the last dcl has been fairly straight up. After breaking out of a 2 year sideways consolidation, that makes it look like it could do a ‘melt up’ or a run into a ‘parabolic blow off top’ like we have discussed in past weekend reports. That is 1 real possibility, however, that being said…
.
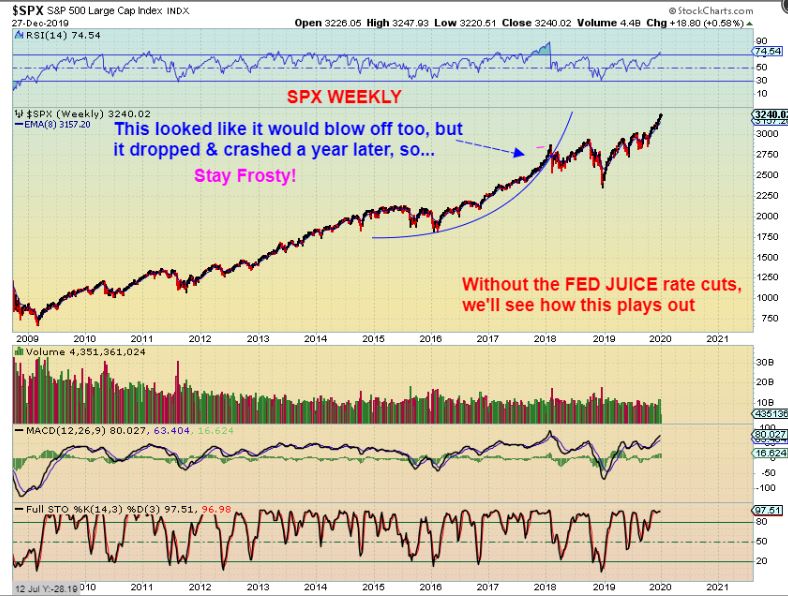
SPX WEEKLY – We did also see a steep curved run recently that crashed in early 2018. In fact,
1. That steep peak shown here was also ‘a year end rally of 2017’ that ran straight up into January 2018-
2, And then it crashed in the New year when sellers locked in profits.
2. We are now going forward without Rate Cuts again. Will this crash in the new year? We’ll have to continue to watch this one closely.
,
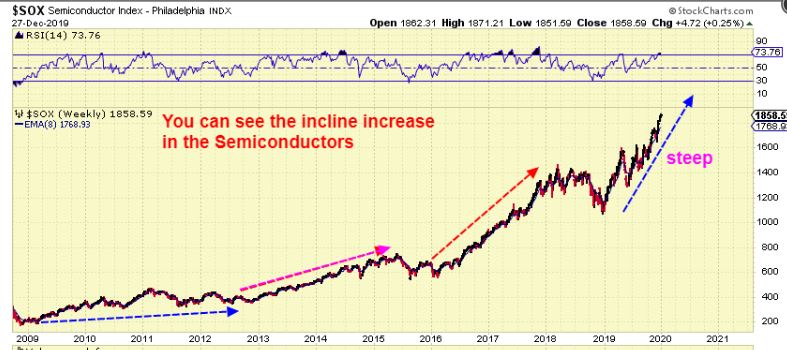
SOX WEEKLY – The SOX actually looks like it is experiencing a steeper than normal incline too, so I would say that this still indicates that a blow off top may be in the works. Time will tell.
,
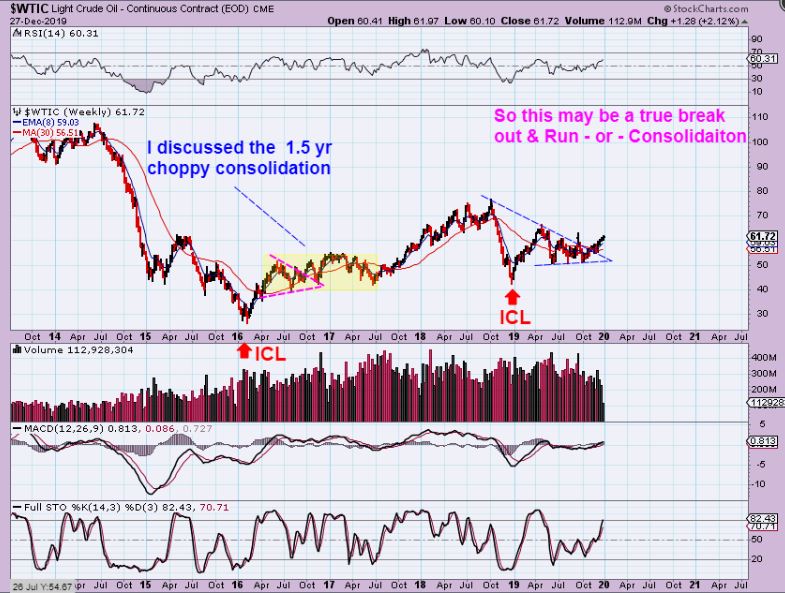
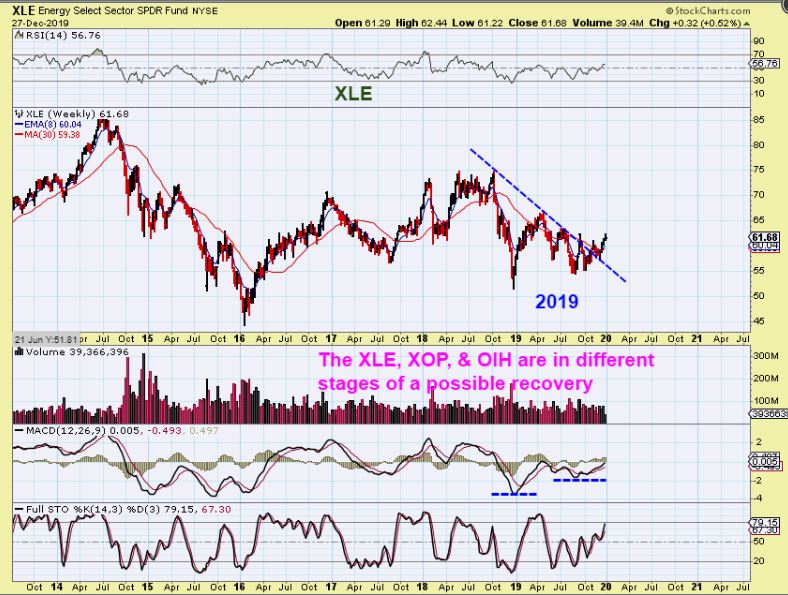
WTIC WEEKLY– After months of sideways chop it looks like Oil broke out from a downtrend. I had been discussing how similar the recent Choppy sideways action was to the 1/5 yr chop of 2016-2017. THAT Triangle broke out after 1 year too, but it didn’t just rocket higher from there, so even though Energy Stocks have bottomed and look great, we will proceed with this information in mind. What do Energy Stocks look like now? …
.
XLE WEEKLY- In my opinion, The XLE broke the downtrend and should rally higher. This has been choppy with Oils chop, but this looks Bullish on its own. The weekly MACD & RSI have divergence for example.
.
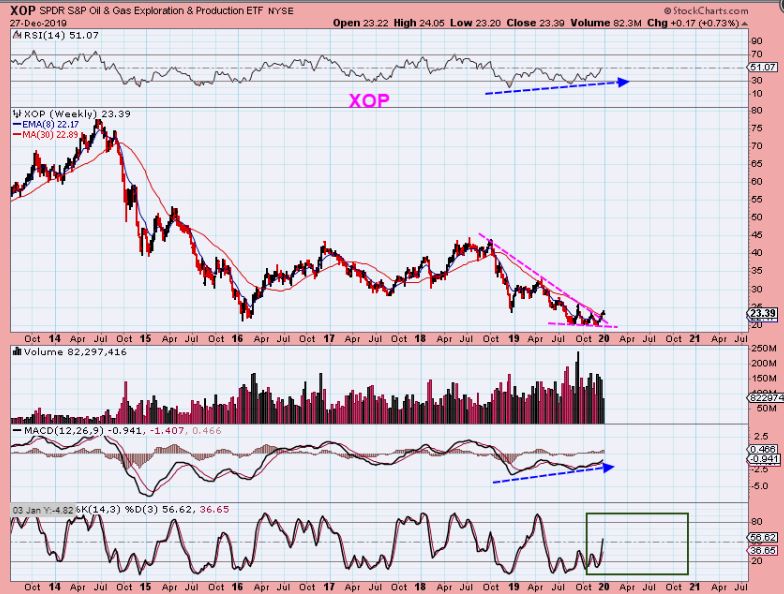
XOP WEEKLY– The XOP looks very different than the XLE or OIH, but it also looks bullish on its own. I see a downtrend break and a small wedge. With this, I still think that OIL & ENERGY Stocks are a Buy, though they may get choppy at times.
,
.
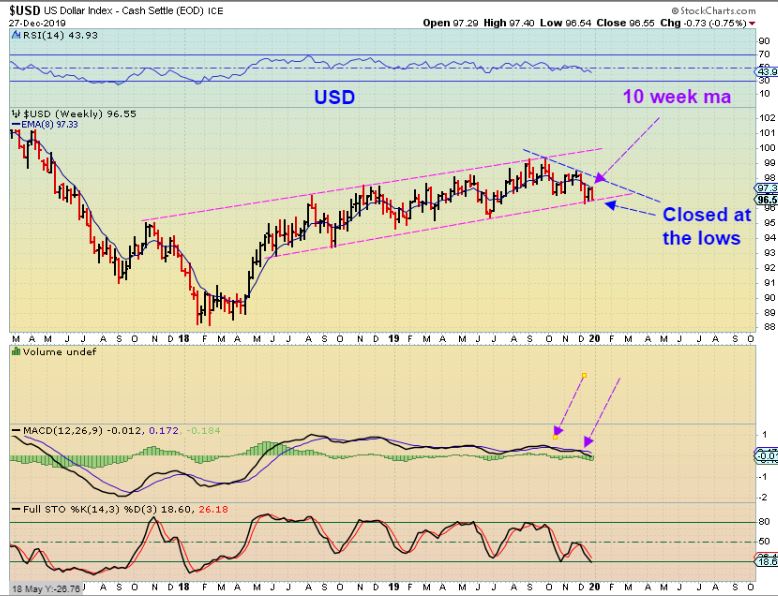
USD WEEKLY– The USD dropped fairly sharply on Friday and that left it at the weekly low. Follow through selling from here next week would be a ‘Break down’. That would usually prove Bullish for Gold. I am expecting further upside for Gold, Silver, and the Miners, so it looks like the USD is finally going to break down. Next week should give us the answer on that.
,
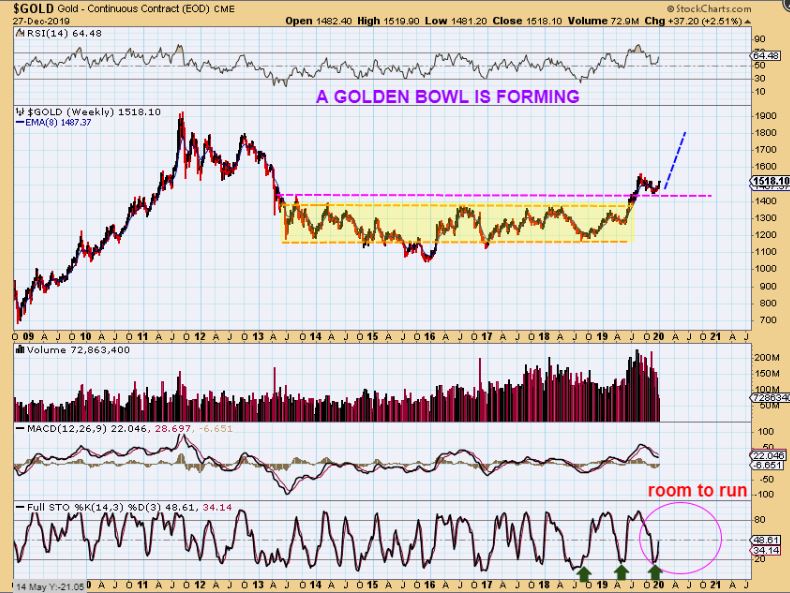
GOLD WEEKLY – Golds big Picture has been Very Constructive in continuing to form a large bullish bowl. This base is about a 6 year base and that can build the energy needed to launch price into the former highs over time. I am Bullish on Gold and will continue to cover it in detail in the daily reports.
,
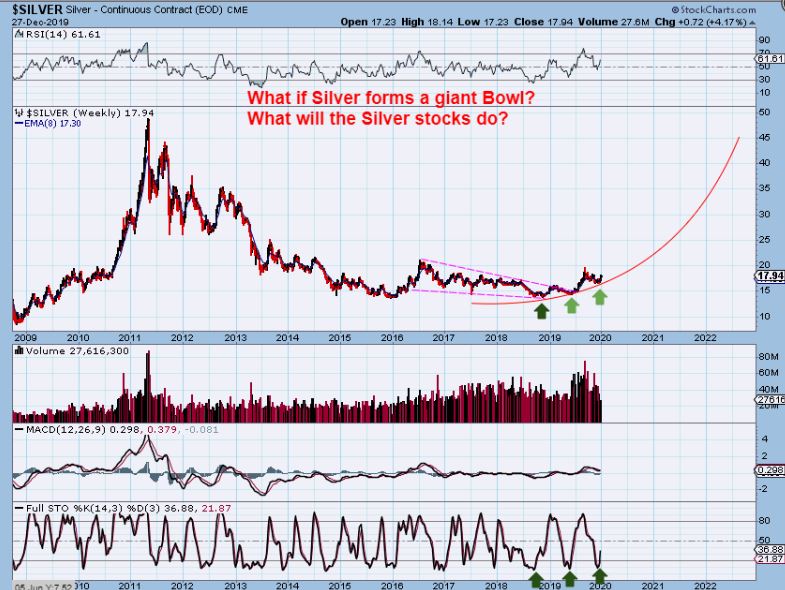
SILVER WEEKLY – This is also a bullish consolidation after the 2011 parabolic blow off top. The last ICL was a higher low, and we look to be forming another higher low now. Read the chart, this is Bullish.
.
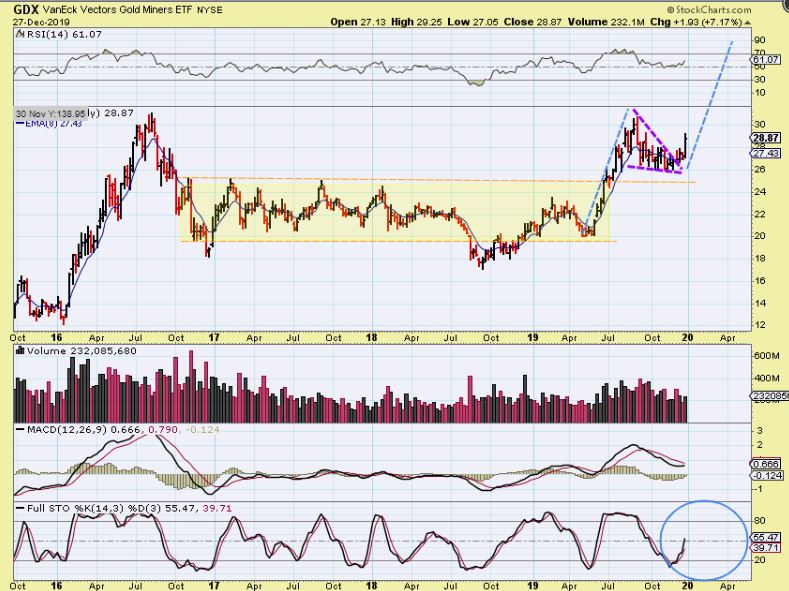
GDX WEEKLY – The weekly chart shows a solid break from the flag like consolidation. Will it run straight up like the May – September rally? Or will it Pop, Run, & then Chop like the 2016 Rally? It is hard to say, but either way it is a strong looking Bull Set Up. Individual Miners like SVM, HL, CDE, PAAS, etc are already running straight up, so things look very good for a strong run into 2020. In fact…
.
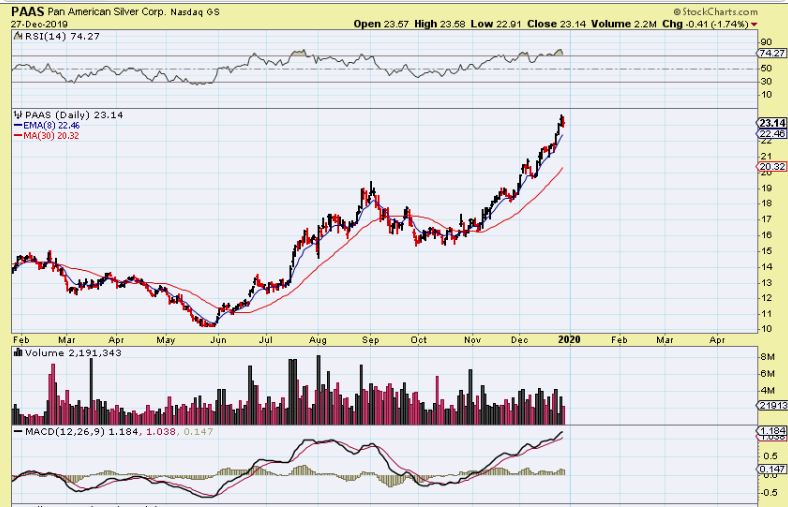
PAAS DAILY – A strong run practically straight up is what we are seeing in PAAS, SVM, CDE, etc. The sector is bullish and I think that 2020 will be a great year to be trading Miners. So…
.
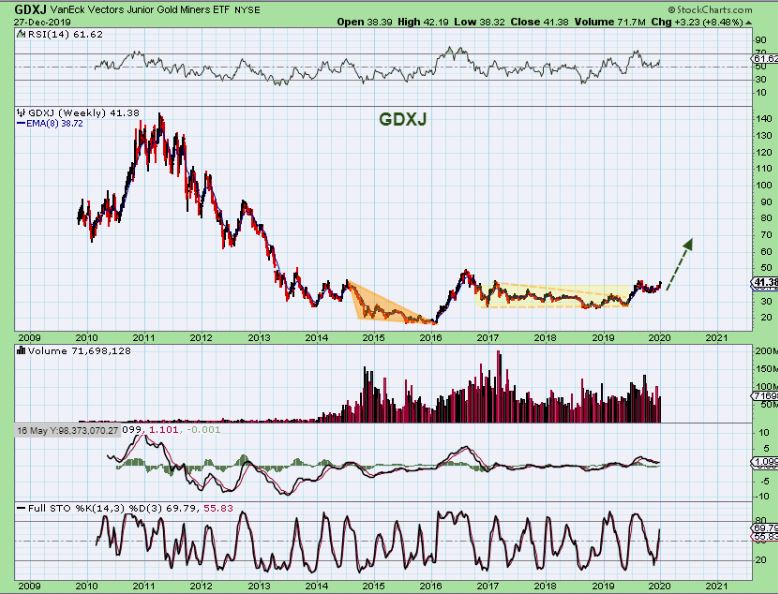
GDXJ WEEKLY – The BIG PICTURE for GDXJ WEEKLY is a very bullish base. Just take a look at the run from May to September of this past year (2019). Wouldn’t you agree that it hardly stands out when you compare it to the potential that this sector has on the upside over time?
.
GDXJ WEEKLY AGAIN – The somewhat frustrating sideways choppiness that we just went through hardly shows up when you look at the open space above that GDXJ can run higher in. This is a nice multi-year bullish base and many people still doubt that Miners can run higher. They will join in later and push prices even higher.
.
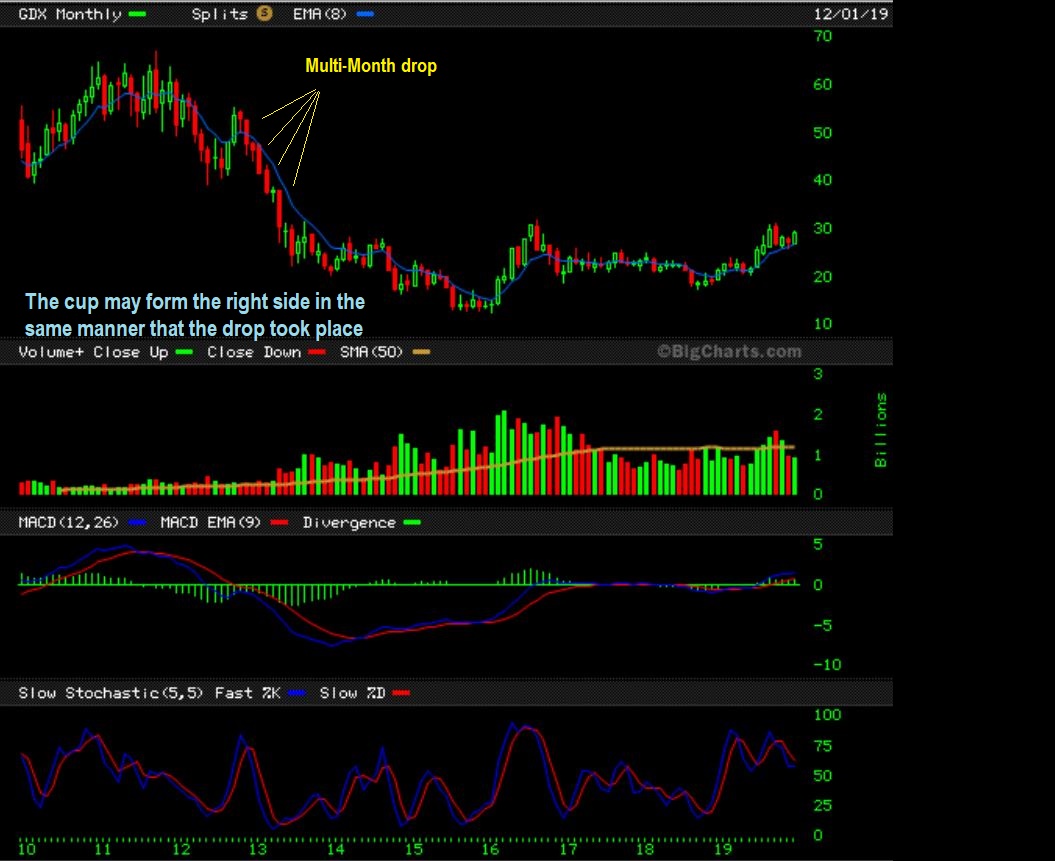
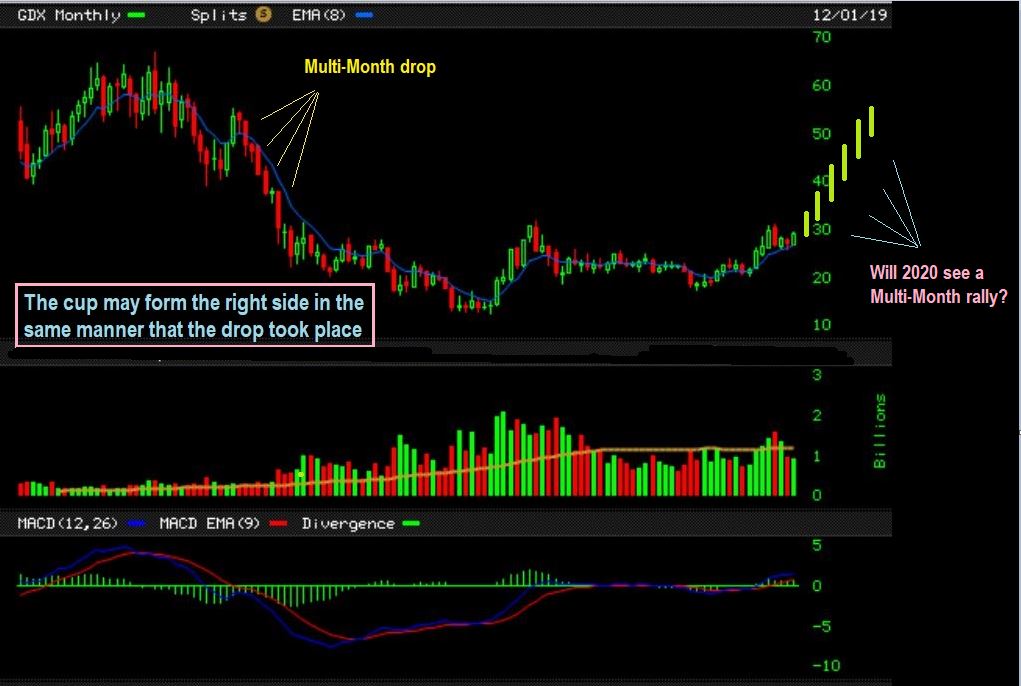
GDX MONTHLY #1 – Now the GDX Monthly chart is developing into very bullish set up too. I don’t want to sound silly or overly exuberant, but a Multi Month rally can unfold once this gets going & the doubters & Funds start piling in too. Read the chart and look at the multi-month drop on the left. Do You see the 7 down months out of 9?
.
GDX MONTHLY #2 – In the future, we could rally for 7 up months of 9. I cannot say if it is time for that yet, and I admit that I expected 2016 to continue at the pace that it was rising, but when a cup like this forms as shown? You do not want to be on the sidelines doubting whether or not these Miners can rally. Ask anyone that sat out the 2016 run and they’ll tell you how sad that was. It was hard for many to just jump in, and it just kept running. The right side of a cup could be bigger.
,
What’s the Good News? If you like to be long the markets, we currently have several sectors that are acting Bullishly. As for the Miners? Wow, those are beautiful weekly charts and now Monthly charts! I am NOT SAYING that you should go and refinance the house and load up in Miners as a sure way to get rich. No. What I am saying is that these charts are now setting up more and more bullishly with each passing week. There will still be consolidations periods, dips into a DCL here & there, sideways choppiness, and even the deeper ICLs will cause doubt and worry, but this does look to be acting correctly.
Miners are really setting up as I had expected from a year or 2 back. THAT is what gets me excited. It hasn’t broken down, it hasn’t failed to find support, it hasn’t even been hindered by the strong dollar, it rallied with interest rate hikes and rallied with interest rate cuts. It rallied with a high ‘Smart Money Short’ position last May , June, July, etc and Even with the talk by the Fed of a lack of inflation, Gold is rallying and now putting in higher ICL ( lows). It remains on track to be a Bull Market, and with that we will make some excellent profits on this sector. I have taken a long ride on this bull back in 2000 through 2011, and these Miners can really run swiftly. 100%, 200%, 500%, even 10 baggers over the coming years. THAT is the real Good News about this weekend report. The Gold Bull continues to be right on track! 😉
.
Enjoy your weekend and thanks for being here with me at Chartfreak!
,
~ALEX
,
I want to add a bit more to this report:
.
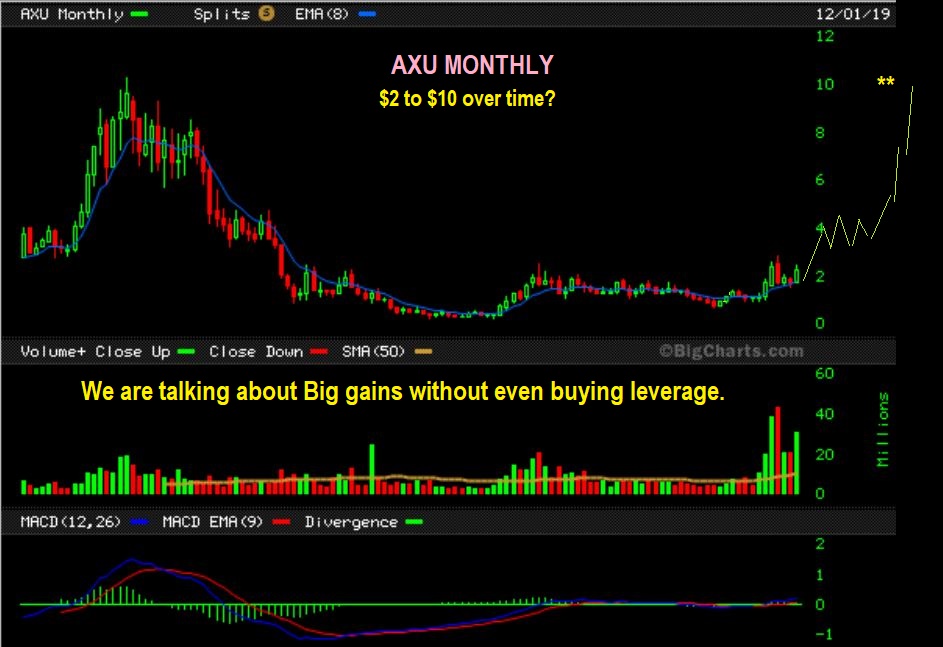
AXU MONTHLY – With the end of December, we are 2 trading days away from the end of the Monthly Chart. IF AXU recovers, you can see the potential over time here too. I’m not even talking about JNUG or NUGT & Leverage, but these miners can act like they are leveraged at times.
.
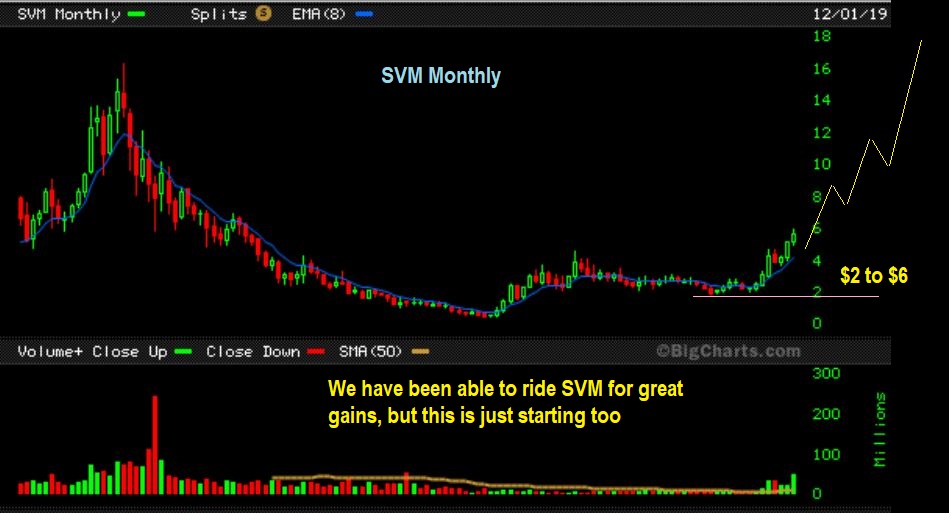
SVM MONTHLY – This chart shows our recent Big Run in SVM from $2 to $6, but also shows the potential going forward. One day we may look back and see that it ran from $2 to $18. That is 800% gains.
.
NEM WEEKLY BIG PICTURE – After the 2016 run, NEM actually consolidated for 3 years. This now looks ready to break out and run. This is a nice buy for the longer term Buy & Hold investor as well as the shorter term traders.
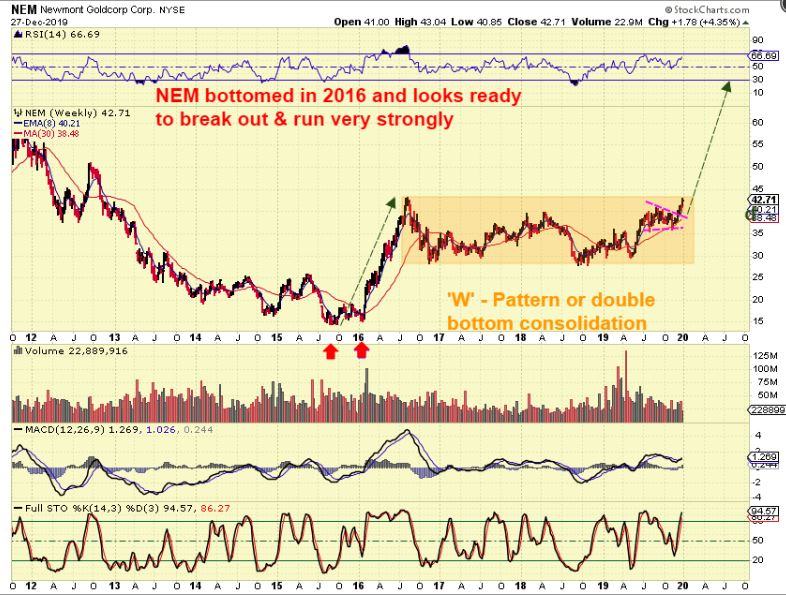
,
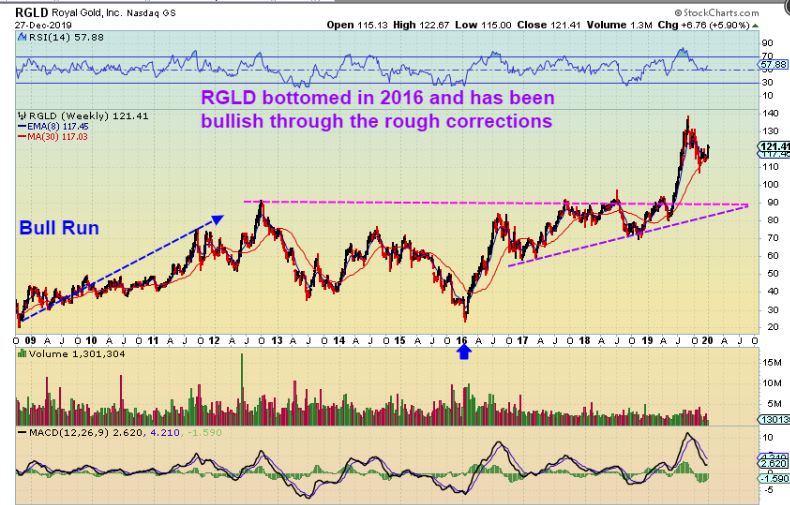
RGLD WEEKLY BIG PICTURE – RGLD broke out from a multi year consolidation like NEM, and you can see how nicely that run was in 2019. It has pulled back and may be ready to go again.
NOTE: Since 2016 when this dropped to $20, it has moved from $20 to $140 in 4 yrs. This was NOT an easy ride, certainly NOT straight up- but basically $20 to $90, and then a dip and $70 – $140? That is a big deal and other miners can perform as well when this bull Gets running strong.
,
SIDENOTES:
.
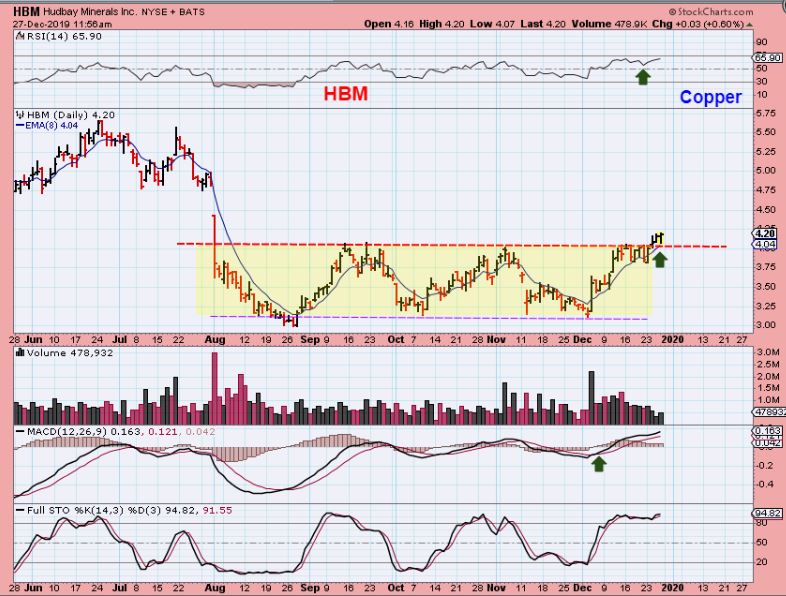
HBM DAILY – This was a buy in early December , reversing off of the lows. I just wanted to mention that the copper stock HBM has now also broken from a 4+ month base.
.
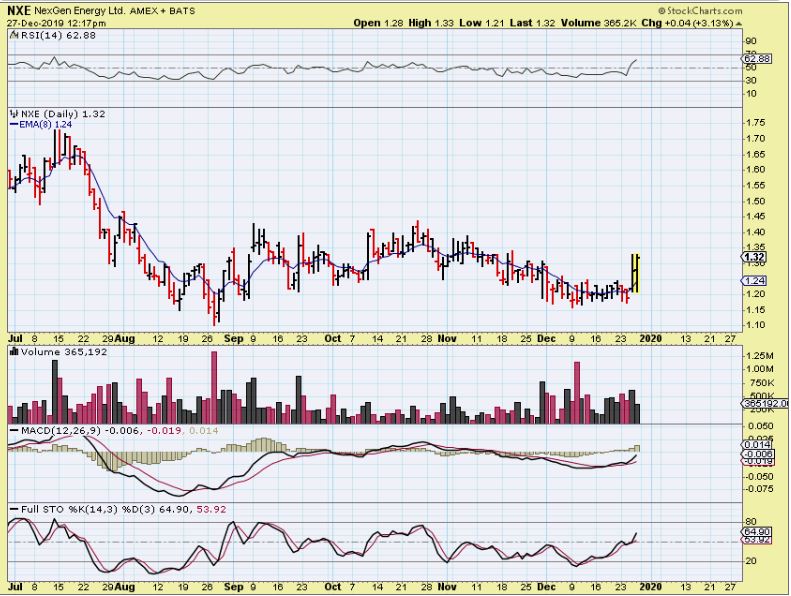
NXE (Uranium) DAILY – This was midday and the volume was coming in nicely. It closed here with equal volume to the prior day. It looks ready to run higher too.
I have mentioned this before, but I want to repeat myself by saying that some individual stocks / Miners may have added risk. It is best if possible to buy a basket of Miners ( 5+ or so), to avoid a sudden drop by one. Let’s say for example a Mine experiences a flash flood, or an earthquake , or even just a public offering. That stock can drop 10% right at the open, so you only own that 1 Miner, it hurts. I personally want to hold a few Miners or an ETF to minimize risk. GDX, GDXJ, SILJ ( SILJ is a silver stock etf and has done exceptional). Leverage like USLV, UGLD, AGQ, JNUG or NUGT is optional, but DO NOT USE LEVERAGE IF YOU ARE CONSERVATIVE or new to trading. It is also better to start small- it moves FAST and can damage an account in a downswing. Position size itself can minimize risk.
.

