Fed Wednesday December 11th
I was looking at the charts, and they give me a Gut Feeling about the results of the FOMC Mtg, but I don’t trust my gut in this situation. How can I? I’ve seen what look like perfectly good set ups fall apart or just break down after a fed let down. Well, I’m going to show you what I see, and say what the set up gives me for a Gut Feeling, and then we’ll just have to wait and see what happens. Lets begin with the General Markets…
.
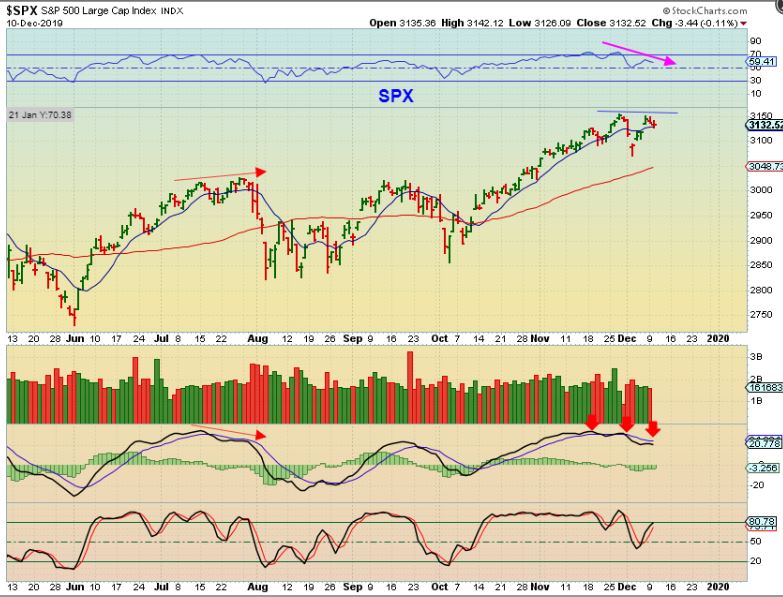
SPX – I expected a run higher, and we COULD get a pop & push to new highs with the FOMC Mtg, but MY GUT is saying that this looks like a double top. That would mean we’d get a fake break out and roll over, and that is actually what I have mentioned already- These markets are coming due for an ICL and could roll over as left translated…
.
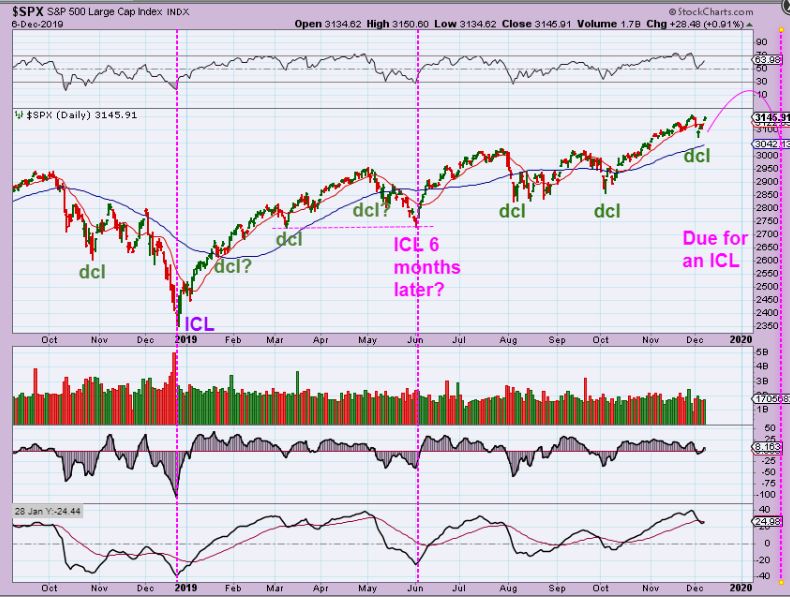
SPX – I posted this in the weekend report showing that an ICL is due. I drew it here running a lot higher first, maybe for 10 days or so, but MAYBE THE FED Pops & Drops the General Markets with a ‘No Cut’ decision instead? Let me show you the NASDAQ…
.
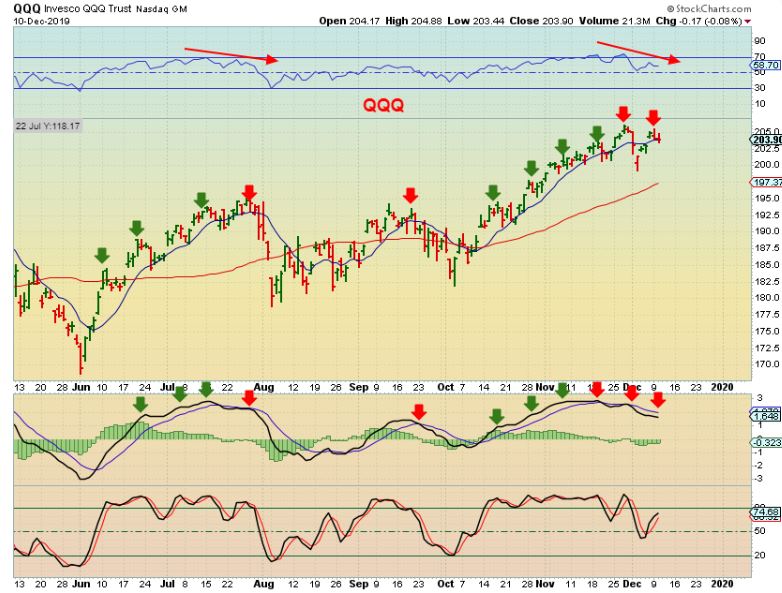
QQQ – This double top is similar to the July Double top, and neither MACD was bullish. Compare the 2 on the chart now. CAN A strong rally correct it? Maybe, but MY GUT says that this wants to going to roll over soon. Let’s zoom in for a better view…
.
QQQ CLOSE UP – With this double top, that MACD has no follow through. You see how it…
1. Crossed under in November, then…
2. We saw a push to a new high and the MACD only ‘kissed’ it.
3. Now we bounced out of a dcl and price is at the highs, but the MACD is weak.
4. My Gut says that this is a weak double top.
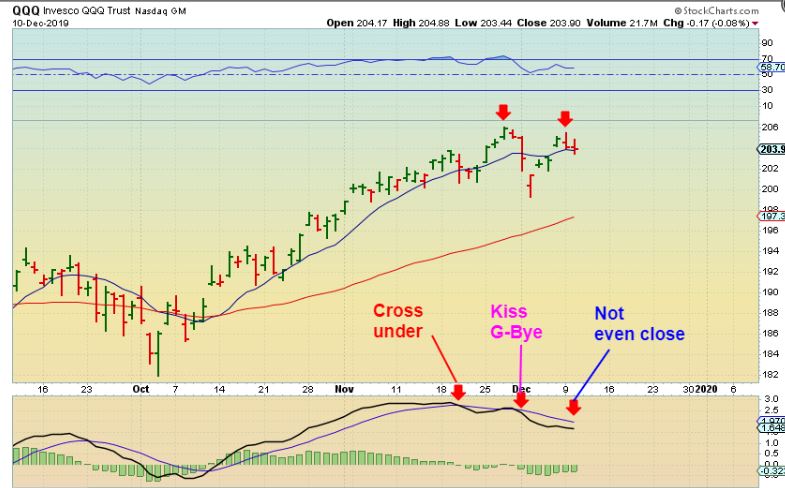
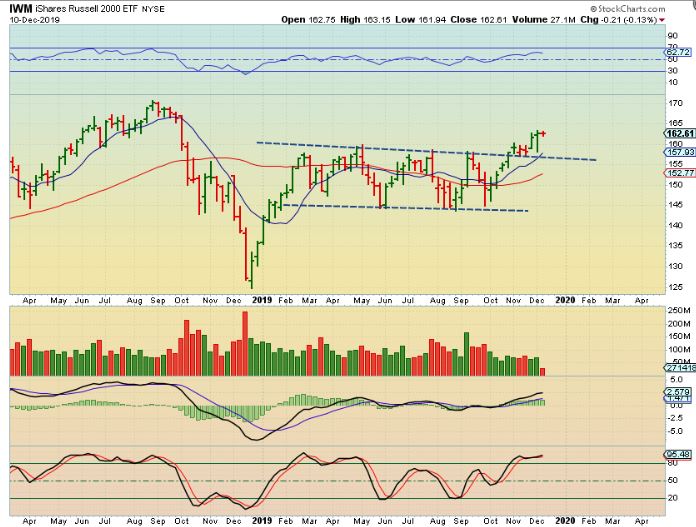
HOWEVER- THE IWM is breaking out and looking healthier. It seems possible that maybe we’ll see some rotation into small caps and Miners.
.
.
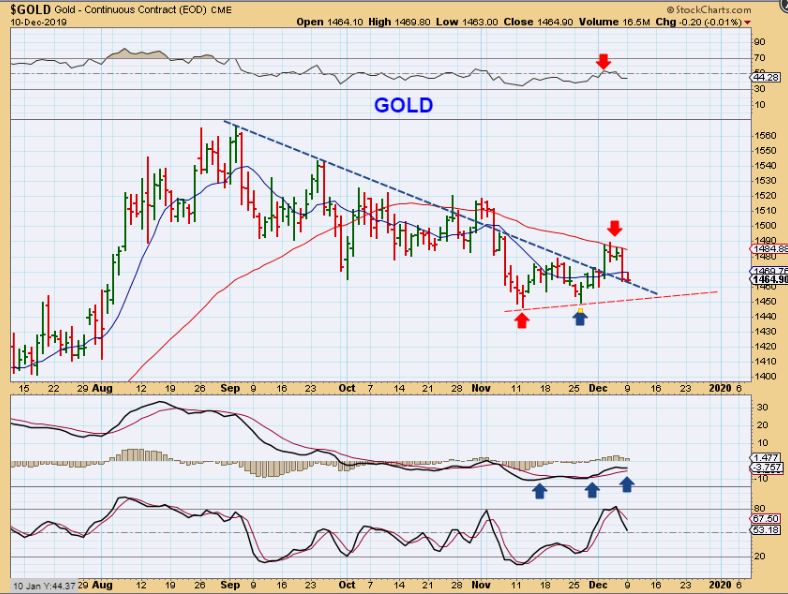
Gold went sideways & was rejected at the 50 sma, and doing that before a Fed Mtg looks bad, right? I mentioned that the Nov Low could be an ICL, but we need to see strength soon, or it can break the lows. I also pointed out that in May 2019 the ICL was choppy & sideways too, so let’s look at the charts for signs of weakness or strength…
.
GOLD – Well let me just say what we have so far, without Bias or without thinking about a ‘No Rate Cut’ decision…
1. This is a trend line break out & back test so far.
2. Price was rejected at the 50 sma, but could pop & try to get through it again. Why?
3. THIS MACD is actually bullishly aligned as it drops (so far).
4. That November low COULD STILL BE the ICL, but price is still close to the lows ( like May 2019).
.
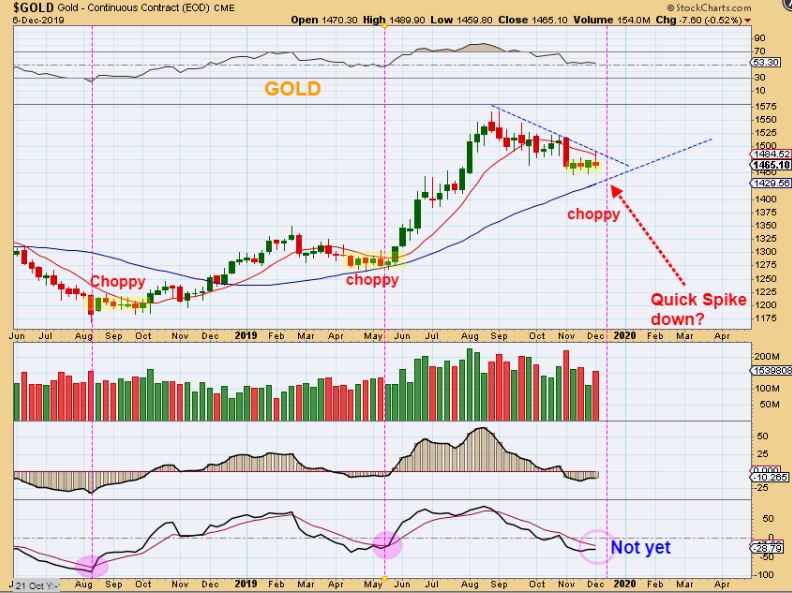
COULD GOLD DO A QUICK DROP TO A NEW LOW & RECOVER WITH DIVERGENCE IN THE MACD? THAT WOULD FORM AN ICL WITH A SHORT DAILY CYCLE , MAYBE A 20 DAY CYCLE? YES, I DREW THIS CHART FOR THE WEEKEND REPORT:
.
I WROTE IN THE WEEKLY REPORT : GOLD WEEKLY – We are seeing choppy trading at the ICLs recently, as the battle of the Bulls and Bears is no longer being won by the bears. It has been harder to drop the price down. An ICL could be in place currently, but we all know that with Gold, 1 more quick spike down on Fed Week is not out of the question. A drop & then a reversal higher post Fed would be great.
.
SILVER – Silver is weaker, but it was weaker at the May 2019 ICL too. It broke the lows & recovered 1 month after Golds lows were in place. Is that happening now? MAYBE- because Silver Miners are not breaking down.
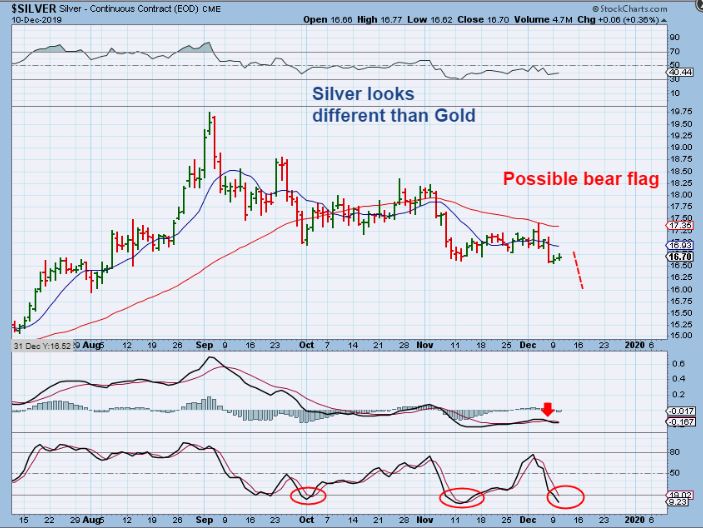
.
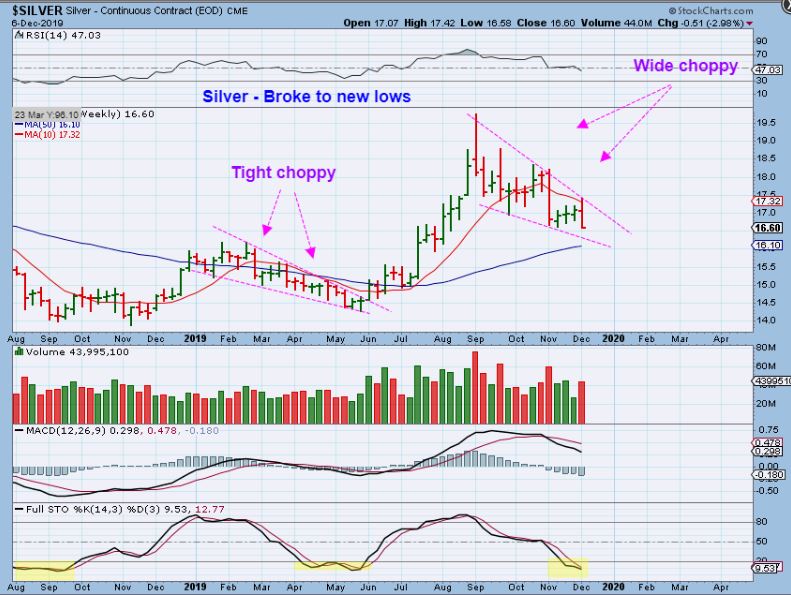
FROM THE WKEND REPORT – SILVER: SILVER made new lows in MAY after GOLD put in the ICL. Will Gold hold the lows like it did in May? We’ll have to wait and see.
.
Miners also may not break the lows, since many have been strong.
.
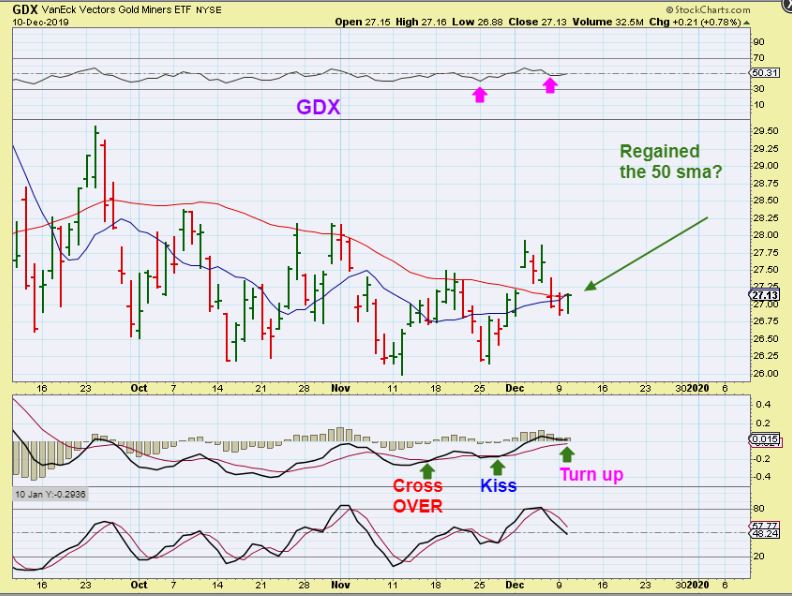
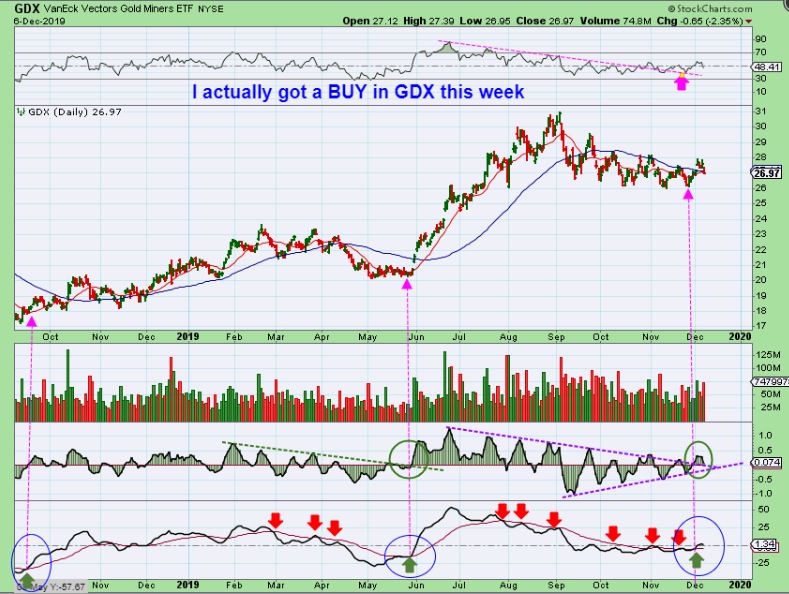
GDX – GDX actually dropped & pushed higher to regain the 50 sma. WE ALL KNOW THAT THE DAY BEFORE A FED MEETING, THAT ACTION DOESN’T MATTER, IT COULD BE A FAKE RECOVERY, BUT…
.
BUT LOOK AT THAT MACD. That is the exact opposite of the SPX & QQQ. This is a Bullish cross over, and back test ‘kiss’, and on the last drop the MACD hardly dropped at all. NORMALLY MY GUT WOULD SAY THAT IS A BUY. With the FED Ahead, it is tough to be that bold, since even good set ups can be broken down by the Fed Decision. 🙁
.
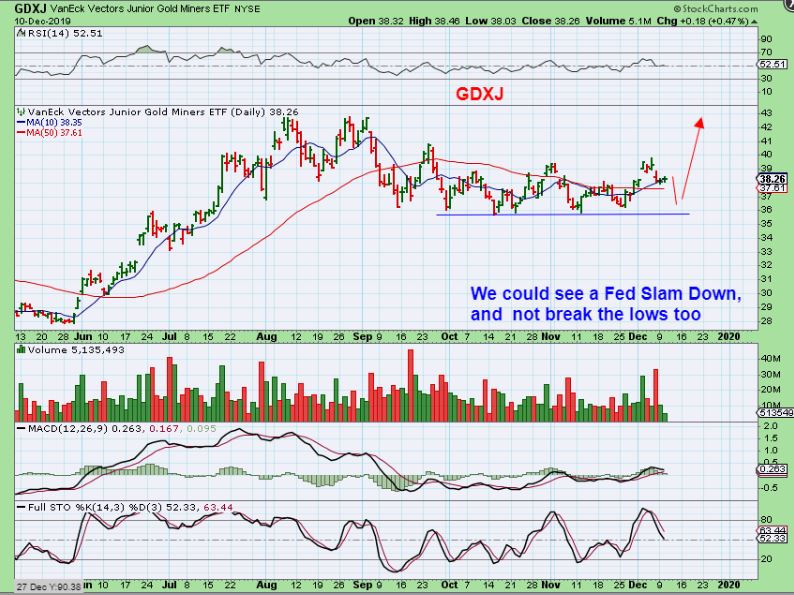
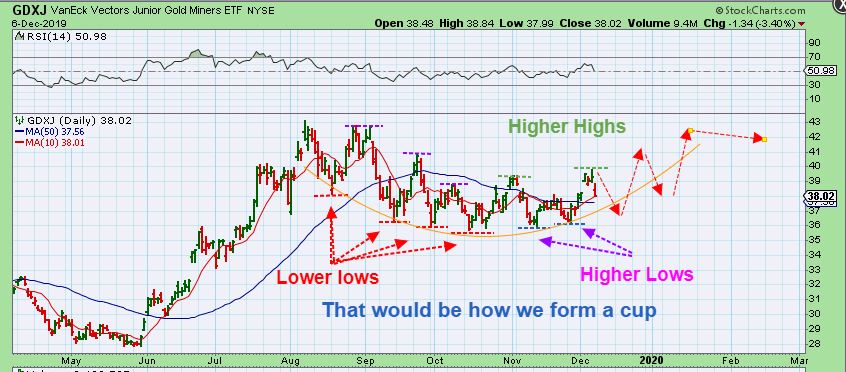
GDXJ – Even a flash drop or knee jerk reaction in Gold & Miners might not quite break the recent lows. That would make this start to form higher lows and …
.
I drew this as possible in the weekend report too, so we will see if this happens. THIS would be VERY BULLISH.
AND THIS IS THE STRANGE THING:
.
AS MENTIONED IN THE WEEKEND REPORT– I actually got a rare BUY SIGNAL in GDX on the last day of November. This set up RARELY gives me a false reading, so what does it mean? It means that the lows should be in place, even if it gets choppy & Sloppy, so I look forward to seeing if the lows hold up with our Fed Mtg this week.
.
With those charts, My Gut actually says the opposite of what I would expect. I would normally expect a rally in SPX for a week or so and then roll over into an ICL with a L.T. Peak near day 10-12 or so. With that I would expect Gold to drop to new lows , form an ICL and Rally when the Markets roll over. That still could happen and all of the divergences that I pointed out would simply get extreme- but my Gut now feel that we may get the opposite of that. The November lows for Gold & Miners would hold as THE LOWS, and a rally that follows would indicate that the ICL is in place and we would ride a rally for weeks and Months, just like the last one.
.
Unfortunately friends, there is No Way to be 100% certain until after the FED DUST SETTLES. We have all seen Knee Jerk reactions minutes after the decision, followed by false moves that go one way & flip to another by the close, etc etc etc. Hopefully by Thursdays report I will be able to identify exactly what is happening. I currently own some Miners, I sold my leverage to avoid a big whip saw, but I will be ready to act if and when the time comes.
And please consider this: Since an ICL run can last for weeks and even months and prices are still near the lows, We do not have to worry about ‘missing the move’ in 1 or 2 days of Fed action. If it dips or crashed, you can buy lower. If it takes off higher & breaks resistance levels – you can add & ride it for weeks and months. There will be plenty of time to get confirmation and go heavier after it chooses the upward direction. Plenty of time to rack up some gains.
.
As for Wednesday, it is also oil inventory report day and the Fed Rate Decision Day, so ENJOY YOUR WEDNESDAY TRADING!
.
~ALEX
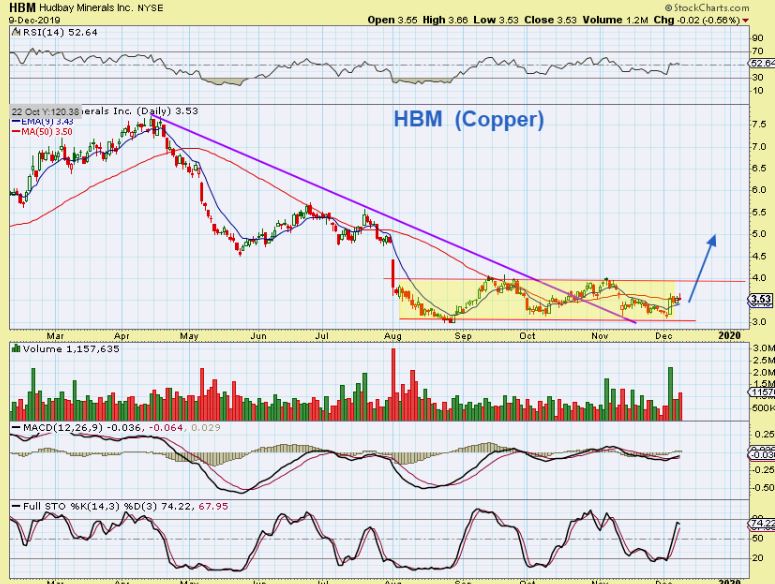
Don’t forget that some Energy Stocks look to be setting up, along with metals. CLF, HBM, FCX, etc.
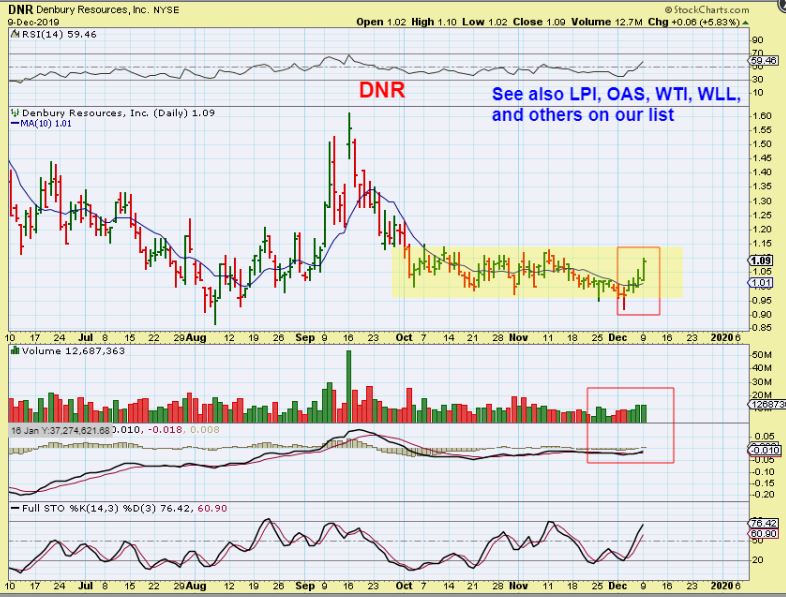
DNR, OAS, LPI, WTI, WLL, etc.
.
From Yesterdays report:
.
Several Metals stocks have been mentioned as bullish too. GGB, SID, X, AKS, FCX, CENX, TMST, ZEUS, HBM, CLF, etc are all bases and many are looking more & more bullish over time.
.
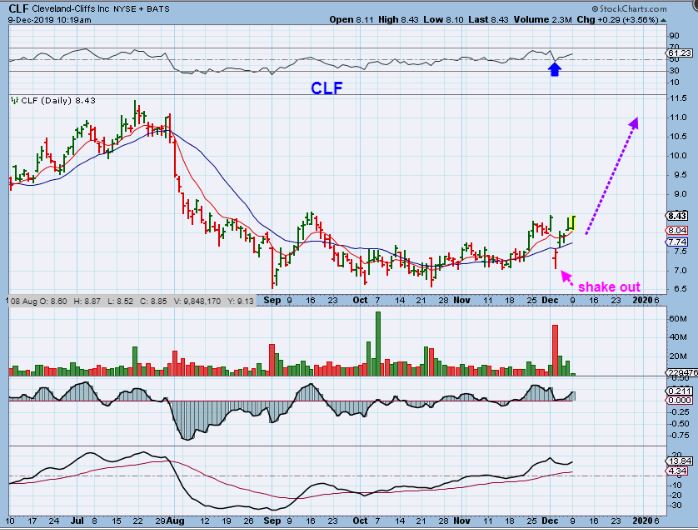
CLF – CLF bought AKS and AKS took off higher while CLF gapped down. CLF actually put in a reversal candle that day and it then gapped open leaving an abandoned baby. It was a buy back above the 10sma, but this is also a buy as it breaks from a 3-4 month base, and looks like it will run back to July Highs.
.
HBM – There are a few bases that are looking very good in the Metals sector. HBM looks to be possibly just getting ready for a run higher as it crawls along that 50sma. It would be playing catch up to others like FCX, which bottomed in October and has started running higher already.