
December 17th
For the sake of time, I will proof read this after I post it, and fix errors if I find any.
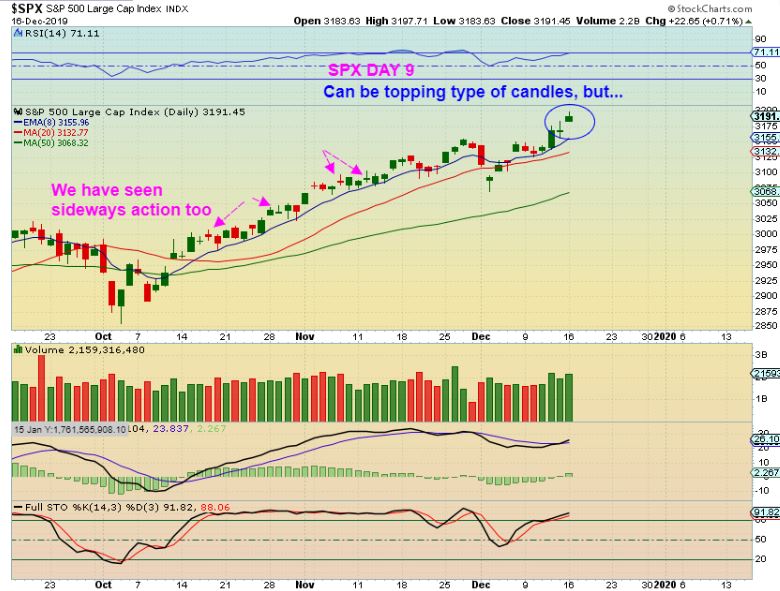
SPX – SPX had a gap open and then a sell off into the close. That can be a topping type candle, but we have seen these just cause a ‘pause’ lately. See the chart. A LARGER GAP DOWN could cause an abandoned baby top. This is day 9, a top here would be L.T., and blow off top would just see markets continue higher. I’d use a stop under the 13 or 20sma.
.
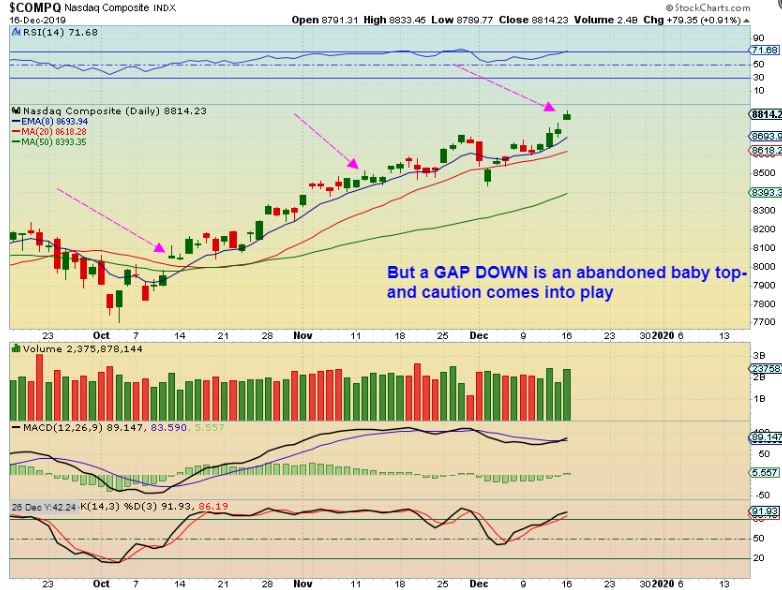
NASDAQ – A LARGE GAP DOWN would look like an abandoned baby here too. A smaller gap down may not matter as price pauses.
.
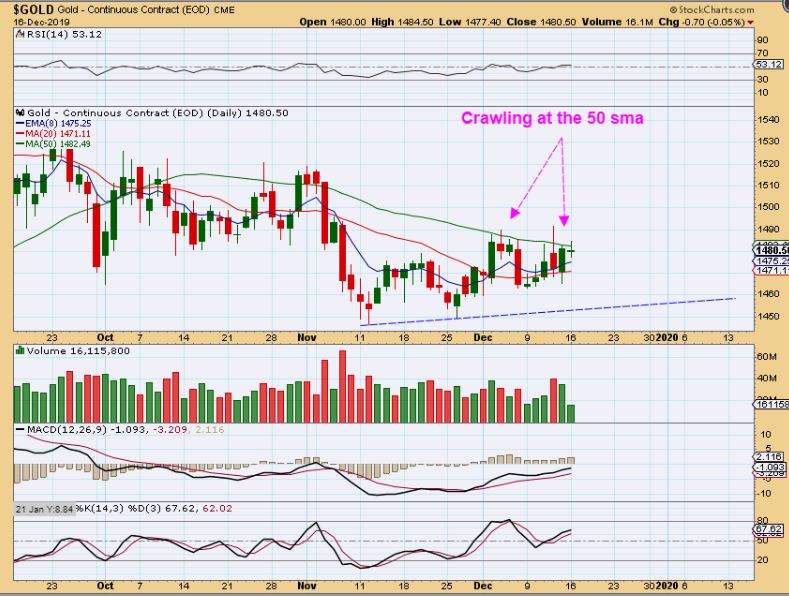
GOLD – GOLD is pushing along the 50 sma. This is day 23 and it looks like a day 21 high. It can drop to a dcl next, or break out. It looks like the ICL is in place from the Nov DCL and we are just chopping sideways.
.
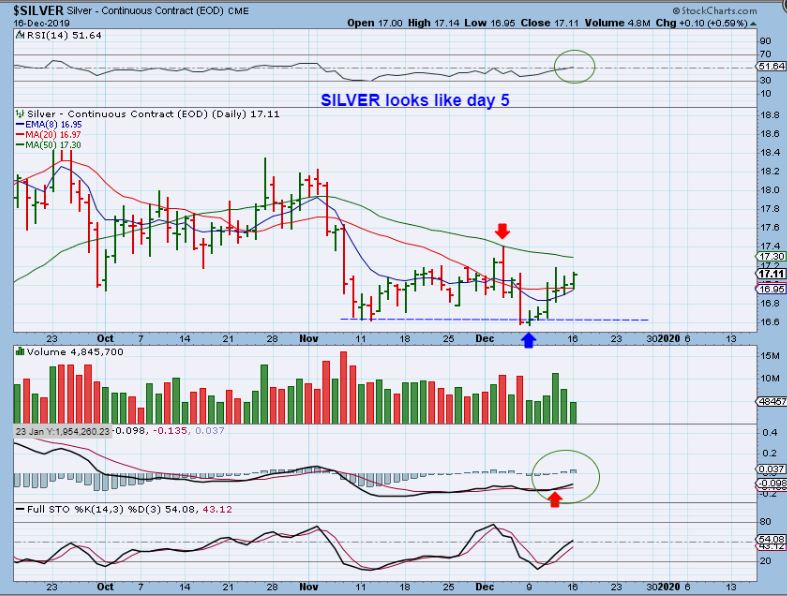
SILVER – Silver put in a new low in December, and in May 2019, Silvers low came in 1 month after Gold. One thing that was odd yesterday was that my Silver stocks were Red, but Silver was green. The stocks were leading the way higher, so taking a break is not alarming, but you’d like to see them green when Silver is green.
.
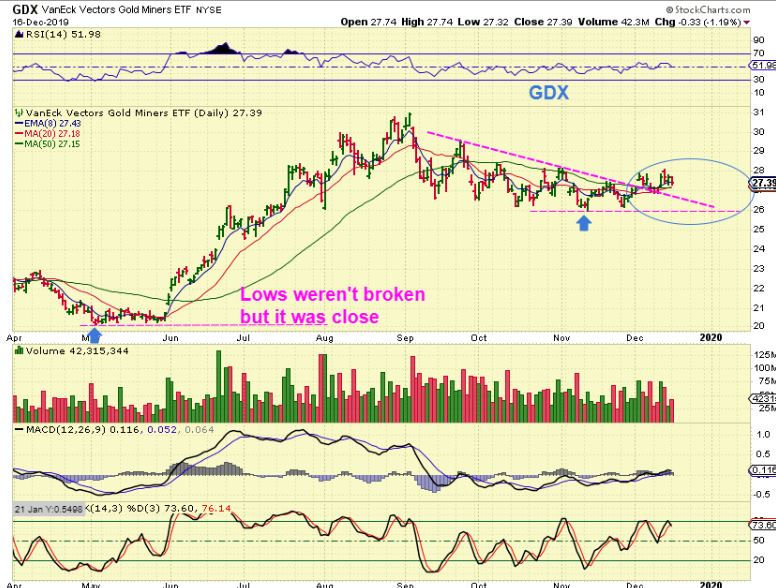
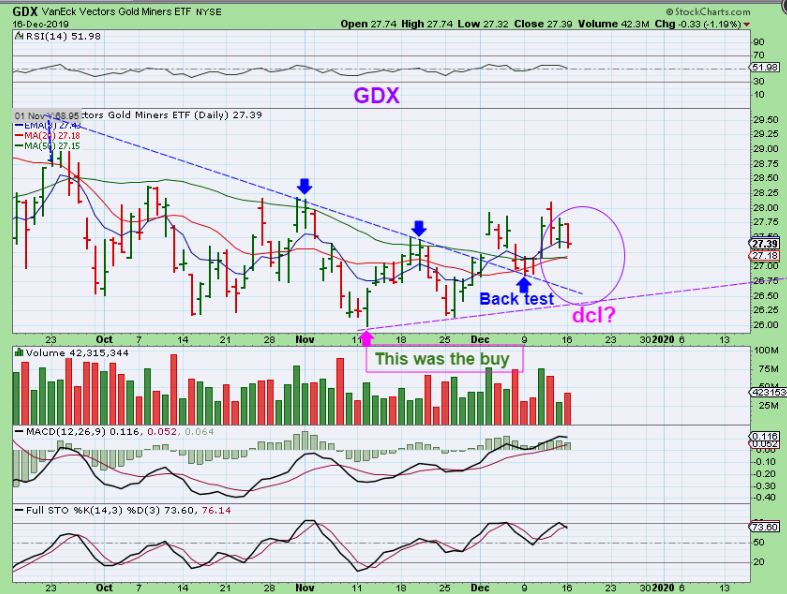
GDX – GDX broke above the downtrend and back tested it too. This also puts GDX above the 50sma. In May , Price dropped right to the lows, but they did not break. Could that happen again? Notice that it already did tag those lows again in late November, so we may be done bouncing around the lows here. Anything is possible …
.
I was asked in the live area to explain when to buy more if you don’t have a full position. I’m not sure what more I can say really, I feel like all possibilities have been covered, but I’ll try to explain it again. I think the problem is that people want “The Perfect Entry’ now, and that may not happen. I have repeatedly been saying in the reports that at this point
1. We buy the dcl in November, maybe start small.
2. As time goes on we see if it is an ICL or not.
3. If it is, you have to either ADD as it breaks out higher or add to a pull back to the dcl. We often add on the Break out of the downtrend or 50 sma, but we did have the FED MTG last week, and that made it tricky until that fomc mtg passed. Now the FOMC has passed, so
.
We are currently in the middle a daily cycle. That means you still need to decide to wait for a dip to buy (that may or may not come) or add since we are above the 50sma. Will this pull back further into deeper dcl? It might, so I drew this as 1 possibility before the Fed Mtg, but so far after the fed, it has held above the 50sma.
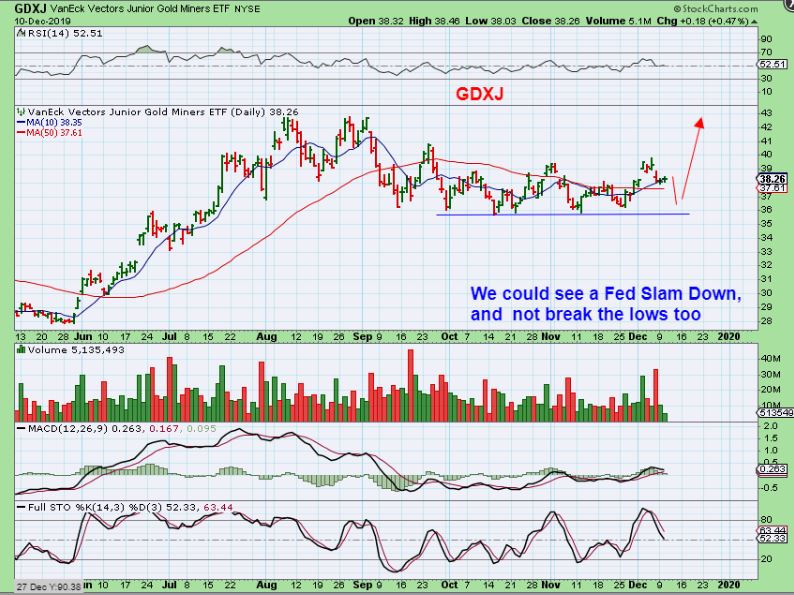
I also said that GDX can run higher to possibly day 28-30, and then just pull back on day 30-32 or so for a higher dcl. Surprises may come to the upside, so I posted this chart DEC 6th to show how we can just get higher highs & higher lows going forward. Where do you want to buy if that happens? Since we just can’t know for sure what will happen next, where is the “perfect buy’? You probably won’t know until hindsight, so I already said that I am heavily invested after the FOMC MTG.
.
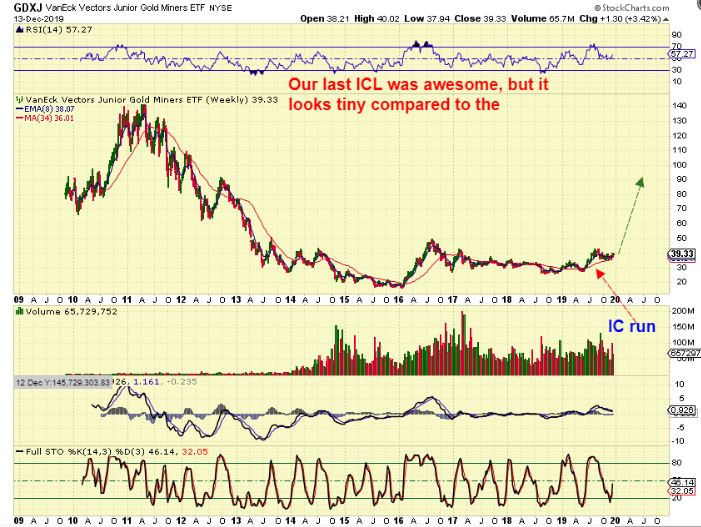
Therefore at this point, One probably has to face the fact that you will not get ‘The Perfect Entry’, and that is why I showed the long term price potential in the weekend report. Finding a way to get in may be tricky, but you do want to be in, right? The potential is great: Buy the break out or Buy a dip if we get one. Some may even BUY The 2nd daily cycle if they want to wait and see if we do get a deeper dip. This can run higher for several weeks.
.
Now Lets zoom in on GDX currently …
.
GDX – So this is where we are right now. GDX is above the 50 sma, but it started dropping Monday. It can bounce off of the 50 sma, or it can drop to the purple line, but we can’t say for sure. We are in the Middle of a daily cycle.
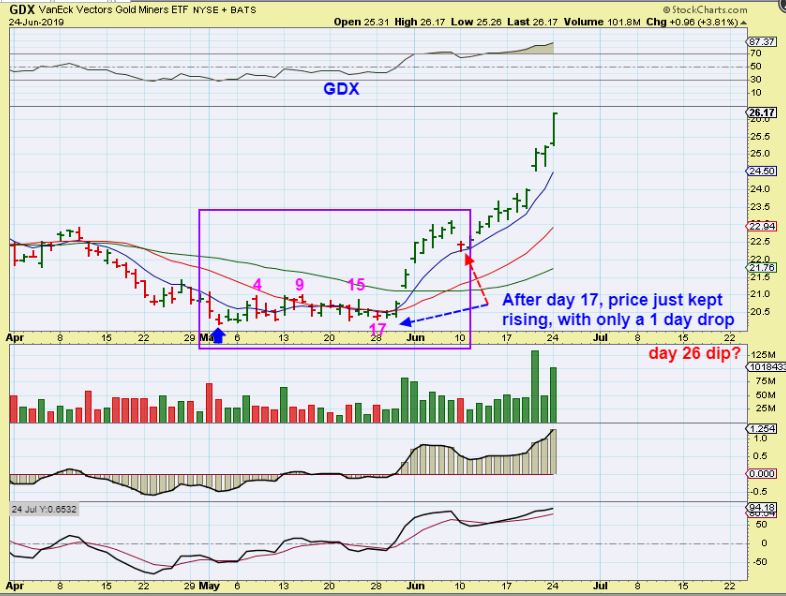
GDX MAY 2019 ICL – We went sideways and got choppy at the lows in May. IF someone asked me , ” It is day 20, Where do I load up the truck?”, what could I say? Price broke above the 50 sma, volume increased, down trends were broken, and it took off higher without a real good dip. Last May I was telling people to buy it and do not sell, because this ramp up may not pull back. It would likely be full of short covering. The current set up probably does not have as many shorts covering, so it is different, but I still expect a run higher sooner or later.
.
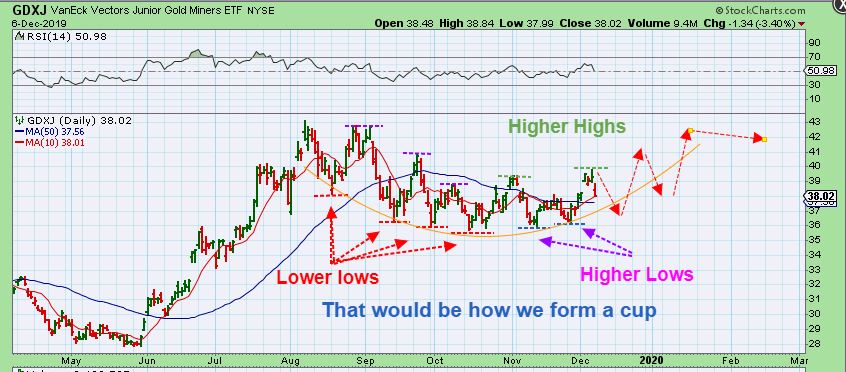
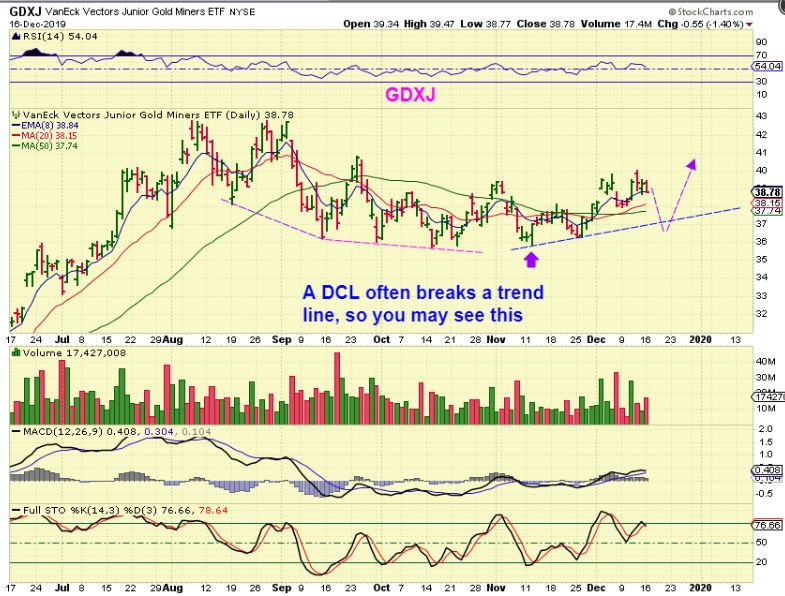
GDXJ – FINALLY – Could we see this? Yes, this may be what the next dcl looks like, but there are no guarantees when we get surprises to the upside. You may simply want to buy the dip if this happens, or add on a break higher because it shows strength late in a daily cycle.
.
I will show a few trade ideas below. Enjoy your Tuesday trading!
.
~ALEX
.
STILL WATCHING MJ STOCKS.
.
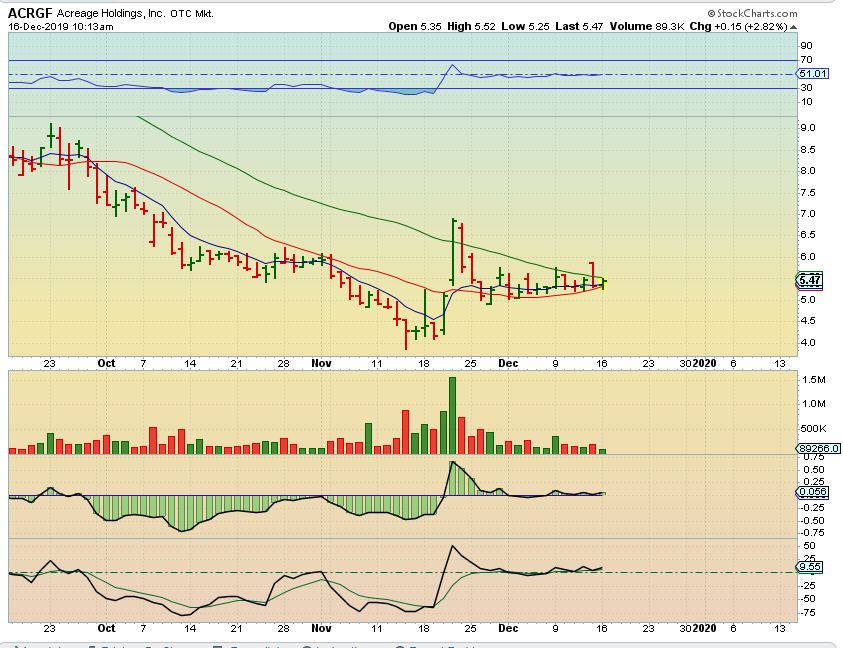
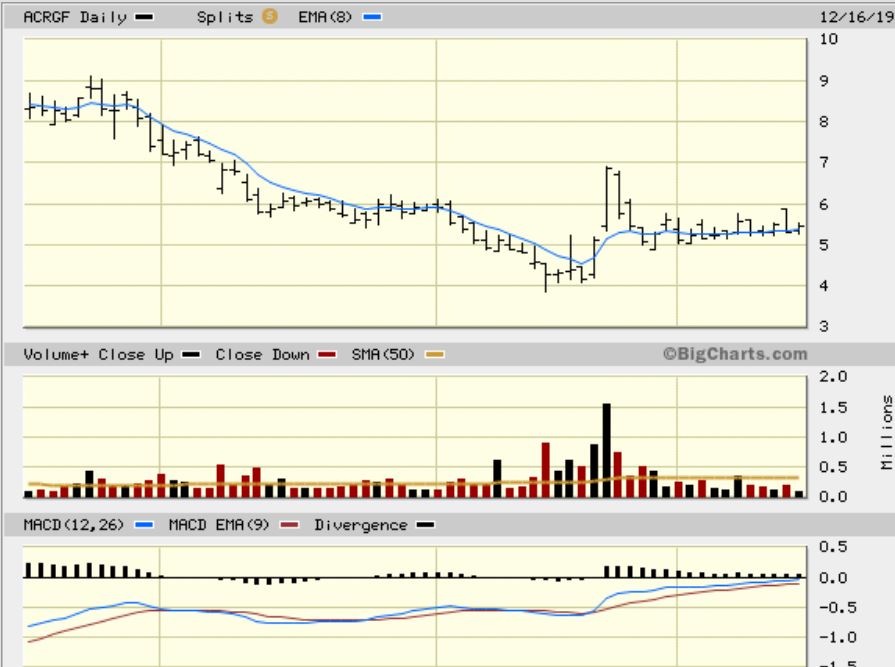
ACRGF – I posted this in the morning 1/2 hr into trading. Volume was increasing for 1/2 hr of trading, it held the 20sma ( red line) and this is what I was hoping we would see in some of these MJ Stocks after that initial Pop. This could lead to follow through, so it was a buy here. It traded $5.25 to $5.47, but these can really move quickly. Look for a break above the 50 sma as a buy too…
.
ACRGF -This shot at 10:30 a.. also shows the MACD rising while price went sideways.
.
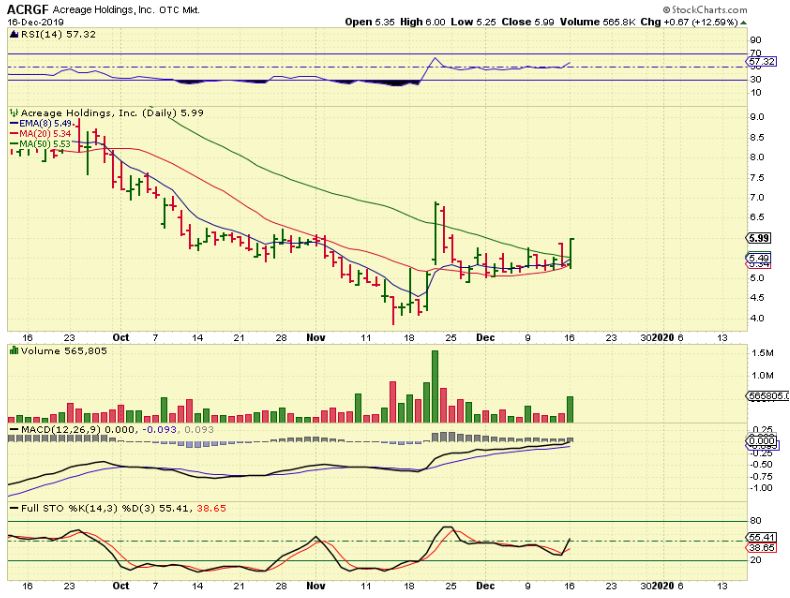
ACRGF AT THE CLOSE – ACRGF closed up about 12.6% at $6! It is above that 50 sma and this looks very promising.
.
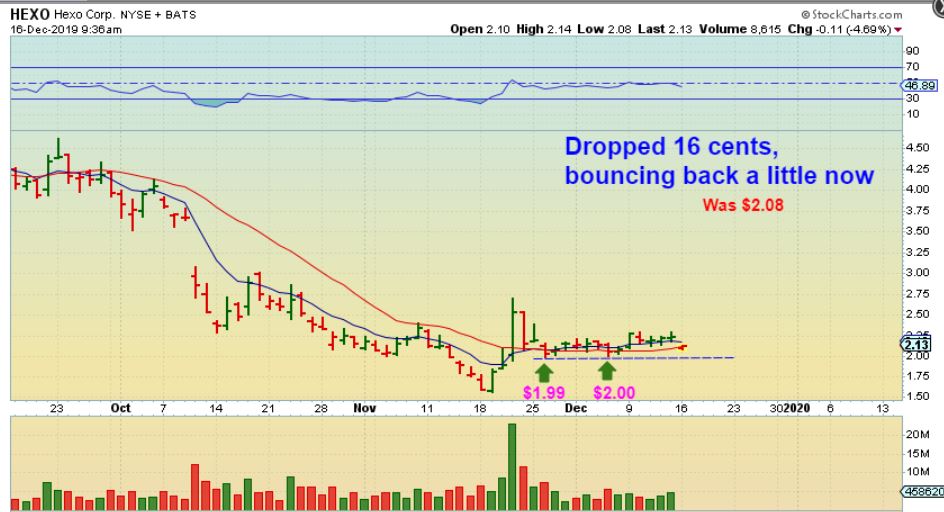
HEXO – HEXO released earnings and dropped, but I captured this 6 minutes into trading to show what I am looking at. The red line was the 20 sma. I’d like to see that hold, and was also watching the last 2 lows of this consolidation ( $1.99 & $2.00). At this point, the low of the day was $2.08.
.
.
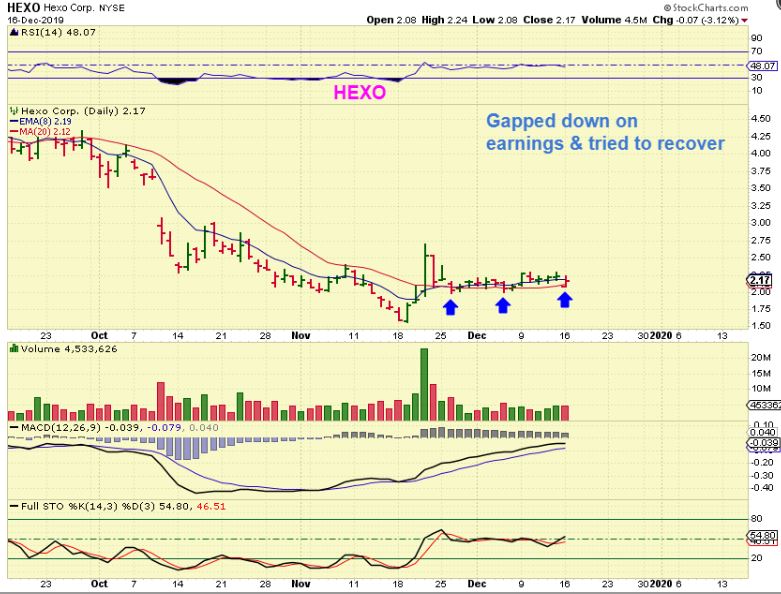
HEXO – That $2.08 low was never taken out again, so at this point we may have a reversal for HEXO and earnings are now behind us.
.
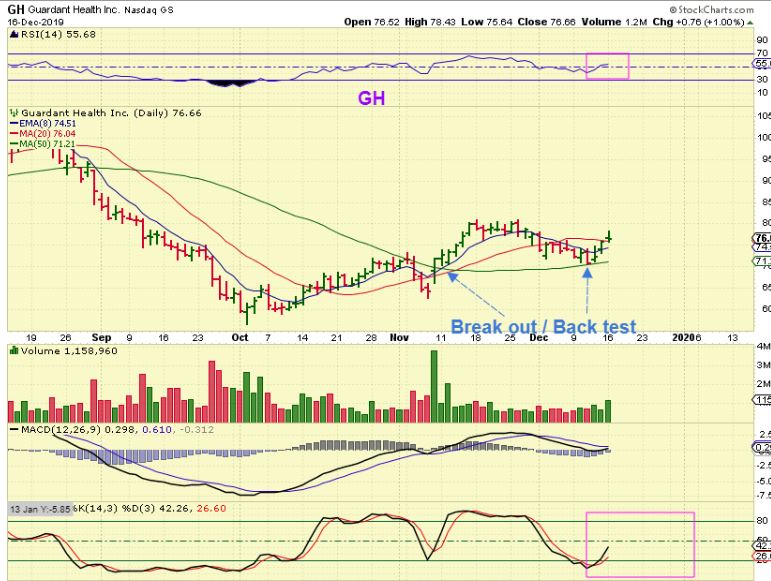
GH – This is a Biotech Stock that I mentioned last week as it approached the 50 sma. That was a nice reversal/ bounce off of the 50 . This traded above $100 in August and it can be considered a lower risk buy with a stop at the 50 sma.
.
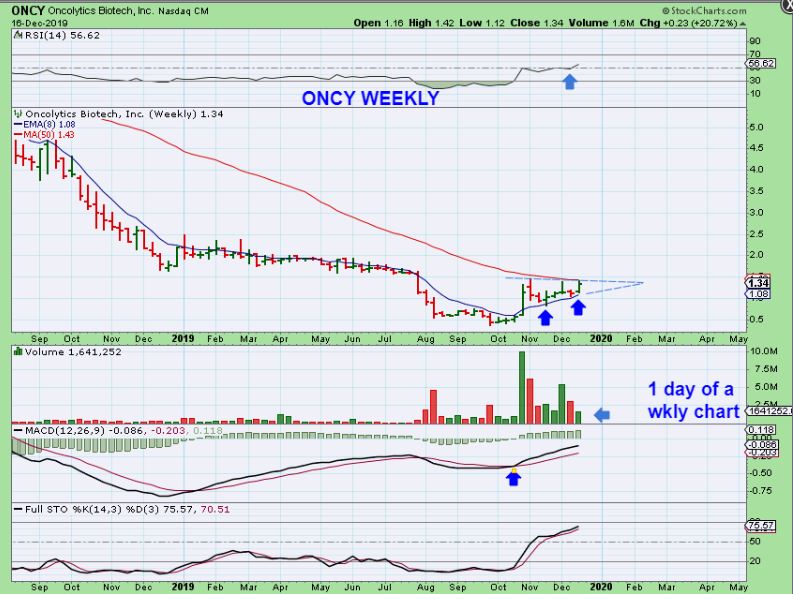
ONCY WEEKLY – This was on my watch list, but it popped 20% yesterday. Well, if ONCY pulls back, it could be a nice one to own, since this weekly chart has very good potential. It looks like it is preparing to break out & run higher over time.
.
STILL WATCHING SEMICONDUCTORS & TECH
.
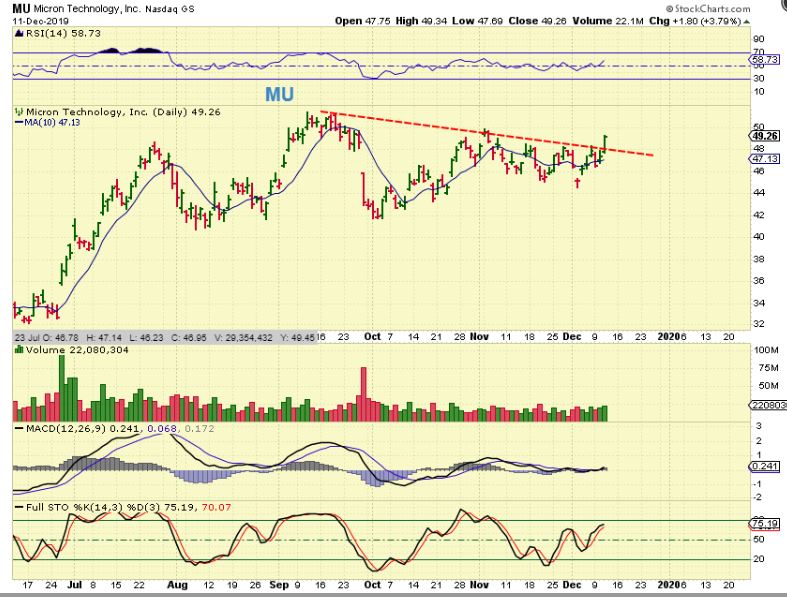
MU – MU, TSEM, & AMD were buys earlier in December. MU was an abandoned baby low and as it broke the down trend, so I posted this chart on Dec 11. IF YOU TOOK THAT TRADE…
.
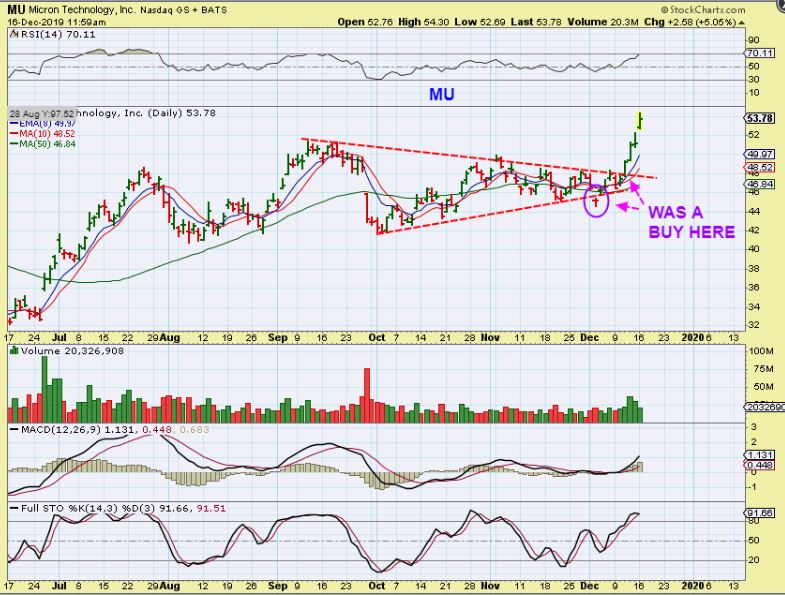
MU – The trade has played out well for MU, TSEM, & AMD, they are actually running well, but MU has earnings on Wednesday. Now you’d want to decide if you want to sell it all before earnings? Or maybe sell a partial like 30% and let the rest ride.
STILL WATCHING THE ENERGY SECTOR
.
WPX – An Energy Stock. Oooh, Big Down grade, and a Price target cut to $12 yesterday pre-market, as seen here. This ought to kill the stock…
.
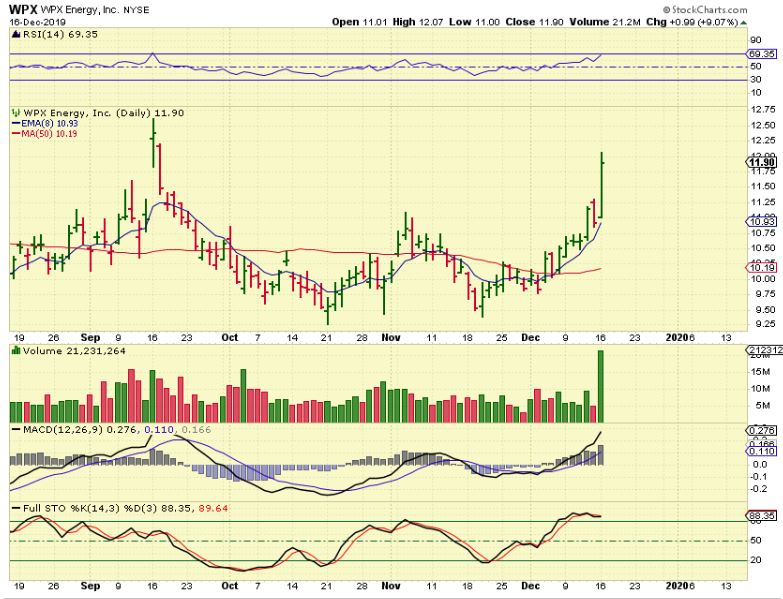
WPX – Hmmm, Popped about 10% to the price target of $12. Well, I bet they’ll be raising that price target & remove that down grade soon, because …
.
WPX– This has now made a nice break out on the long term charts. I think they downgraded it to try to get a price drop & Buy it =)
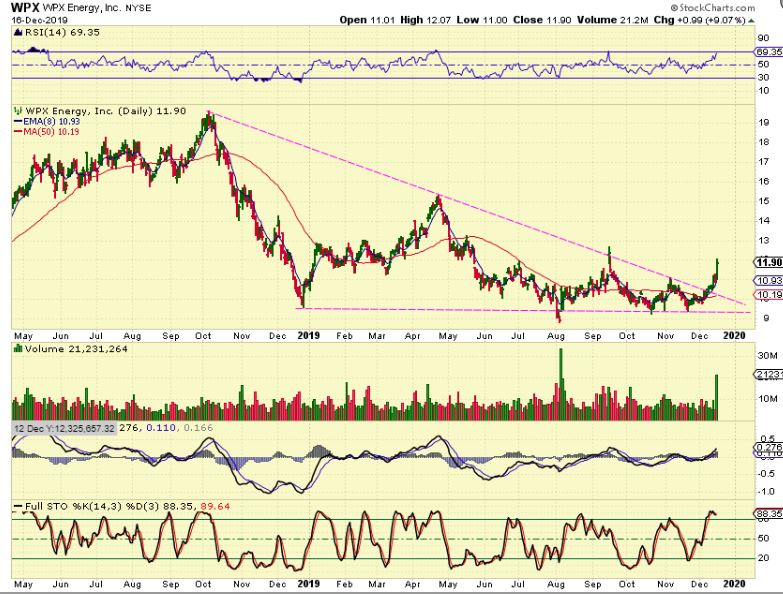
With This sector I mentioned that XOP looked good ( GUSH, ERX) & also DNR, OAS, LPI, WTI, WLL, AXAS, BTE, MRO, VAL, APY, etc etc could be considered . Let’s look at this sector again.
.
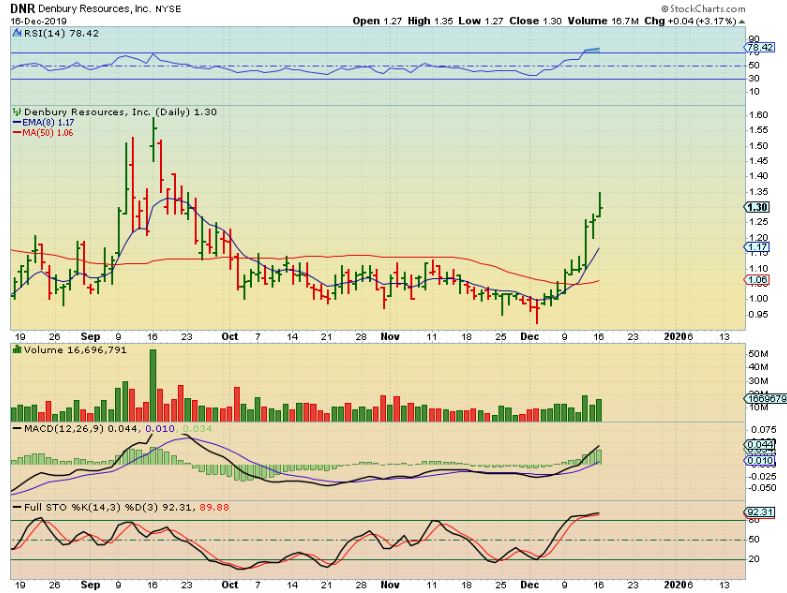
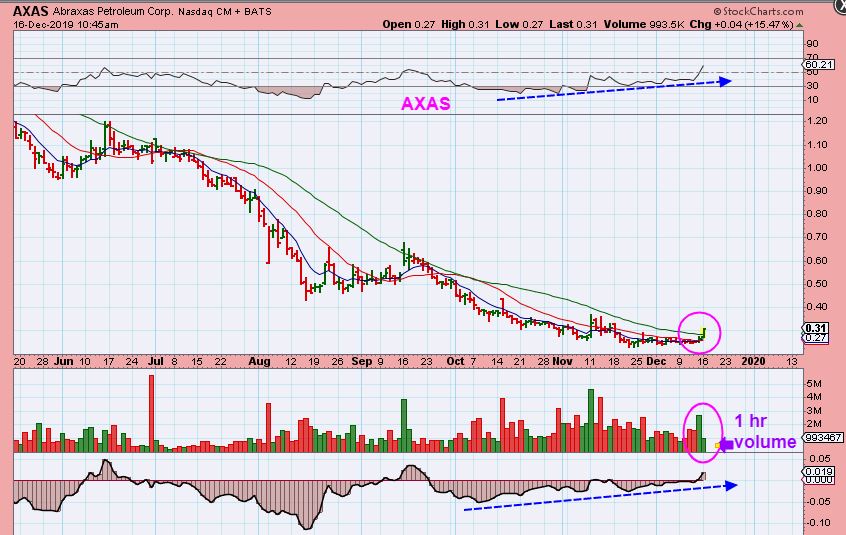
DNR – So several of the Oil / Energy stocks mentioned in prior reports are just running higher. They bounce off of the 8 ema or 10sma and keep running, so what to do next? Wait for a pull back, eventually we will see one, OR I mentioned that you could buy Laggers or ones that are not as extended. I even said that AXAS was one that looked good as a tight base…
.
AXAS – AXAS popped 15%, so the sector is heating up. Let’s take a look at a few that can still be considered buys.
.
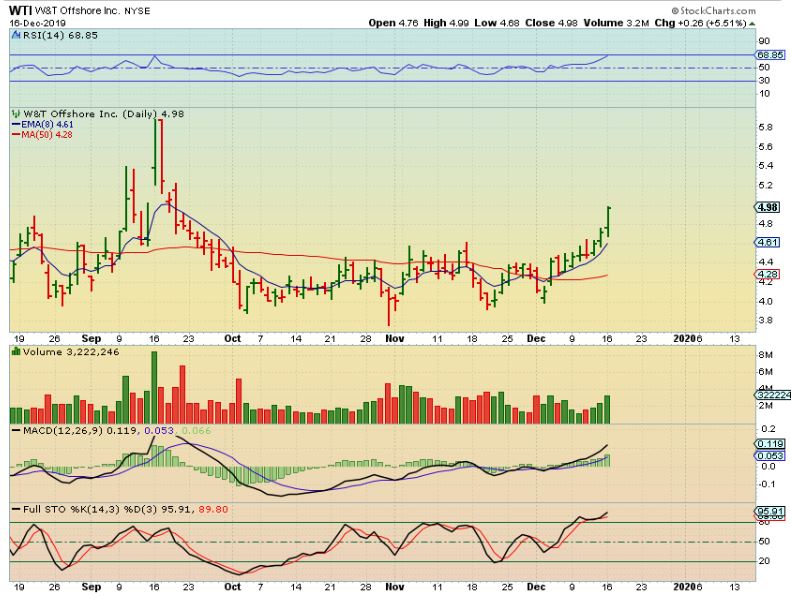
WTI – WTI was also slowly climbing higher, but now looks possibly too extended to jump in with good risk reward ( A pullback could be painful). A back test of the 50 sma may offer an entry later.
.
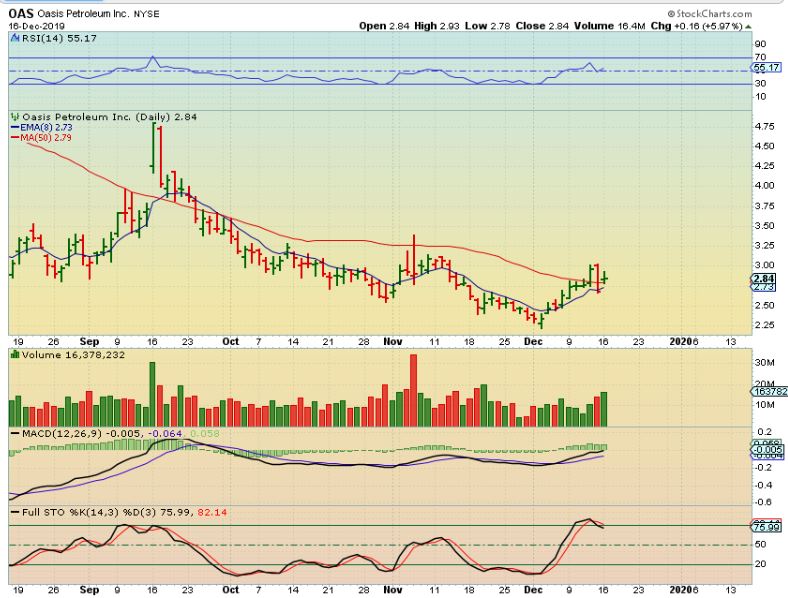
OAS – OAS is NOT extended. This could be bought, since it is right at the 50 sma area.
.
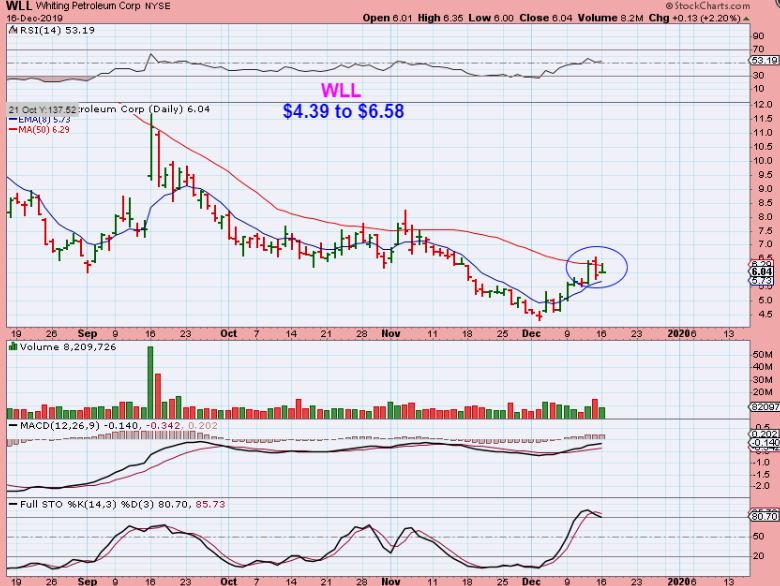
WLL – WLL is also climbing up the 8 ema, and stalled at the 50 sma, so this would be a good entry too. I know they show up as overbought on the stochastics, but this can continue. This can still run like we see with DNR & WTI charts above.
.
,]
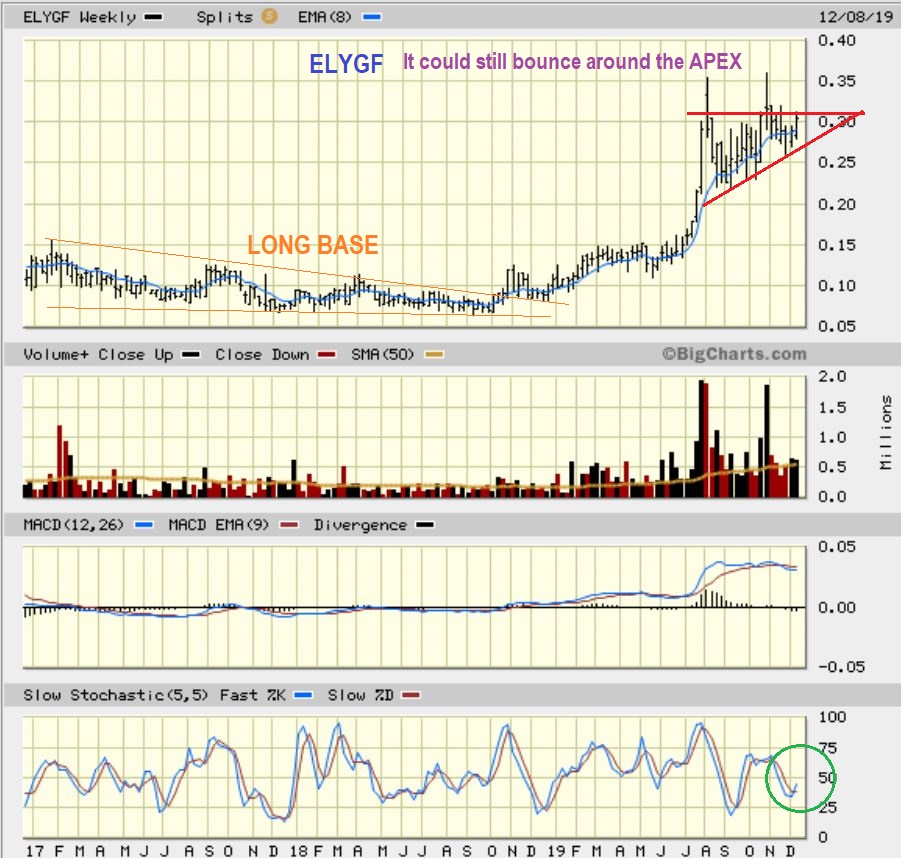
ELYGF WEEKLY – BY REQUEST: I own this and have mentioned that in the Live area, but I never really mentioned it as a ‘buy’ before because it had low volume on the daily charts when I entered it. For me it is a BUY & HOLD through the bull market run, but I was asked why I never mention it in the reports if I own it.
OK, Now that the weekly has this flat topped wedge, I will mention it. This CAN BREAK OUT & RUN, BUT IT ALSO CAN DROP & BOUNCE AROUND the Apex for a bit longer. So this is ELYGF, it is a BUY & HOLD for me, I’m not trading it. USe a 10 year chart and the upside potential is obvious.
.
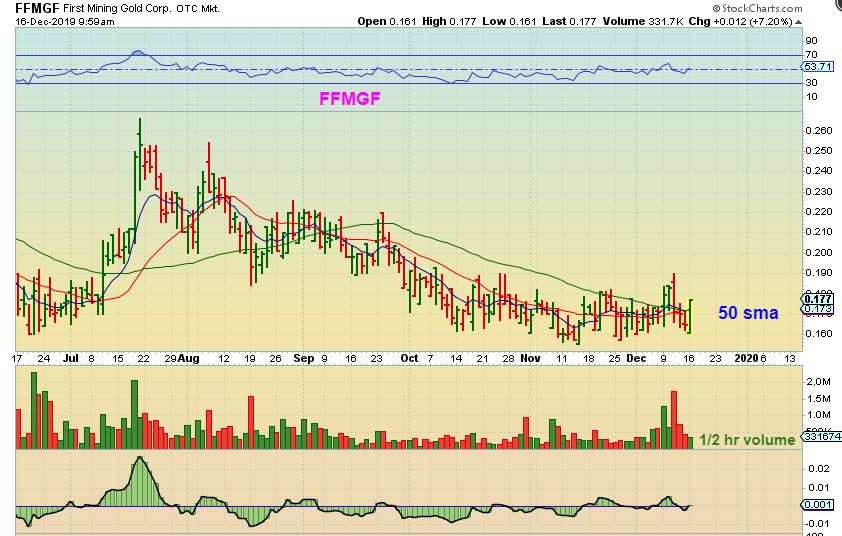
FFMGF – First Mining Popped above the 50 sma yesterday, so I posted this after the first 1/2 hr of trading. It closed here with almost 1 million in volume, so this may be ready to run. You can buy it in this base or put it on a watch list.
.
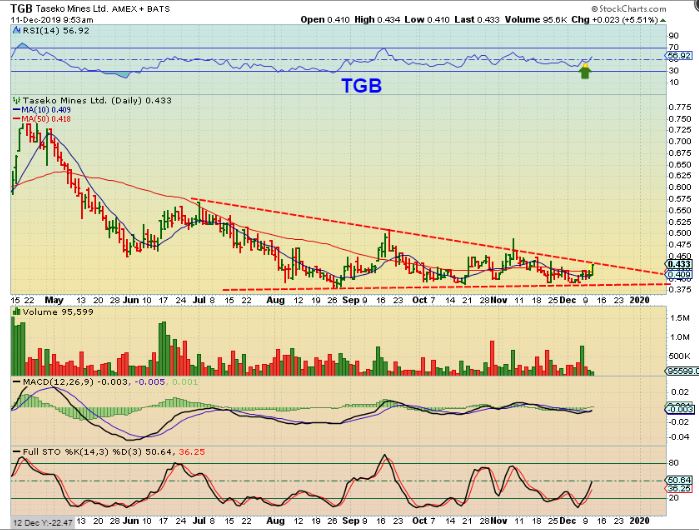
TGB – I posted this as a buy last week, or buy it when it breaks out above $0.43
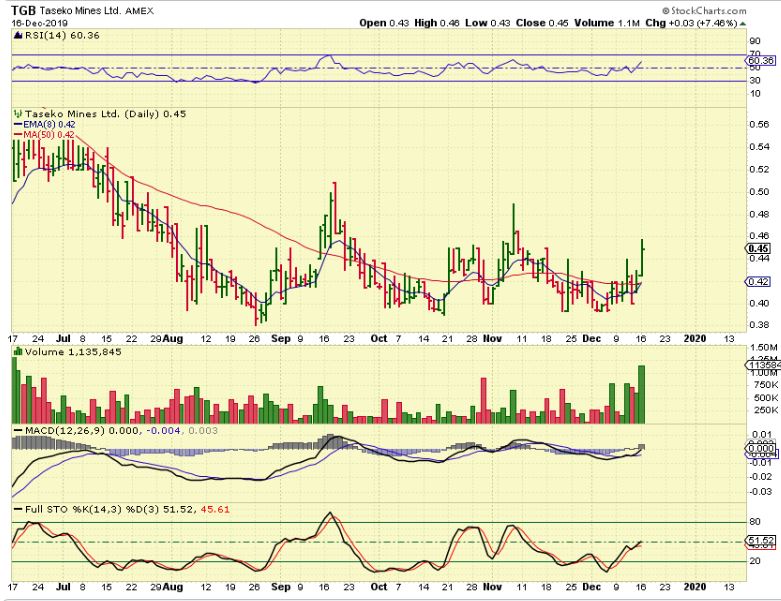
TGB – Yesterday it pushed higher again with even more volume, so I consider this a buy ( Copper, Steel, & other metals stocks are doing well). HBM, FCX, WRN, SCCO are other copper stocks. FCX & SCCO have been running strong, so these may be next…
WRN – WRN popped another 10% Monday and…
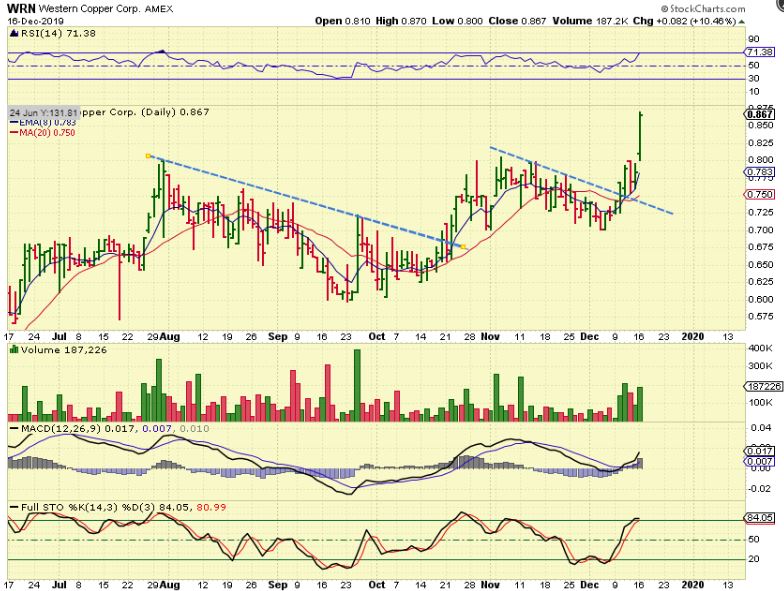
.
WRN – One of our readers Ray sent me a longer term chart last week. It was drawn something like this, I hope you own this Ray 🙂
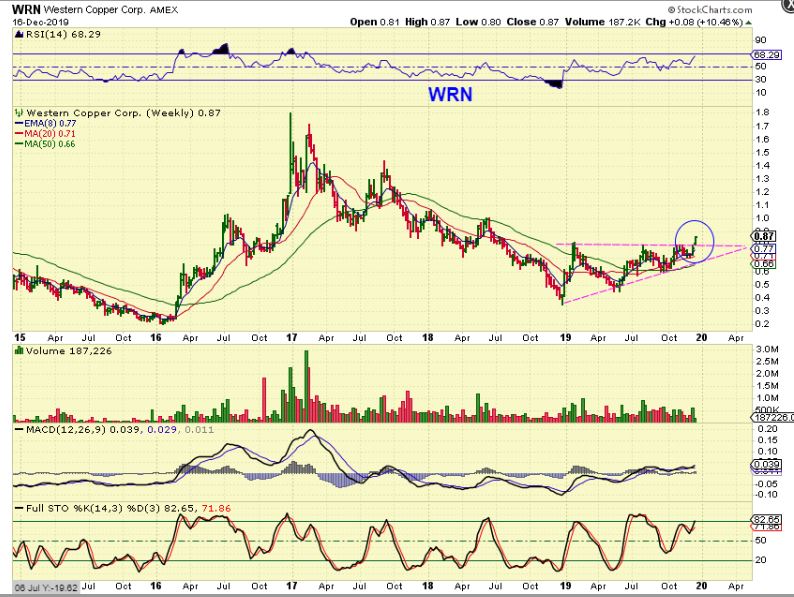
.

