
November 16th – Weekend Review
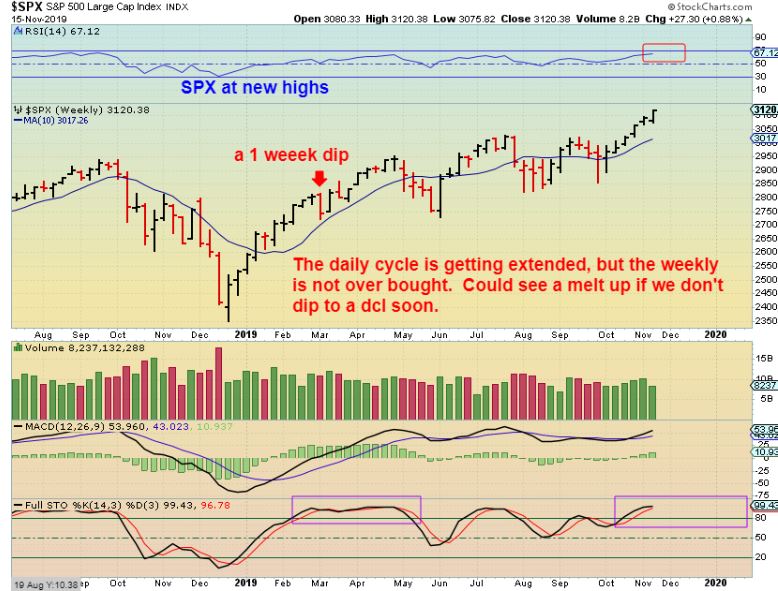
SPX WEEKLY – This was another week where the General Markets have closed at the highs. Keeping a stop under the 10 sma has been working out nicely to keep traders in long positions. Even though I do expect a pull back into a dcl sooner than later, if this just continues to ‘melt up’, you will remain in the trade with a stop under that 10sma on a daily chart. Please read the chart.
.
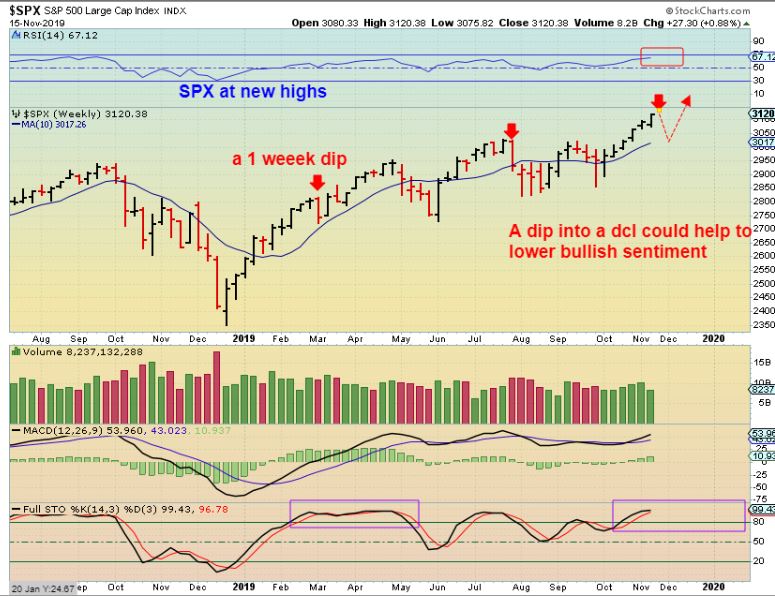
SPX WEEKLY – So I do still expect a dip into a dcl, but it may just be a back test followed by another rally higher from there. We’ll take that step by step in the daily reports once it takes place. For now it has remained ‘long & strong’.
,
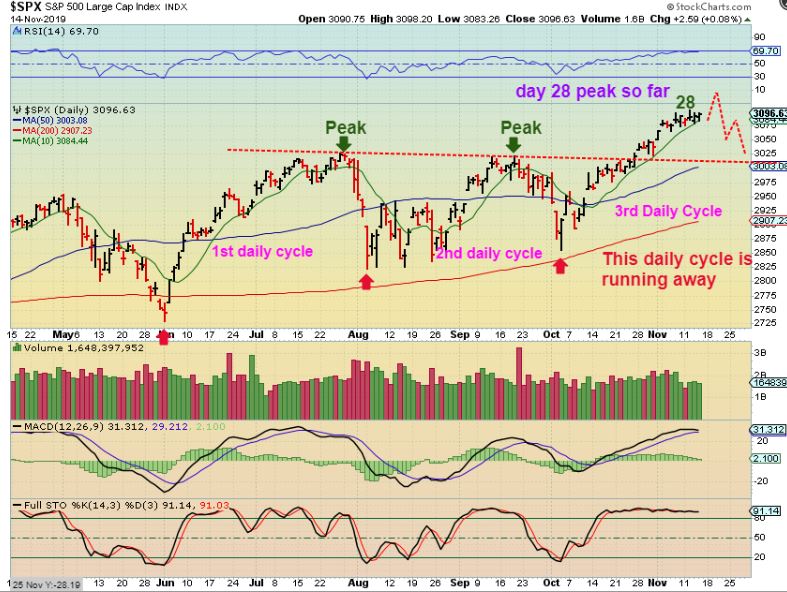
Reminder from Fridays report : The SPX has been running strong, I have recommended a stop under the 10sma since it is getting late in the daily cycle.
I do expect a dip soon into a dcl (daily Cycle low), because we are now on day 31, but that dip may just be a back test , as shown here.
.
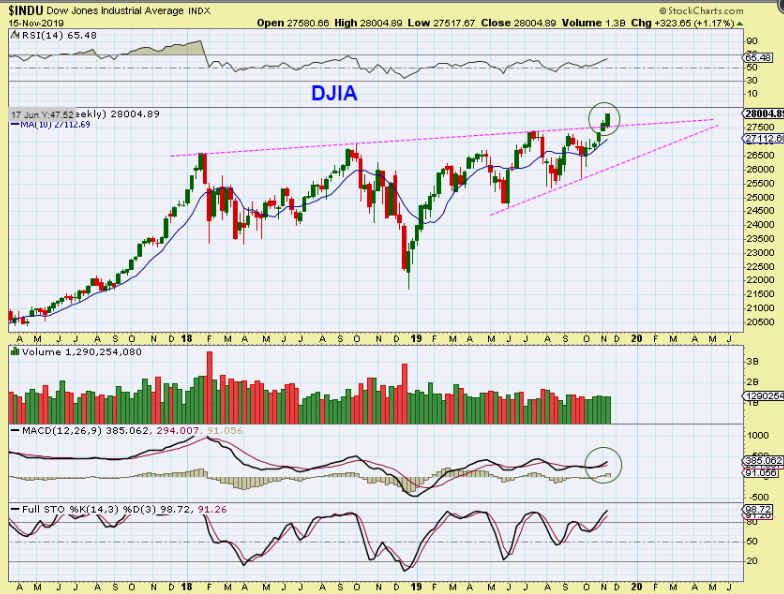
DJIA WEEKLY – The DJIA is also breaking out to all time highs after a multi year consolidation. At this point, it is considered Bullish longer term until something changes.
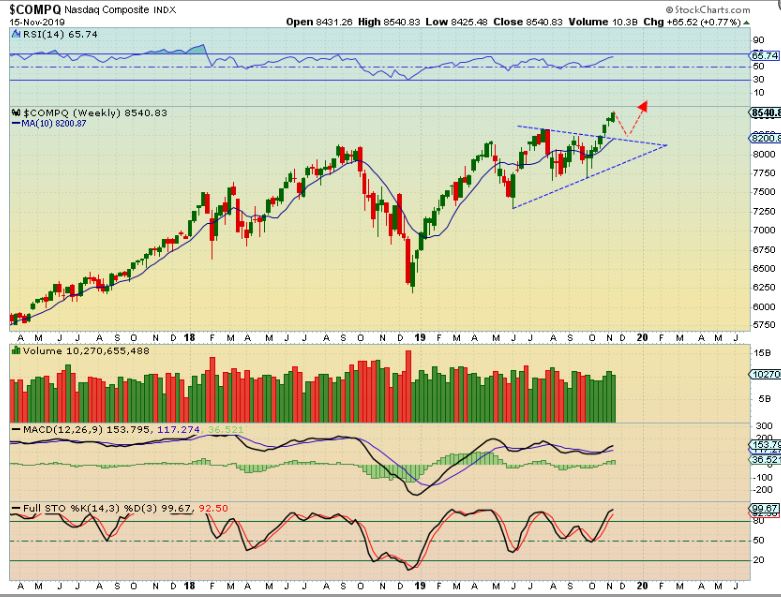
NASDAQ WEEKLY – Another area that has hit new highs. The set up is Bullish , even if we get a dip & a reversal as shown.
.
.
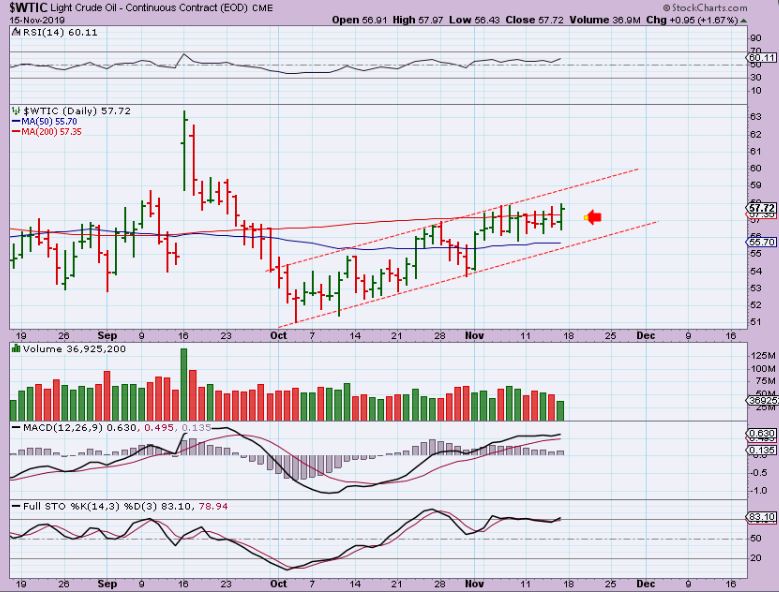
WTIC DAILY – Oil closed above the 200sma, so that could be short term bullish if it can get some follow through next week. Oil has been choppy for months though.
.
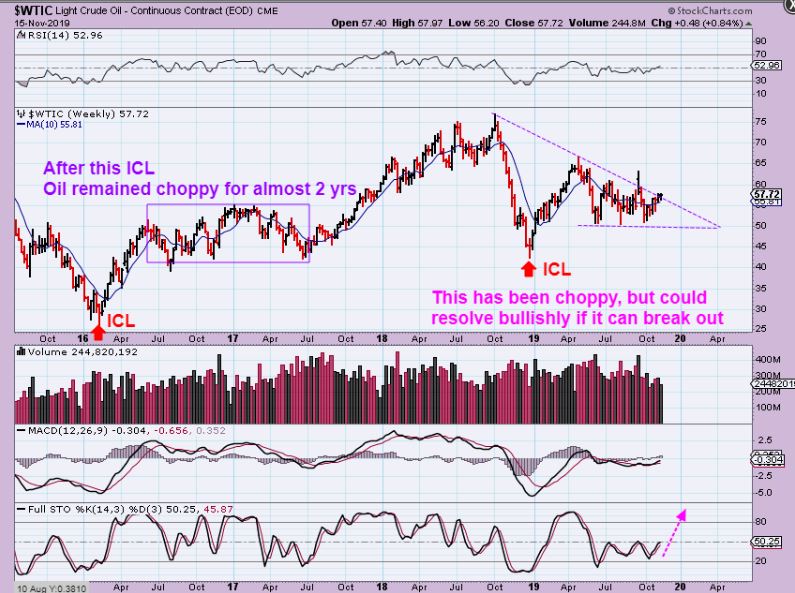
WTIC WEEKLY – Oil has been choppy all year after emerging from an ICL low. I have pointed out how we actually have seen that in the past, This choppiness CAN continue sideways, or it could break from the triangle, but we are getting later in the intermediate cycle and a strong run higher becomes less likely over time. We will keep an eye on it. Please read the chart.
.
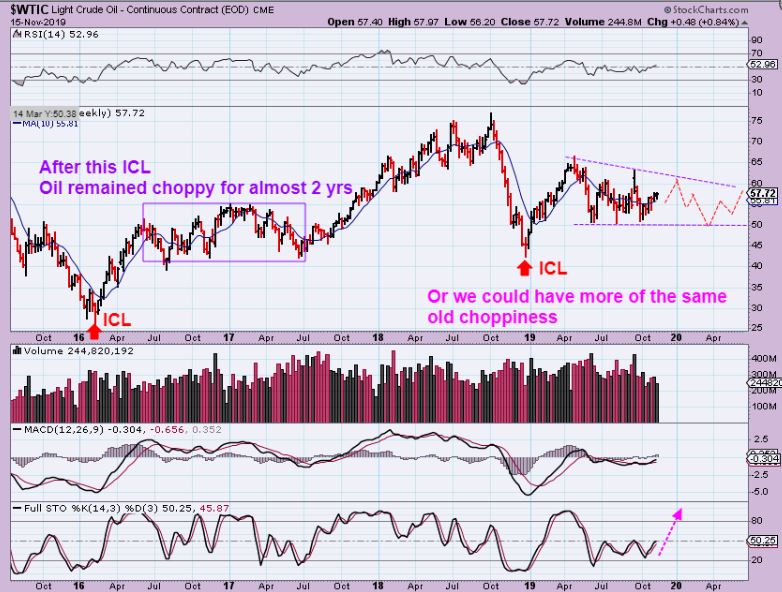
WTIC WEEKLY – If Oil doesn’t break out soon, we could also just continue to be stuck in this trading range. This seems quite likely at this point until we reach time for another ICL dip.
.
.
USD DAILY – The USD started to drop & lost the 50sma Friday. This could be good news for the Precious Metals sector. It is overbought and can sell off for a while. If this sells below the Green arrow, it could be in trouble. Let’s see the weekly chart…
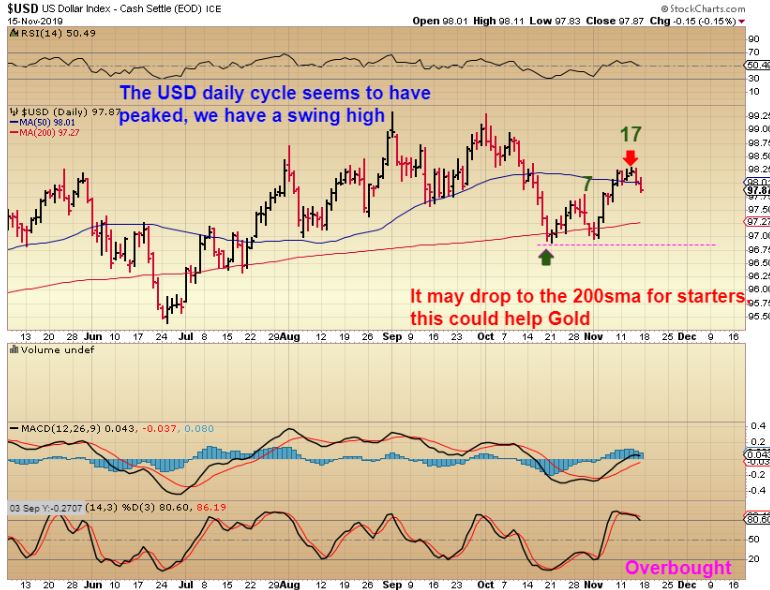
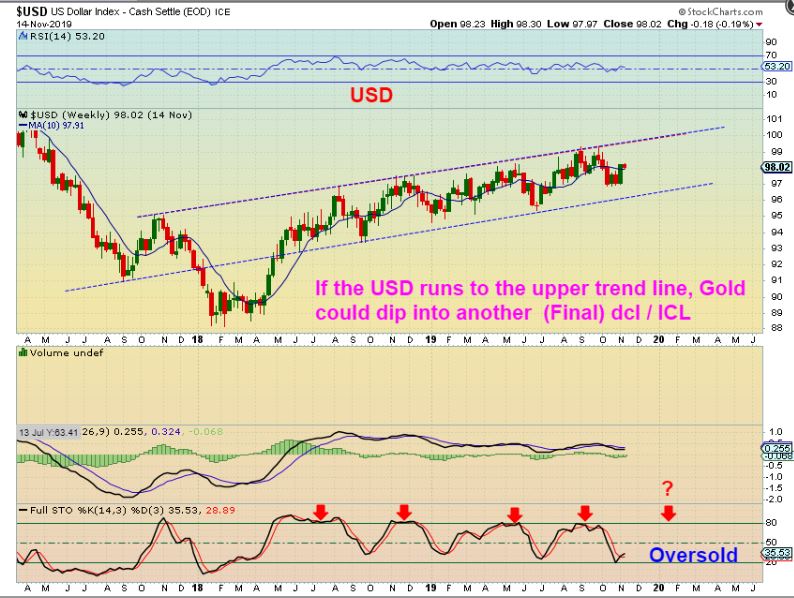
USD WEEKLY – The USD is in the middle of its trading range as it turned down. The daily cycle looks to have topped on day 17 Wednesday , as seen in the chart above. If the USD is now going to drop from here, Gold can rally from here. 😉
.
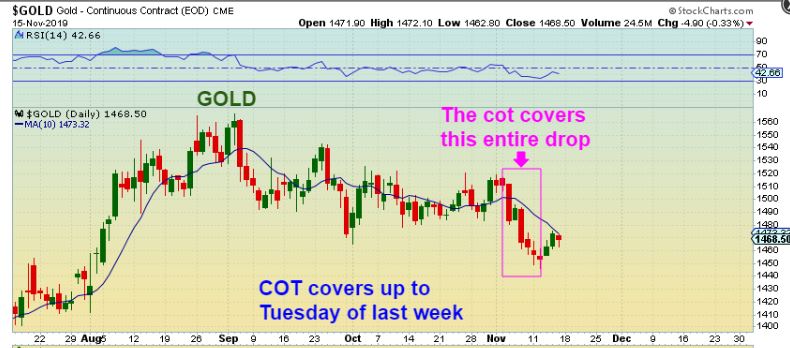
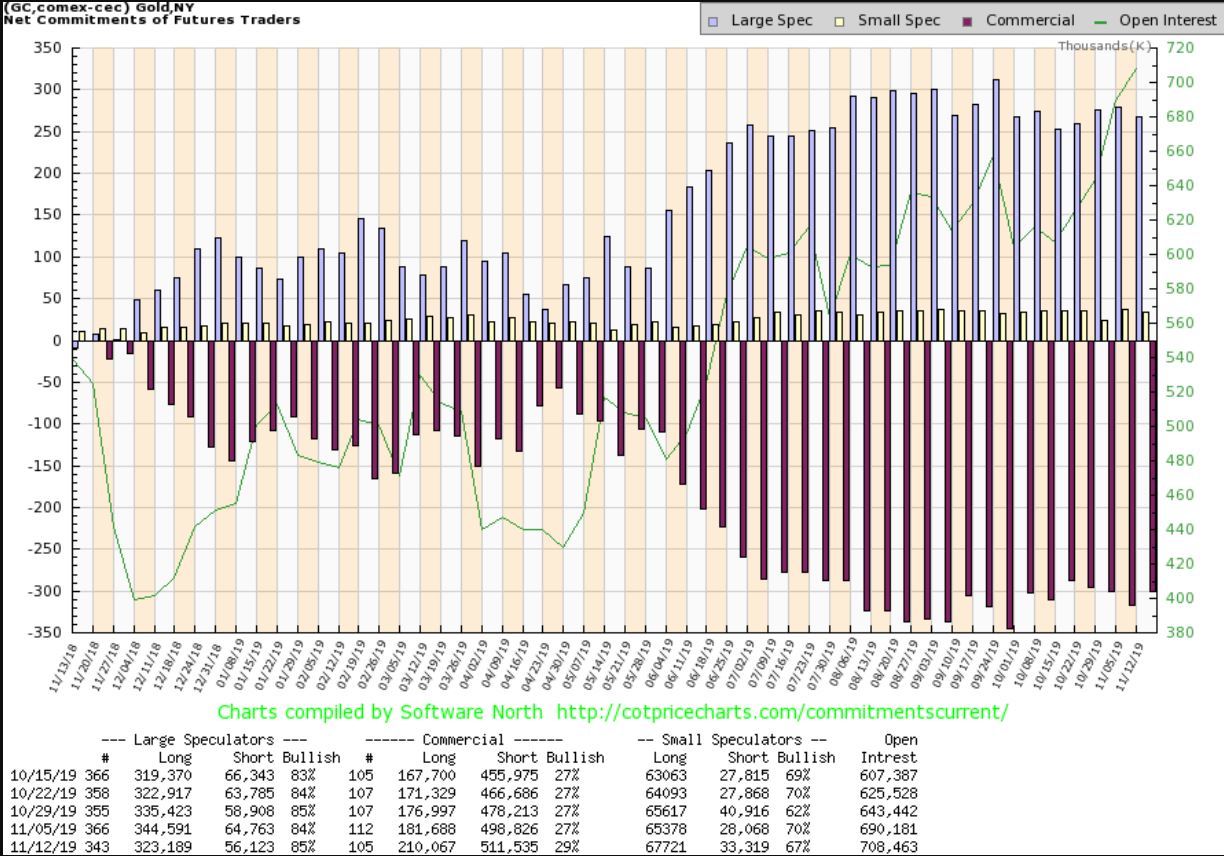
GOLD COT – This Fridays GOLD COT Chart covers this drop in Gold in the Magenta Box. I would have expected a fairly good size drop in Commercial shorts & retail Longs, but…
.
GOLD COT – The Commercial shorts hardly dropped their short count & retail remains long. It is lower than the peak about 8 weeks ago, but is it DCL/ICL levels? That is tough to say. We see overall progress, but they are not dropping fast and Gold moved higher at the end of the week.
.
.
GOLD DAILY– I wanted to use the daily chart to point 2 things out.
1. We did not close above the 10sma, so it is not a confirmed swing low yet.
2. I did just show you that the USD topped on Wednesday & dropped on Thursday & Friday producing a swing high. Well GOLD reversed too, and moved higher so we have an unconfirmed swing low with the USD possibly ready to drop further.
.
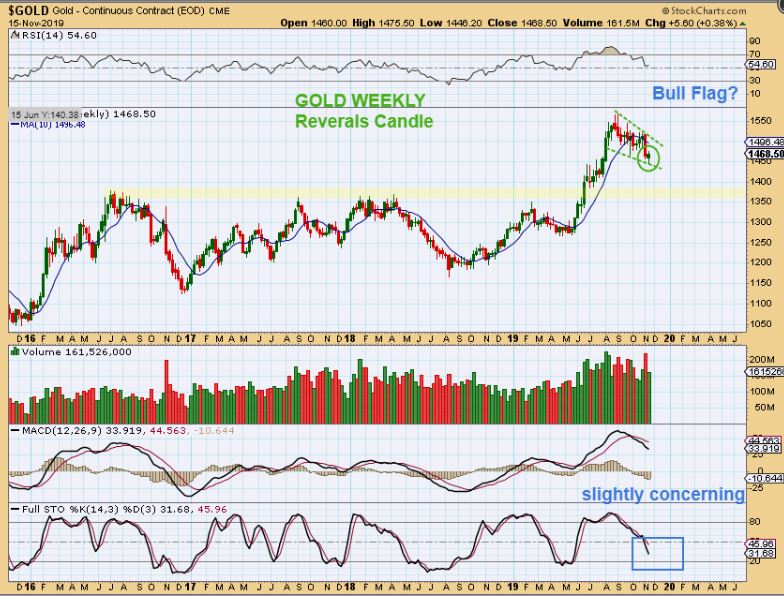
GOLD WEEKLY #1 – We have a weekly reversal candle, which is a buy as a dcl (with a stop). This looks like a Bull Flag, but originally I expected a possible drop to back test this break out ( Yellow area).
.
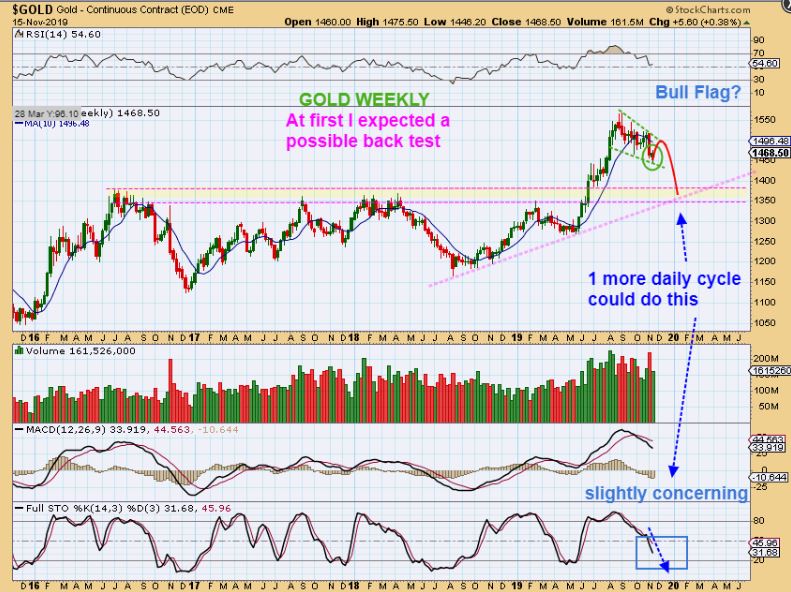
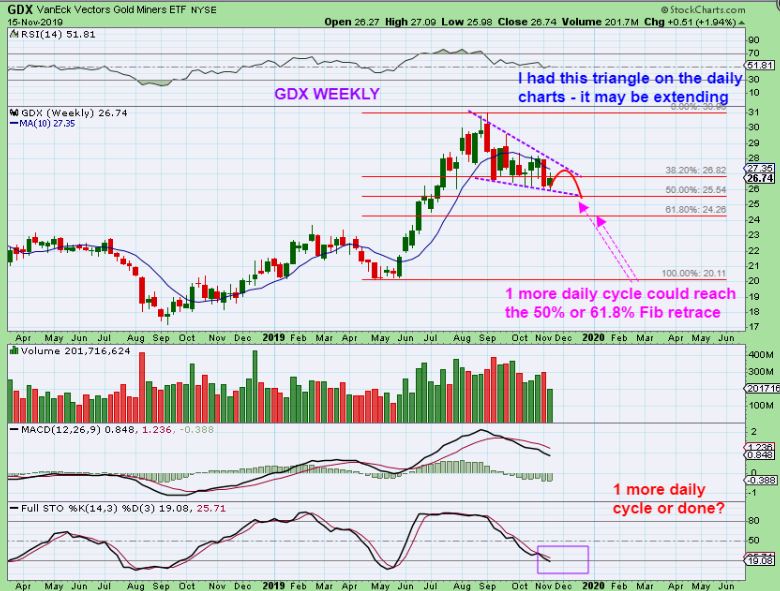
GOLD WEEKLY #2 – So I was expecting a deeper drop, but so far that hasn’t happened and time may be running out for the Intermediate Cycle. 6 Months from ICL to ICL is common. We could get one more Daily cycle lower (lasts about a month), since the weekly Stochastics is not oversold, and it could even look like this if it rolls over. This is why we buy the reversal with a stop.
.
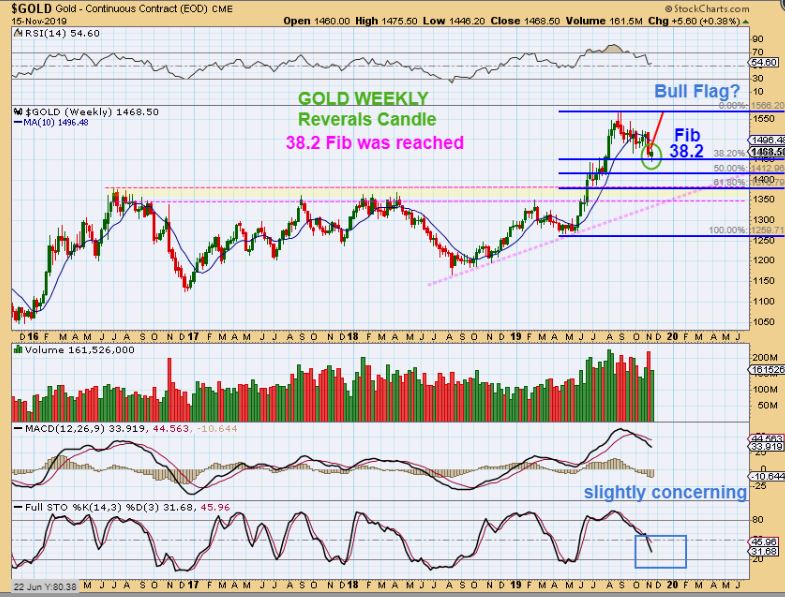
GOLD WEEKLY #3 – We have reached the 38.2 Fib with our reversal candle, indicating that this COULD be the lows before the next rally. That is again why this reversal becomes a buy, and then you have to watch how it acts from here with a stop.
.
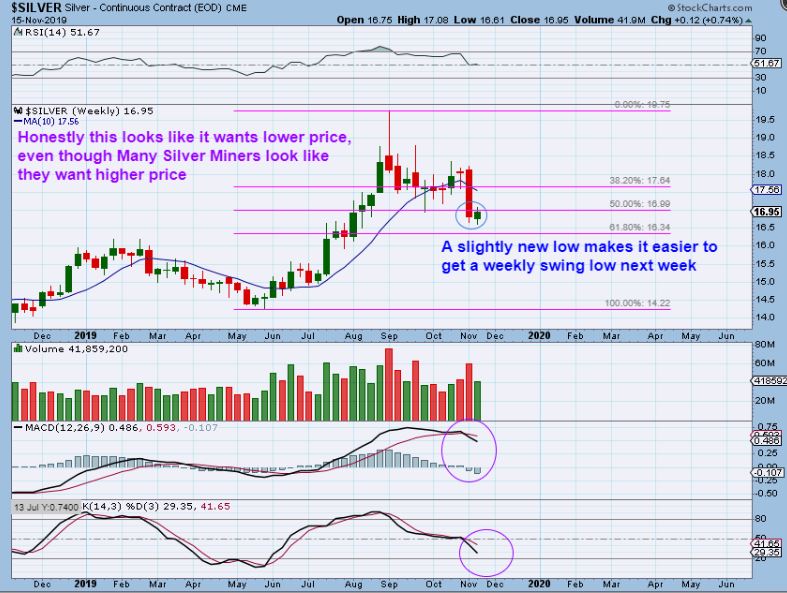
SILVER WEEKLY – I love the Silver stocks, but I just don’t like the SILVER chart. Why not? This is not oversold, The MACD is crossing down, and just look at that sudden sharp drop 2 weeks ago. That drop actually happened when the chart looked bullish, so that tells me that it could happen again .
Right now however, We have a small trading week reversal. We are also just below a 50% drop and we have a small candle that eases the parameters for a swing low to form next week. A good push higher from here would be a more bullish looking chart- so we’ll watch for price to start pushing above this weeks highs ( $17.08).
.
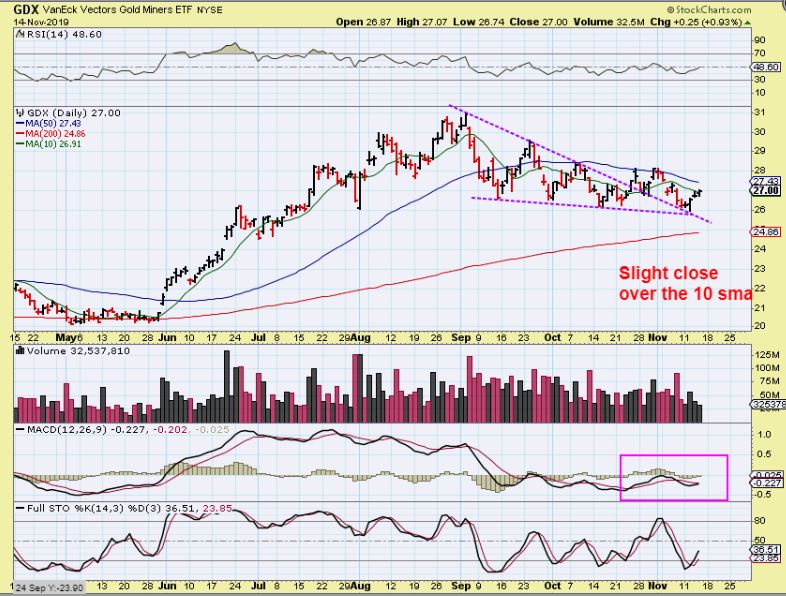
GDX – On a daily chart, I drew this like a triangle break out & back test. We really want to see some follow through above that 50 sma to get comfortable being long. The Daily Triangle here looks different on a weekly chart, so I need to be open to the idea that 1 more daily cycle would make the weekly triangle look better. Let me show you…
.
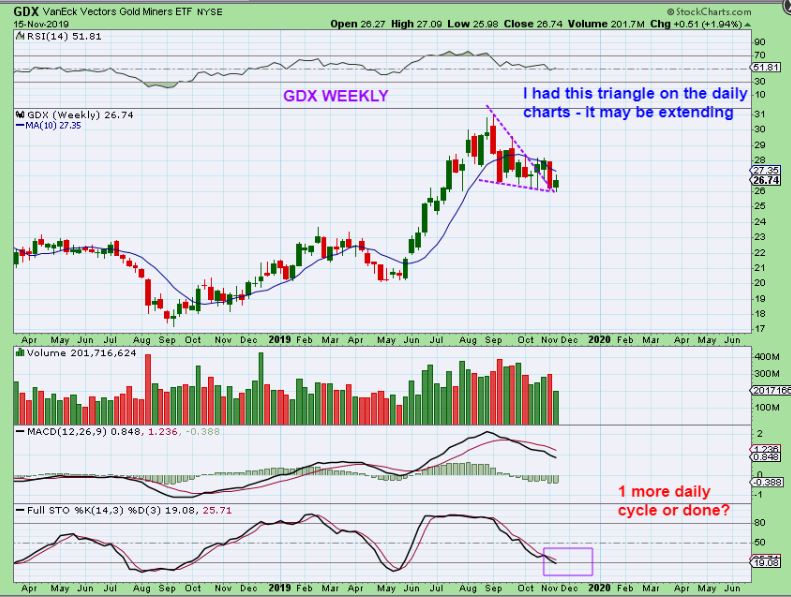
GDX WEEKLY – That daily triangle looks good, but now looks a bit cramped on this weekly chart, right? Let me show you another view that would extend the weekly triangle…
.
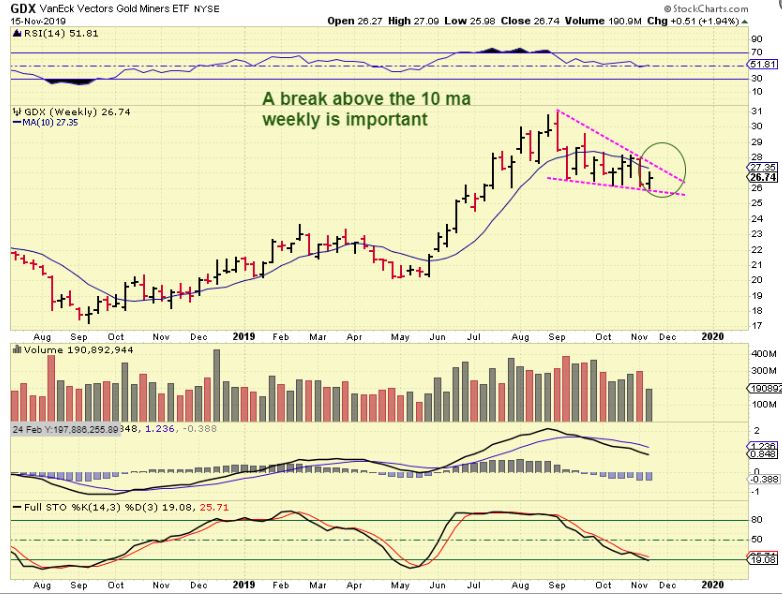
GDX WEEKLY – Extending the upper trend line makes the weekly triangle look a bit better, but now it has not broken out from the triangle like we saw on a daily chart. We still have a nice reversal this week, and this can still break out bullishly, so next week will be important for Miners. A break above that 10 week MA & top trend line would look very bullish to me. I will discuss that further in the weekday reports if we move higher.
.
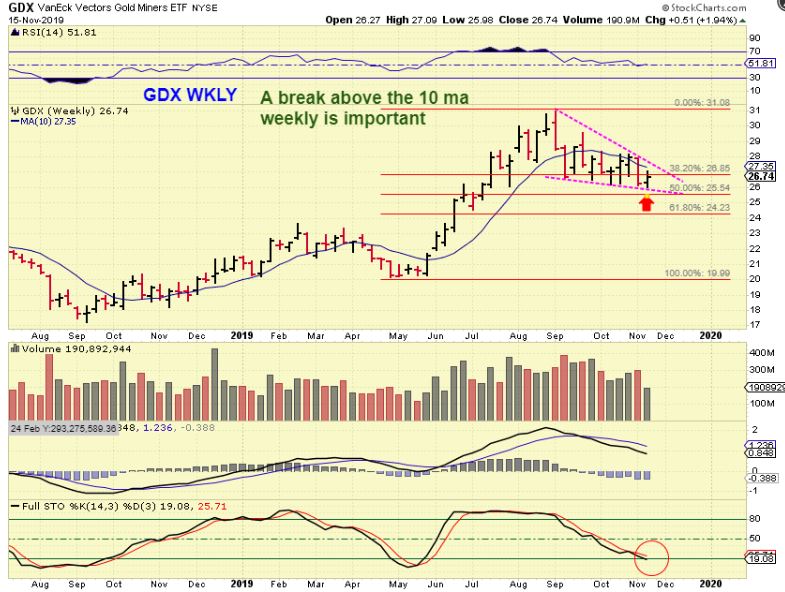
GDX WEEKLY – Adding fib retracement numbers, GDX almost tagged 50% and that is a normal bullish pull back too. So with this bullish view and a weekly reversal low, we wait for follow through next week. While we wait, I’m sorry but I also need to show the short term bearish view…
.
GDX WEEKLY – A daily cycle that run up and rolls over as left translated would be another daily cycle. It can last about 30 days. That could drop to that 50% area or even the 61.8% Fib as drawn here. As mentioned above, a break above that 10 week MA above & trend line is important for the bulls.
.
FRIENDLY REMINDER: DO NOT SHORT THE BULL MOVE IN THE GENERAL MARKETS AT THE HIGHS. If someone is wanting to short the markets, at least wait for a break down below the 10sma as a sign that the run could be ending. The General Markets have gained traction and continue higher with Fed Juice (Rate cuts). Even though I have been expecting a dcl after the break out (Back-test), I have been saying that these markets can just continue higher too, after the FED Rate Cuts added spark to the markets.
Someone wrote to me saying that they… “Shorted this market 3 times recently, why isn’t it just rolling over and dying? Fundamentals are horrible in my opinion, it should break down?” I think that we have all seen horrible stocks run away higher, and maybe what looked like a solid company sell off for apparently no reason. The charts for the general Markets are breaking to new highs and staying above the 10sma, and that is bullish right now.
Let me point out something that I have already pointed out over the past 2 months…
.
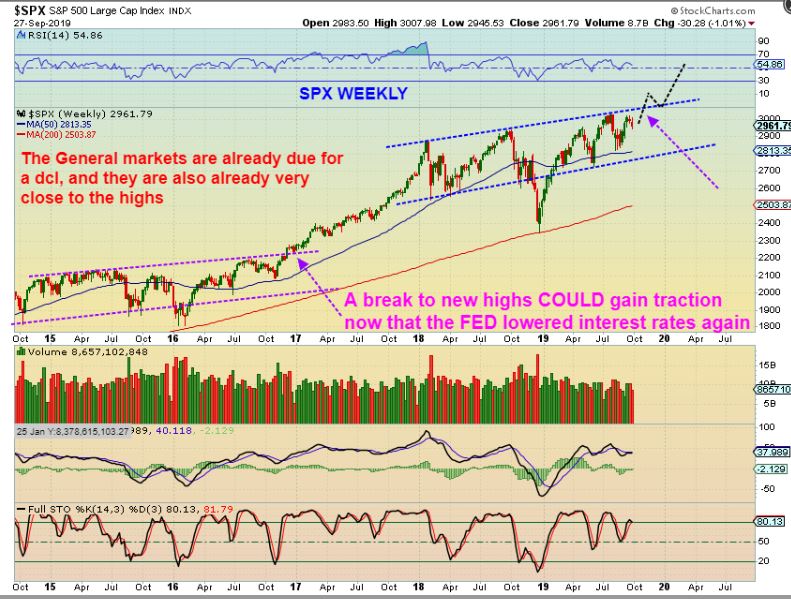
This was the SPX IN SEPTEMBER, read what I wrote & pointed to in Magenta on the chart. I have been saying to be long these markets with stops under the 50sma, then I moved them up to the 20sma, and now the 10 sma as the daily cycle gets older, but I would not short this without signs of a break down first, because …
.
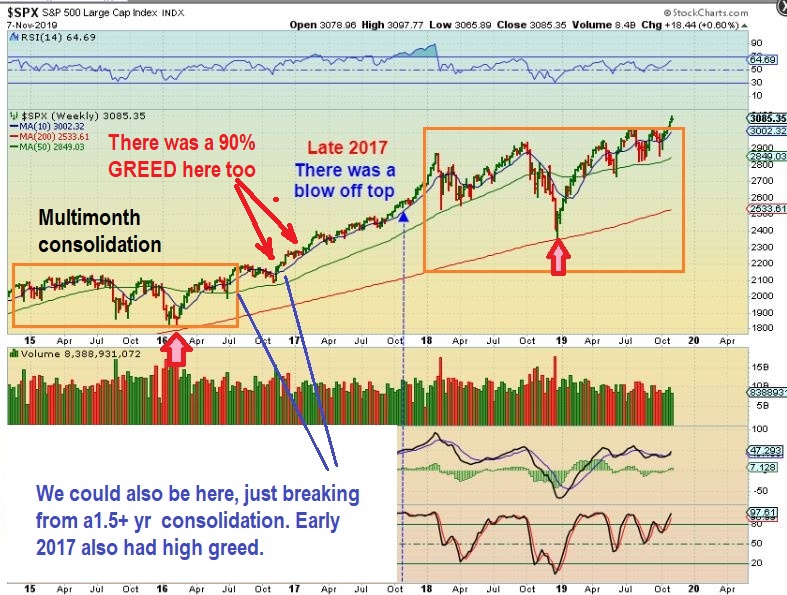
I would not short this, because as I pointed out on this Nov 7th chart, We are leaving a multi-month consolidation. Greed was above 90% on November 7, people started to short based on the greed factor. I pointed out that I have seen Greed at 90+% in similar areas and the rally actually accelerated. It was like they were melting up, and DCL (daily Cycle Lows) were shallow sideways pauses. Why? It could be that People were shorting it, and shorts were covering as buyers were buying it- both sides pushing it higher. That is how markets can melt up.
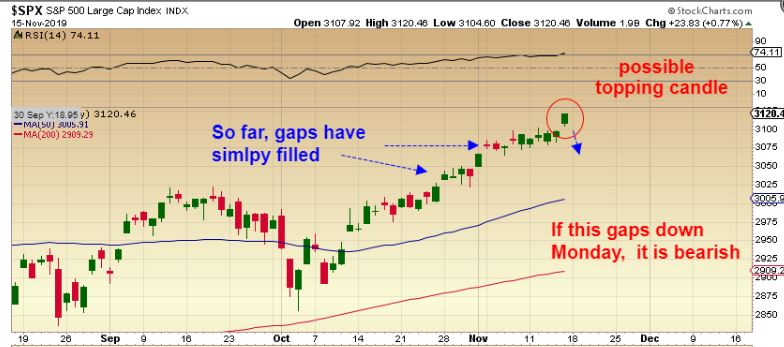
I will add this though. If the markets gap down and leave this candle like this, it is a topping candle and we have probably started the drop into a dcl. That could be a short term shorting opportunity, but the big picture is still bullish for now.
.
So with that I’ll conclude by saying that …
– The General Markets are time-wise coming due for a dip into a dcl, and could start lower at any time, but as long as they remain above the 10sma, they are bullish.
.
– Oil has been choppy, and every move out of the lows weakens at the 200sma and starts chopping sideways. It was able to close above the 200sma, but we’ll see if it can hold on to it. Our Big Picture view of Oil shows that this choppiness can continue to happen if it doesn’t break out and STAY above that 200sma running higher soon. The Intermediate Cycle is getting older and another ICL will be coming due, pulling Oils price lower again.
.
– The USD was moving higher and in the middle of a trading range, but now put in a daily swing high . It could sell off next week
.
– With Gold, Silver, and The Miners, we had been looking for a reversal, since the Gold & Silver Daily Cycles were approaching day 30. We got that reversal & swing low this week and now we also have a weekly reversal candle. That is a buy, because it could be an ICL based on how much time has gone by since the May ICL ( 6 months). Some may want to wait and Buy after it proves itself, but we have seen individual Miners acting very bullishly, some even at their highs.
We also keep in the back of our minds that we could get one more daily cycle lower in Gold that lasts roughly 1 month. The weekly charts are NOT completely oversold, and there is room to drop using Fib guidelines that would still be Bullish. The COT is also capable of a pull back in commercial shorts. With that, we are allowing time to pass after the swing low formed to get a better idea of how this daily cycle will play out. We need to see a move above that 50sma this week in my opinion, since a L.T. daily cycle can top at anytime and start to weaken & drop lower. I will monitor the movement daily.
.
I hope you all enjoy your weekend with family & friends, rest up, and we’ll see what next week brings. And as always, thanks for being here at Chartfreak with me!
.

