
Thursday – Is It Time ?
Yesterdays report focused a lot on the fact that GOLD dropped roughly $30 out of nowhere. While some Miners sold off, there were others that remained Bullish. It gives us a hazy view of how this is going to play out, and I concluded by saying that we’d have to watch things a bit longer and see if the cloudiness clears up. 1 day is not enough, because Gold hardly moved yesterday, but I’ll discuss what we saw Wednesday after a quick market review.
.
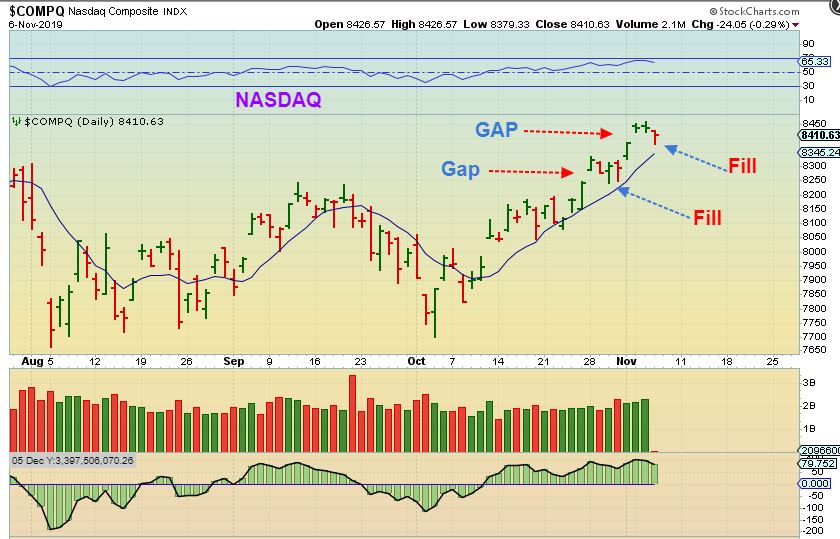
NASDAQ – The markets dropped Wednesday, but notice that we have been seeing gaps and gap fills on prior runs and also on this run. This is day 24, so it should now be right translated. At day 24, it could begin to top anytime, but may also just continue higher. The FED JUICE seems to be encouraging bullishness. I mentioned raising stops to under the 10sma ( or I would now draw a trend line & put it there) and this trade has played out well from the lows.
,
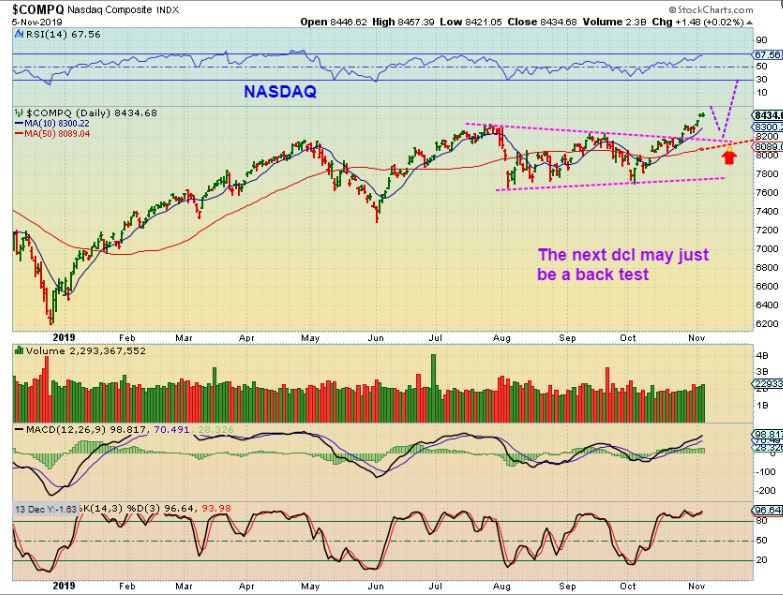
Yesterdays report had this chart : NASDAQ – I don’t think that the coming pull back will be very deep, maybe just a back test of the break out, but I’d like to sell at the 10sma, and re-buy at the break out if possible, rather than ride it down.
.
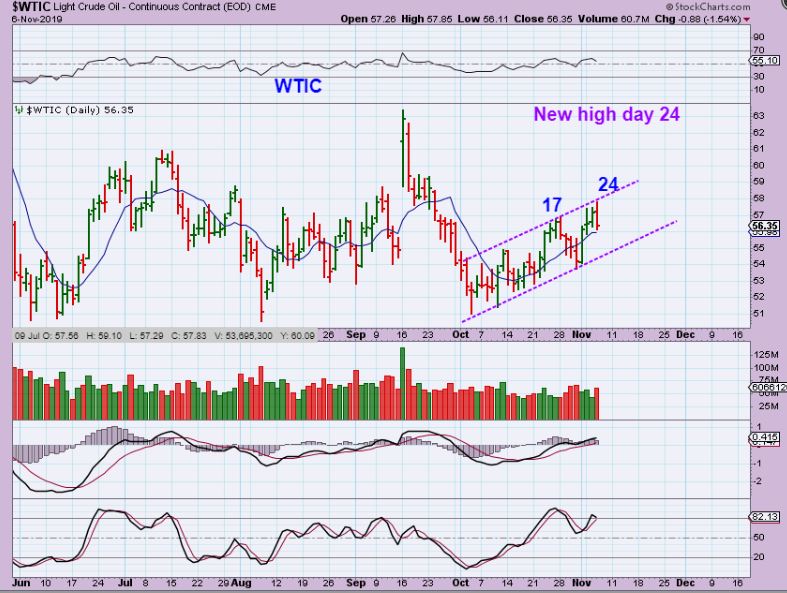
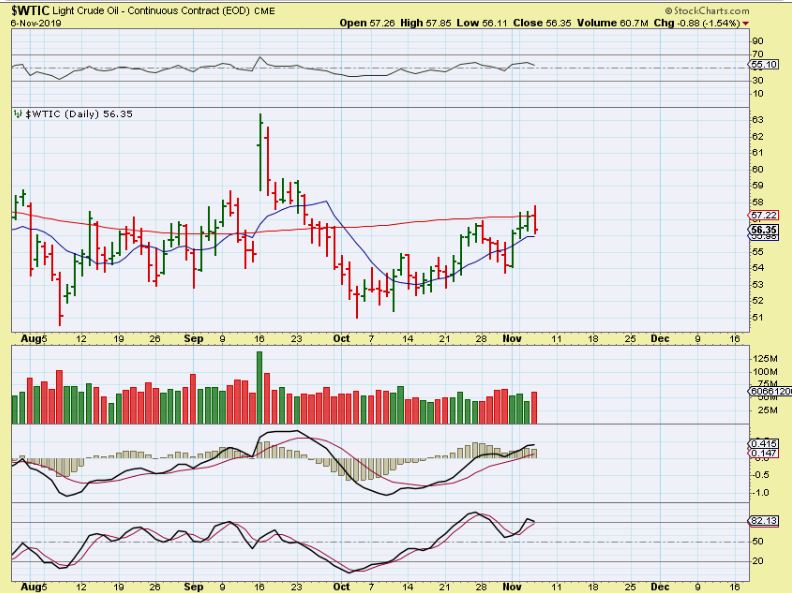
WTIC – Oil reversed on day 24, but it is inside of that tight up-trending trading range or channel. The only concern would be…
.
WTIC – As pointed out in past reports, Oil has been very choppy around this 200 sma area. Now on Wednesday it dropped on the inventory report there too, volume increased and some individual Oil stocks also reacted . This might just start rocking back & forth until it can break through the 200sma (Choppy) – Use stops, we’ll look at the XOP.
.
XOP – The XOP dropped to the 10sma & filled a gap. The lows look to be in place near $20.50, and it has also been choppy. This is a tough ride if you are trying to use stops. I did not have any energy stocks, so I bought BAS in the morning, and then sold it at the close. Many stocks like OAS, LPI, WLL, etc got a bit shaky and acted very volatile. I will show you a chart…
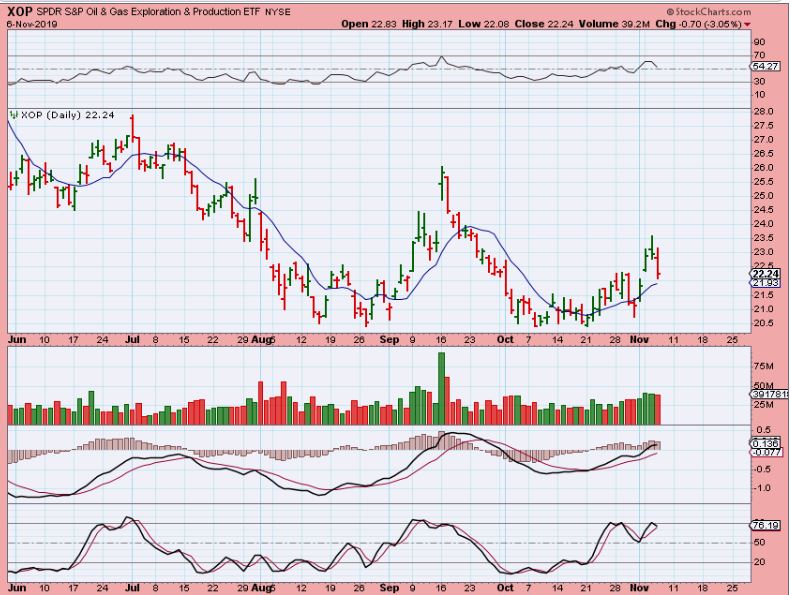
.
OAS, LPI, and a few others were Very volatile. They shot higher in the morning and sold off with Oil, so this sector needs babysitting or stops if you own any Oil stocks. If OIL Breaks the 200sma, these can benefit. So far the 10 sma held the drop.

.
THIS IS WHERE IT SEEMS THAT GOLD SHOULD DROP FURTHER. The problem is that several individual Miners looked pretty bullish and are even near their highs. That is a problem, because if I think Gold & Silver are going to drop while some Miners resist the selling, I really can’t recommend going short, and I also am not comfortable recommending ‘buying up various Miners’ and hope that they resist a sell off. We do need patience now that Gold plunged like that. Let’s review…
.
I WROTE YESTERDAY: GOLD – Notice that the last DCL seems to be Oct 1. That puts us on day 25, so if this sells off, a low can come within a week or so. Again, I sold my leverage to be safe, it moves very fast. What about Silver…

.
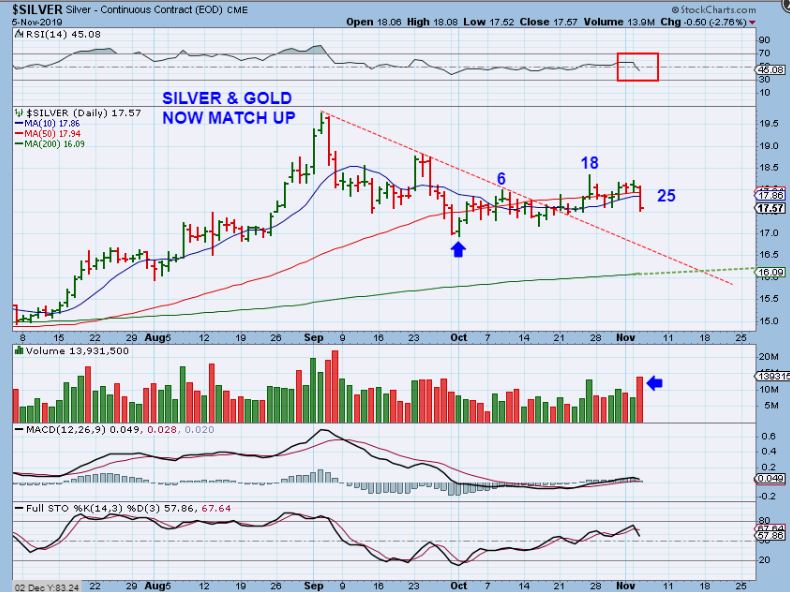
AGAIN FROM YESTERDAY: SILVER – Silver dropped & lost the 10 & 50 sma too. It has the same OCT 1 low, so the count would be day 25 here too. An ICL here could back test that trend line break & the 200 sma as an obvious place to drop to. Now to the Miners, and the set up is slightly different…
.
GOLD – On day 26 Gold moved a bit higher, but nothing has changed since it remains under the 50 sma. This late in a daily cycle, it would now be normal for Gold to drop to a dcl. Before that drop, it could have gone higher and ‘back tested’ the triangle as a dcl. I also drew something yesterday that would amount to this bounce being a bear flag…
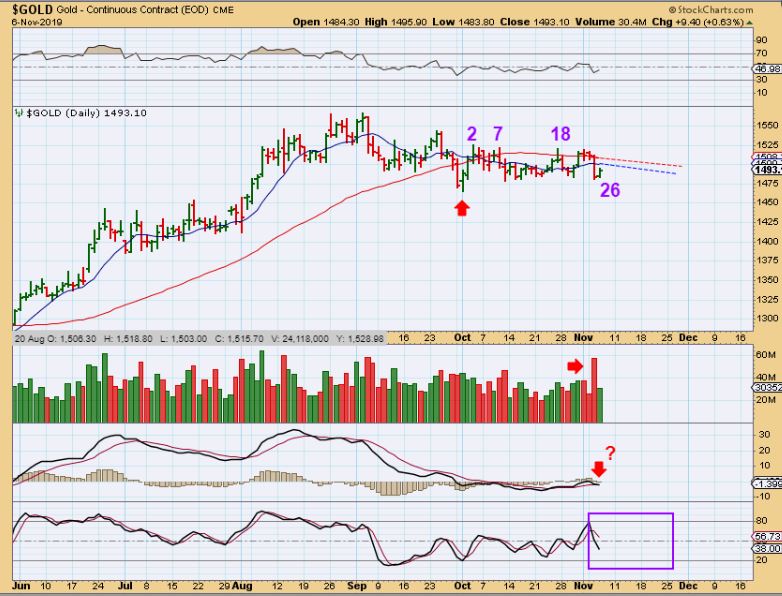
.
GOLD MIDDAY – I drew this yesterday showing that the bounce may just be a bear flag. I wanted to personally trade some JDST yesterday on the bounce & Not mention it, because it is too risky of a trade with all of this choppy action. BASICALLY I AM EXPECTING GOLD TO DROP. Roughly $1475 is the lower support line…

.
GOLD – With a possible bear flag shown on the chart ABOVE, we also see a support line close by at the lows, so if this support breaks down below that $1475ish area, Gold can sell off. Roughly $1475 is the lower support line.

.
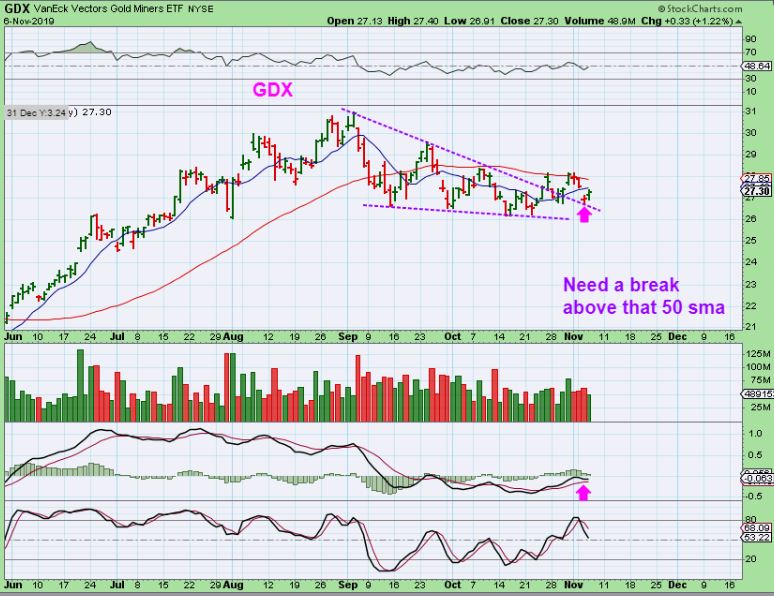
GDX – GDX back tested the triangle, but it did not break down yet. It is under the 50 & 10sma, so that isn’t healthy, it looks rather neutral, but if gold goes down, this could too. I really can’t recommend heavy trading long or short under these circumstances,but yesterdays report covered some very bullish looking Miners, and I will discuss more in this report.
.
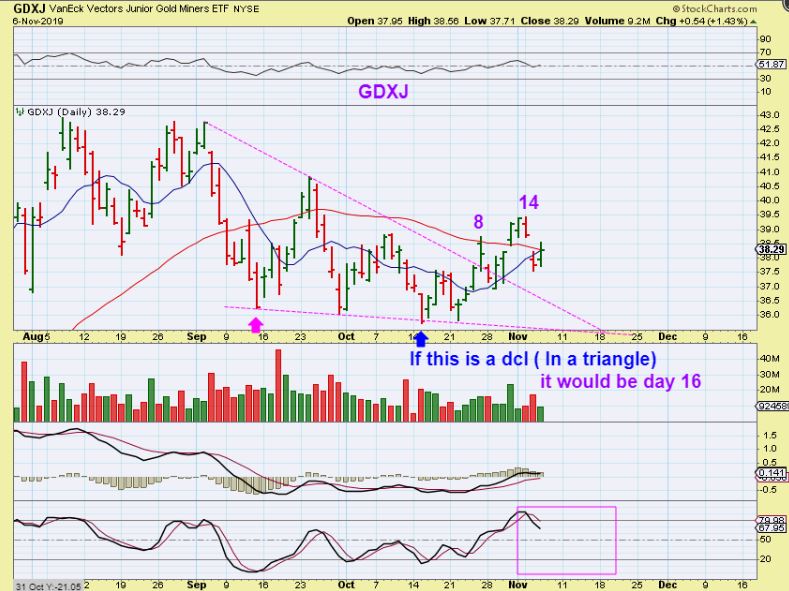
GDXJ 10 a.m. – I drew this and that red arrow shows that a deeper drop could also serve as a back test of the triangle and the 200sma, but it also makes a lower low ( ICL?).

.
GDXJ started to overtake that 50 sma midday , but what I want to point out is that this has been months of sideways consolidation & chop. Why is that important to notice? It shows that as GDX & GDXJ churn sideways, some individual Miners had the ability to move up near their highs, others dropped. IF GDX / GDXJ Drops next for a GOLD ICL, those leaders at the highs may do a normal pull back, a milder one & not a deep one.

.
GDXJ CLOSING PRICE – GDXJ closed at the 50 sma. If I started a count from the recent lowest low, as though it was a dcl, this would only be day 16 (usually a 1/2 way point). This could drop for 2-3 weeks and that makes this set up a tough one to trade. Why? As noted recently, some Miners just look very bullish…
.
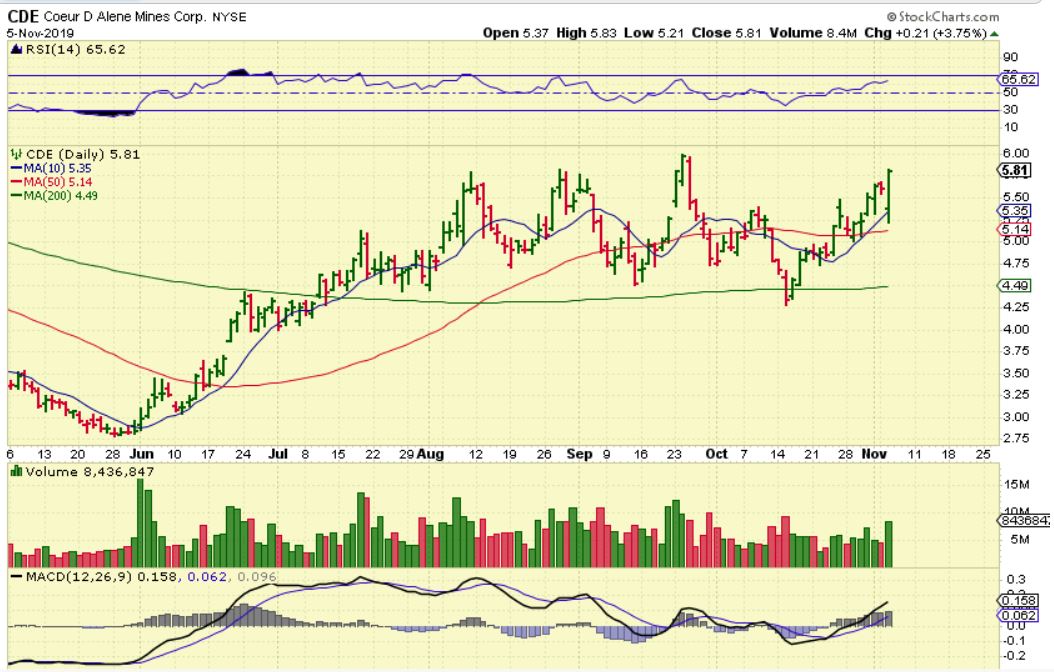
Yesterday I wrote: CDE gapped down big, and then rallied to the highs. That looks quite bullish near the highs.
.
CDE -CDE then broke to new recent highs yesterday ( not new 2019 highs). It later pulled back a bit & closed just under $6.

.
CDE – The real break out comes next- this looks like a bullhorn or megaphone pattern in the bigger picture.

.
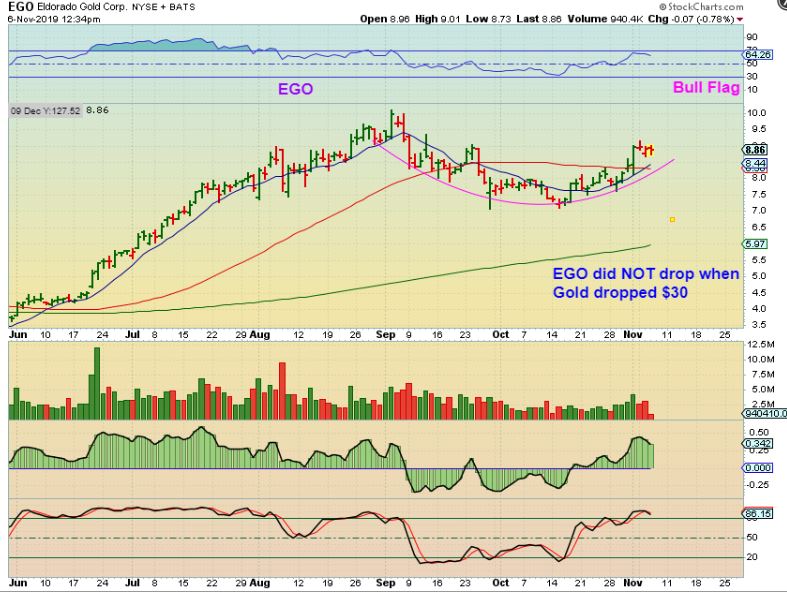
EGO – I noticed that when GOLD dropped $30, EGO did not really drop very much. It looks like a bull flag. I am now wondering if some of THESE Miners will hold up much stronger, despite a possible deeper sell off by Gold.
.
SSRM – That is an abandoned baby set up and that can be quite bullish under the right circumstances. Abandoned babies are an immediate buy, because they usually become exhausted on the gap down and the gap open fuels short cover & buying. If Gold & Silver drop though? This could fill the gap.

.
TRX – TRX is a bullish looking set up too, as it rides along the 200sma & Popped Wednesday. Notice that TRX did NOT sell off at all on Tuesdays $30 drop. It sat on the 200 sma. THAT seems like a big deal, right? Juniors usually get crushed if Gold drops $20 or more. So if Gold sold down to a new dcl, would TRX hold up? It looks that way, but honestly it is not possible to say for a certainty.

.
FOR THE PRECIOUS METALS, a review of recent action:
.
1. We had some individual Miners at the recent highs, some breaking away like CDE, HL, SBGL, etc. as Gold dropped & that seems Bullish. Look again at TRX & EGO as Gold dropped $30+ Tuesday. That also just looks very bullish, but it is risky.
2. Triangle upper trend lines were broken upside. That is a break of the down trend & is also viewed as Bullish, but they are falling back. Just a back test or a drop to a deeper low? Unknown.
3. Miners began breaking above their 10 & even 50 sma , but GDX & GDXJ are back below those markers.
4. Gold dropped like a rock from $1515 to $1480 Tuesday? That is $35! Some Miners dropped too, others really did not. Confusing.
.
So my thinking is this: It does look now like Gold wants to break down, since it suddenly sold off Tuesday by about $30 & broke back under the triangle & 50 sma. When I look at some Miners up near the highs, it is impressive, but will they hold up if Gold sells off? I would surmise that Those stronger Miners may just drop to their 50 sma or have a milder sell off if Gold & Silver sell off. Look at TRX & EGO for example- they didn’t flinch when Gold dropped like that.
With all of that taken into consideration, I can’t recommend that my readers short the Miners ( JDST), but iGDX & GDXJ may drop with a sell off. I also wouldn’t recommend going HEAVY with any specific individual Miners, though they may hold up better than usual. At this point & with this set up, it still may be best to watch and wait and see if Gold drops down and how Miners react to that drop. Holding some smaller positions now may not hurt, as long as you understand that things look like they may become a bit volatile. This is not a normal set up, it has become cloudy with all of the triangles that formed causing volatility & choppy trade. This may be designed to kick the bulls off and keep them off, but we’ll track any selling time-wise and be ready to buy lower.
.
Enjoy your Thursday trading!
.
~ALEX
.
GOLD – I’m drawing the bottom line as a support line here and we’ll see if it holds, but this is a bit unpredictable. I am also pointing out several false break outs that we have seen along the way. This makes it VERY HARD to read what is real & what is false. Are we at the end (?) or start (?) of a run. Did we get a vague ICL in place with this being just a triangle back test? Or is that ICL still to come as this breaks down below support? THAT IS THE QUESTION, and it seems that Only time will tell. We are at the APEX, so a break higher or lower should present itself soon.

