November 5th – Uptrends
The General Markets gapped open on Monday with a sign of strength on day 22, so lets discuss the possibilities…
.
SPX – ONLY a gap down would concern me Short term.
1. If this gaps down, that is a rare bearish abandoned baby top, a reversal that can start a short term sell. I personally would just sell a gap down.
2. If it opens slightly down & starts to fill the gap? Not a problem. Opening ‘even’ or ‘higher’also is not of any concern. This is a day 22 high and likely it will become R.T. This could gap open higher and just keep running…

.
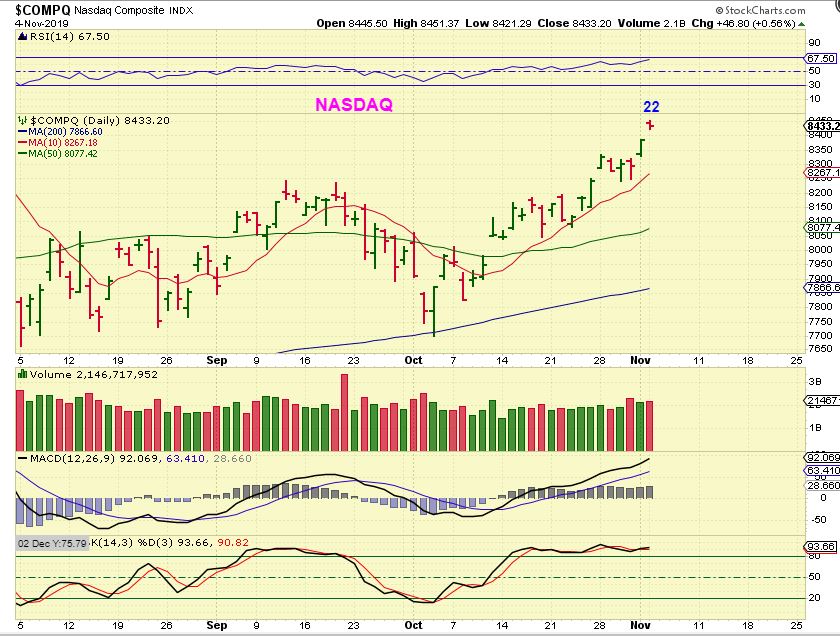
NASDAQ – The NASDAQ set up is similar, but I want to emphasize that a gap open like we saw Monday is a sign of strength rather than ‘bad’. Look at the gap open on the 28th. It filled over 2 days and moved higher. We saw one on the 11th that never filled, so a gap open is fine. It is simply a GAP DOWN that abandons the top & I’d lock in gains. ALSO…
,
TRAN – The TRAN pushed higher and never sold off, so we are not necessarily looking as though a sell off is coming. If this gaps open, it would be more of a sign of buying & strength.

,
TRAN – I will say that the TRANSPORTS have popped to new highs in the past and it has been a final high for a bit, so again, use trailing stops and ride positions the way you see fit. A GAP DOWN is the situation that will raise a bit more of a short term concern.

.
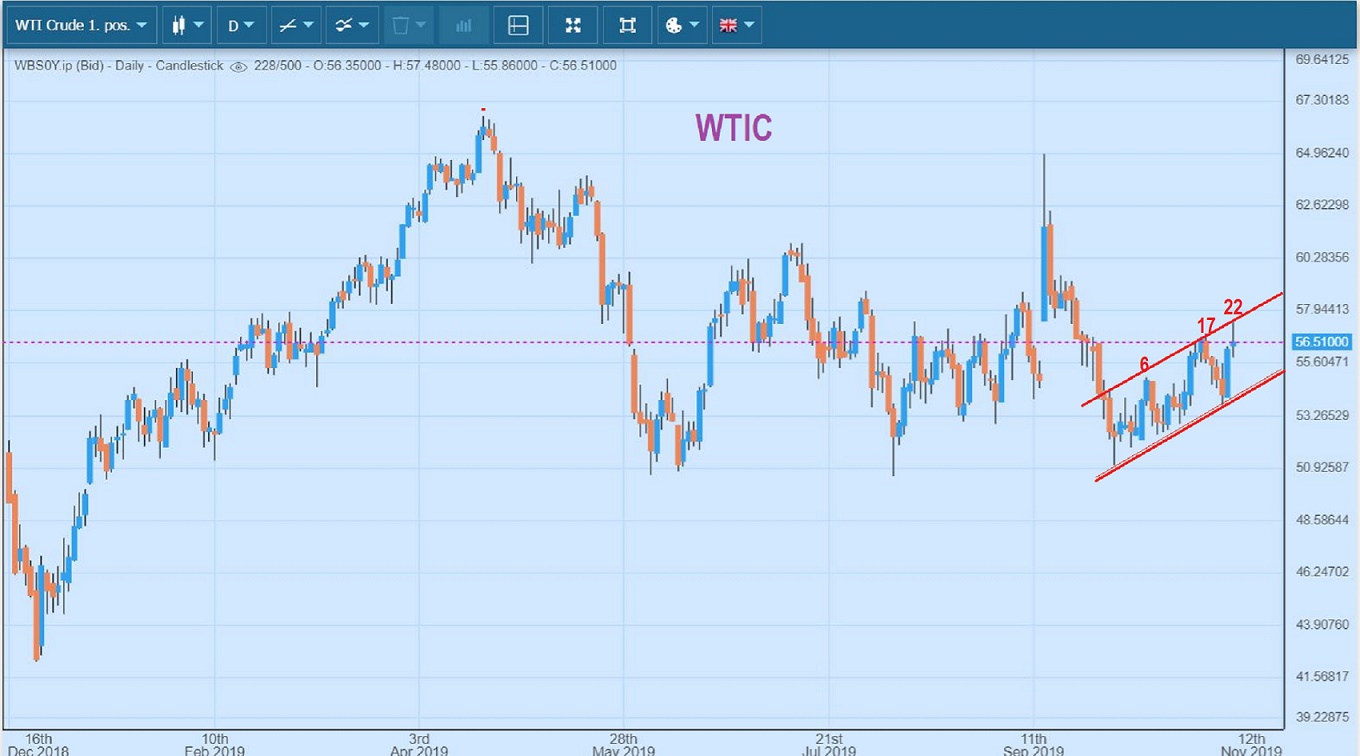
WTIC – Oil burst higher on day 22 and then sold off, but that is where that trend line was. The good news is that as Oil sold off, many Oil stocks did not. They actually look good, so Oil is up trending & looks bullish in the short term and maybe longer.
.
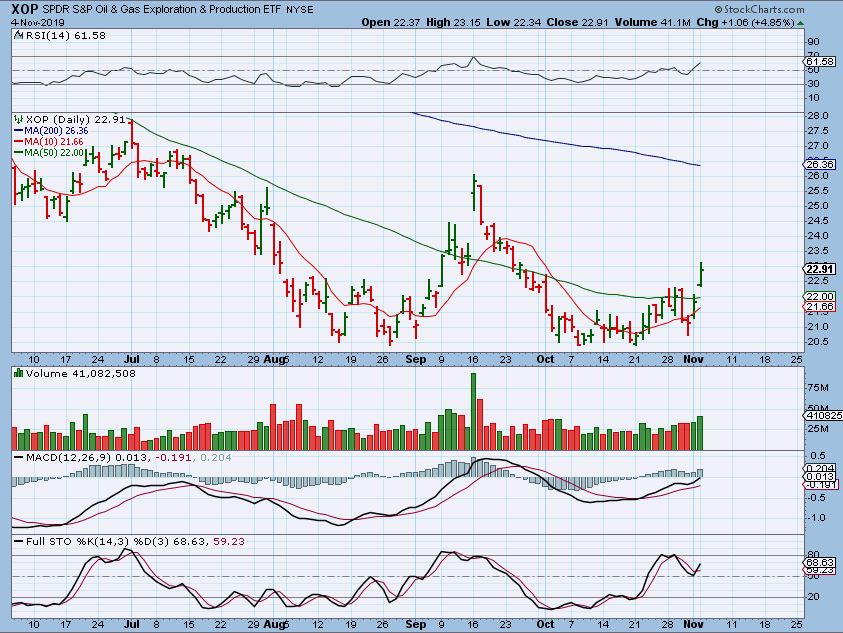
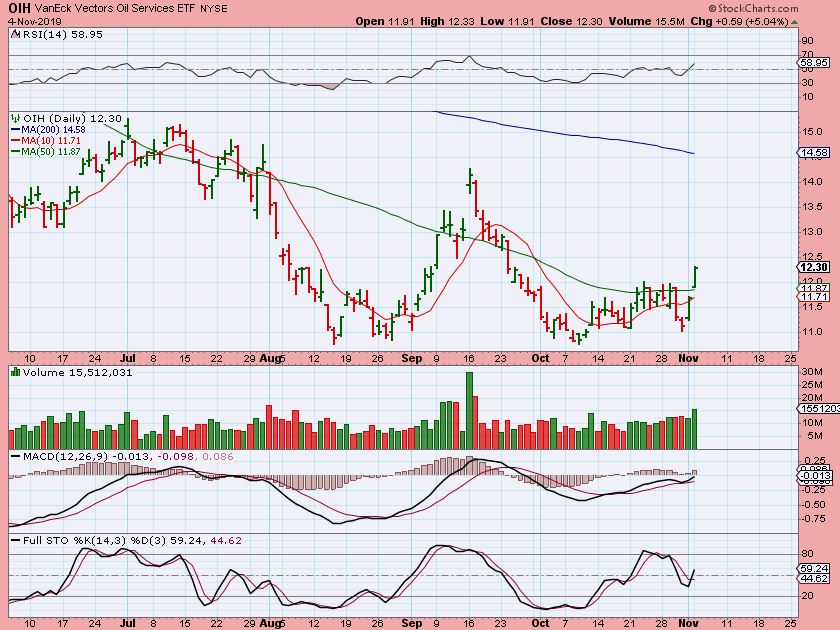
XOP – The XOP , XLE, and OIH burst higher and did not sell off. That makes this a convincing break out.
.
OIH – Volume increased as the OIH broke through that 50sma.
.
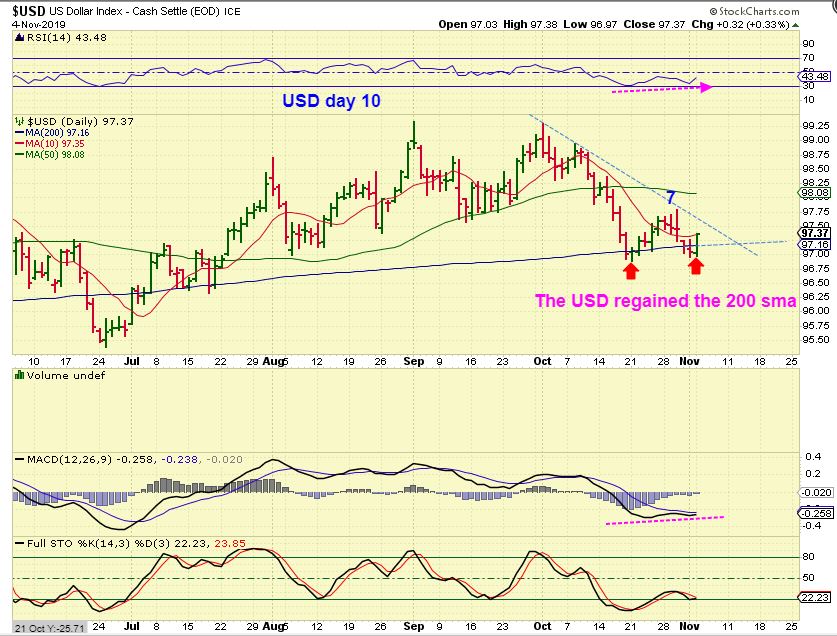
USD – The USD actually regained the 200 sma. AT THIS POINT, this should be day 7 peak and we are on day 10. I was expecting a back test of the 50 sma at the prior lows, but now I do not want to see one on day 13 , or the USD could be strengthening again. Let me explain further…
,
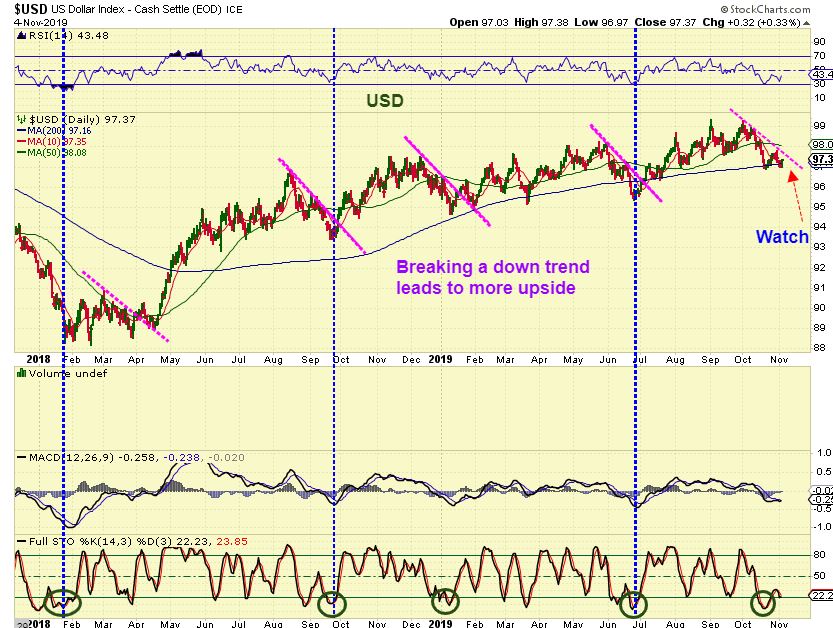
USD – If the trend line breaks, this set up starts looking strong again. A break of the magenta trend line would be indicating that not only did a new Daily Cycle low form, but an ICL could’ve possibly formed. Am I alarmed? Not entirely and I’ll explain why in a moment. I’ll pay attention, and see how the Precious Metals act after that, but …
,
Look at the end of June where the last vertical blue line is. That is an ICL on the last week of June, so you have to go back to GDX this summer and ask yourself, “What happened to GDX at the last week of June when he USD bottomed?” …
.
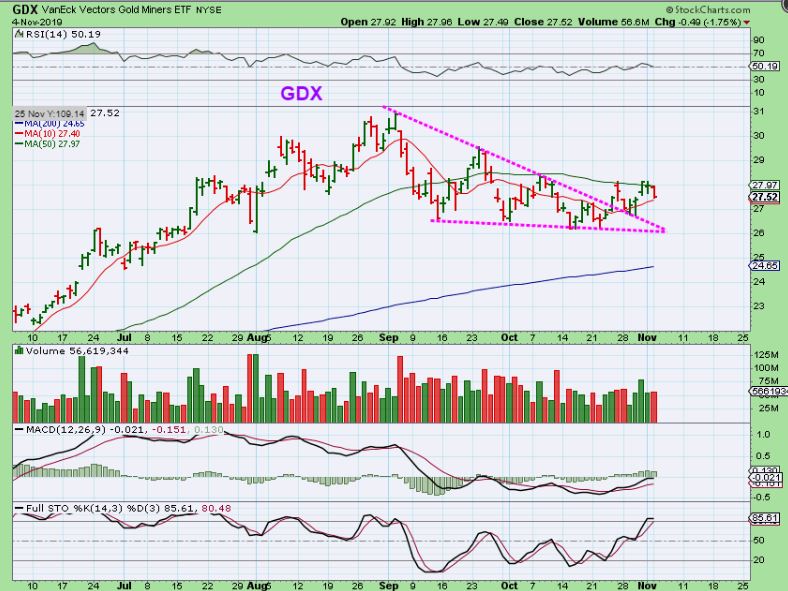
GDX was NOT bearishly affected by the ICL in the USD at the end of June. Our rally gapped & ran in June. Obviously this is something that I am watching as a precious metals trader, but the USD & MINERS have been out of sync & not inversely correlated lately.

.
PRECIOUS METALS
.
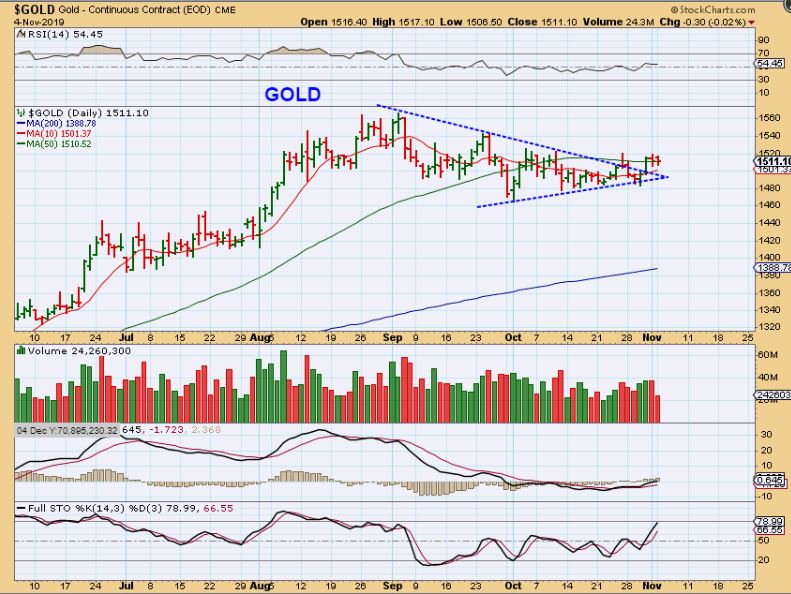
GOLD – Gold had a mild down day . It is still above the 10 sma at this point and the histogram is green.

,
GOLD – Gold has not back tested the triangle break out, and it can, so that would bring Gold down to about the $1500 area, maybe even lower. The MACD & RSI on Gold are Bullishly aligned, so a drop is not bearish unless we get below the apex of that triangle.
.
GDX dropped to the 10 sma, & was turned down at the 50 sma again. This can back test the triangle, but it actually already did once last week, so hopefully that is out of the way.
.
Trading has been pretty active and good in many sectors, so I will have a few stocks of interest listed below.
.
Enjoy your Tuesday trading!
.
~ALEX
.
VIPS is a stock that we’ve traded, and I want to use it here as an example. This was Sept 5th chart posted as a buy, and it had traded in a sideways range closing above the 50 sma. Breaking above the highs could lead to a nice run…

VIPS – So this is the run 2 months later ( that may even be forming a bull flag right now, it can return to the highs). My point? These sideways consolidations can lead to a nice moves after breaking out. Notice that this broke out, but then back tested that 50 sma before really taking off. That is possible too. Let me show you another one that may be ready now.

,
JD – This is the same chart set up, and it is just now starting to break out as the Markets break to new highs. This is a buy very similar to the VIPS set up.

,
.
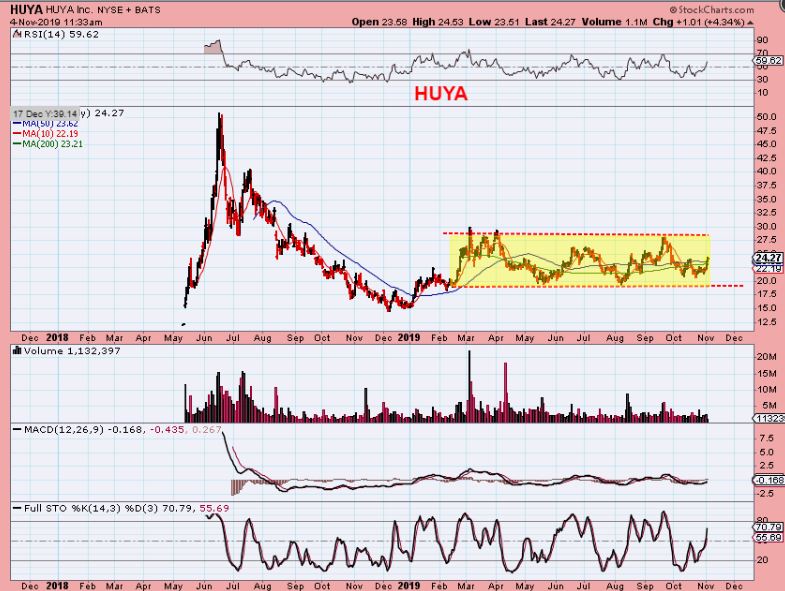
HUYA – HUYA has been running up & down in the same kind of a sideways consolidation too. I am finding many of these in the Chinese stock sector. It looks like it will run back to $30 short term, and that is a good trade. A break out after that could really tack on the gains, because it could get to the prior highs.
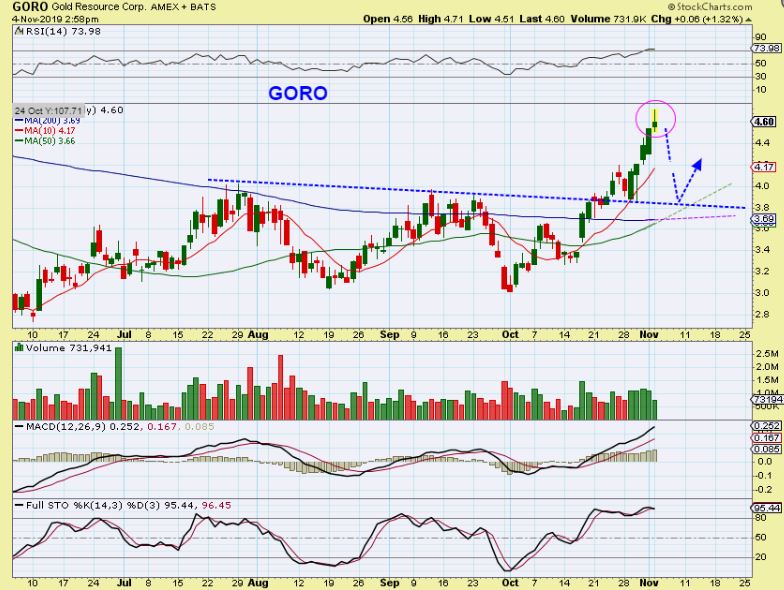
GORO – Did you buy this break out of the 50 sma or even the blue trend line. That looks like a topping candle and because it comes after a long run, I would have sold mine, hoping to buy it back maybe 80 cents a share cheaper. I posted this an hr before the close in the live area.
,
GLBS – This shipper looks ready to break higher, but I have been saying that since it first pushed on that 200sma. =) It is bull flagging so far, and I love the long base. Some of us bought this near the green 50sma line, so a break out may be a good place to add.

.
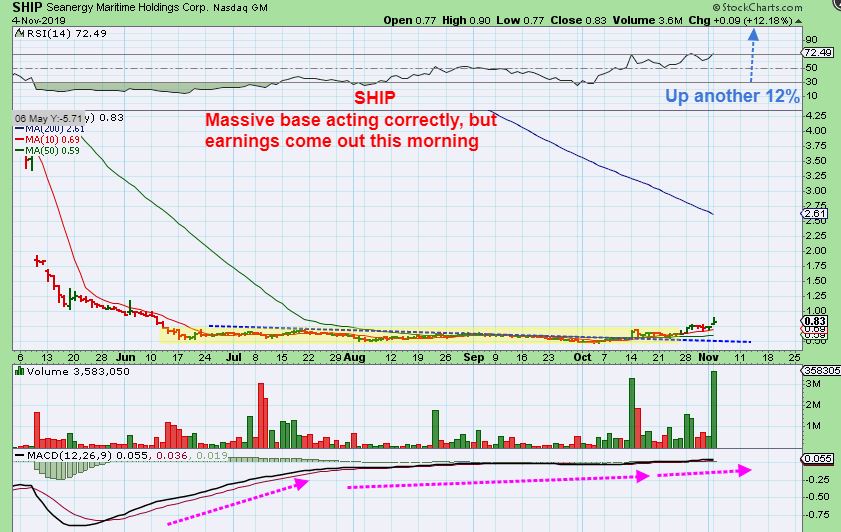
I have also mentioned the large base on SHIP. It popped almost another 20% midday, but earnings are Tuesday morning & some profit taking appeared near the close. We’ll see what happens after that earnings report.
,
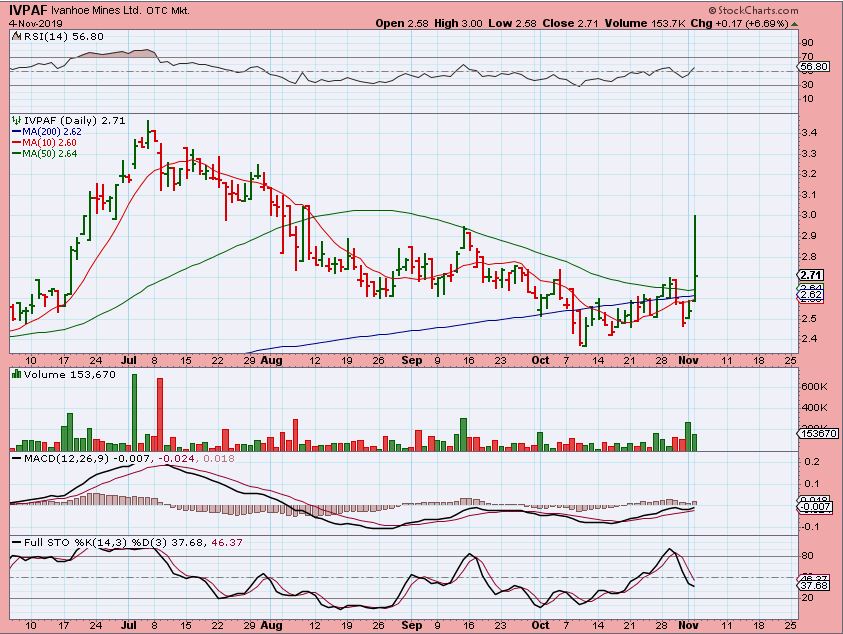
IVPAF – This Miner was lagging for sure during this years run, but it may be ready to run sooner than later. I posted this in the live area at the open, it was breaking out and had ‘that bullish look’. Later on Monday it actually ran to $3.00! It then dropped back to this price again…

.
IVPAF – That was a nice sign of strength, so IVPAF may be ready to go higher over time.
,
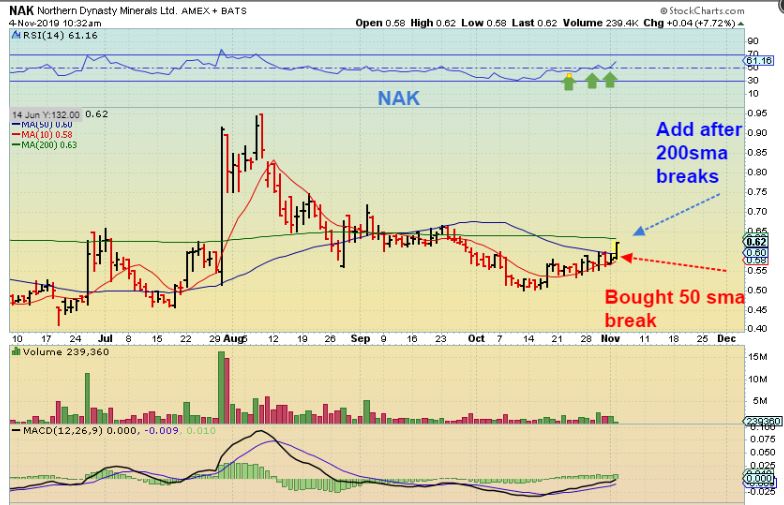
I bought NAK Monday morning & then captured & posted this chart. I’ve been watching it climb that 10sma & then it started to push that 50 sma. It popped Monday.
,
NAK closed at the 200sma, so I still think it is a buy here & will break higher over time, or wait & buy a break over the 200 sma.

.
.
BAC WEEKLY – After long consolidations, BAC can do a slow but steady run. JPM has the exact same pattern & Break out on a 4 yr weekly chart. BANKS ARE BREAKING OUT. See also KEY, HBAN, MS, RF, etc on weekly charts. Very interesting patterns breaking higher on 3 yr weekly charts. These are somewhat slow movers, but they are breaking higher.

OIL / ENERGY
.
WILL – This was after just 2 hrs of trading. It closed here with 10 million in volume, and can be bought here with low risk using a stop. Mondays move looks like a small pop, but it was actually 12%, so you can see how easily this could tack on another 12 %. Or 50%. Or double if Oil / Energy remains bullish.

,
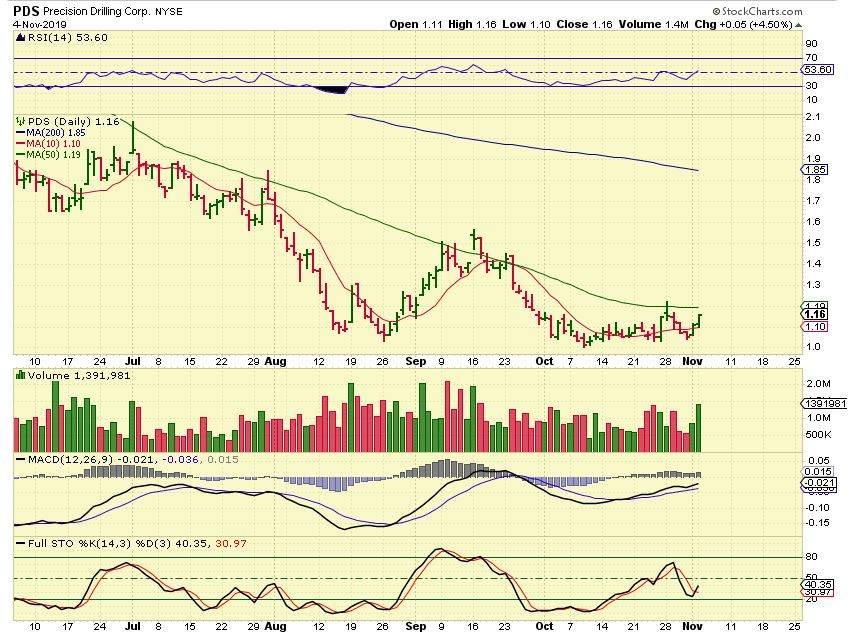
An Energy watch list is helpful, with stocks like MRO, PDS, LPI, WTI, OAS, AREX, CHK, etc . Many popped up over 10 %, but they look like they are just starting to break out.
.
Look at AREX for example: That tiny pop was a 12% pop. Maybe you don’t like Penny stocks though, so …

.
OAS had about a 10% pop too, similar to WLL. It is back above the 10sma and will probably break through that 50sma, since this sector finally seems ready to move higher.

.
PDS had a nice increase in volume and a nice flat base has formed. It may break above that 50 sma on the next try.