Tuesday Nov 26th – Holiday Week Trading
I just want to start by quickly saying that this weeks trading may be less than normal. Tuesday will probably be normal, but in the U.S. The markets are closed Thursday and Friday is a 1/2 day of trading. Along with that, we often see lighter volume on Wednesday, since many people pack it in early and hit the road to begin their travels. So let’s just take a look at where we are now…
.
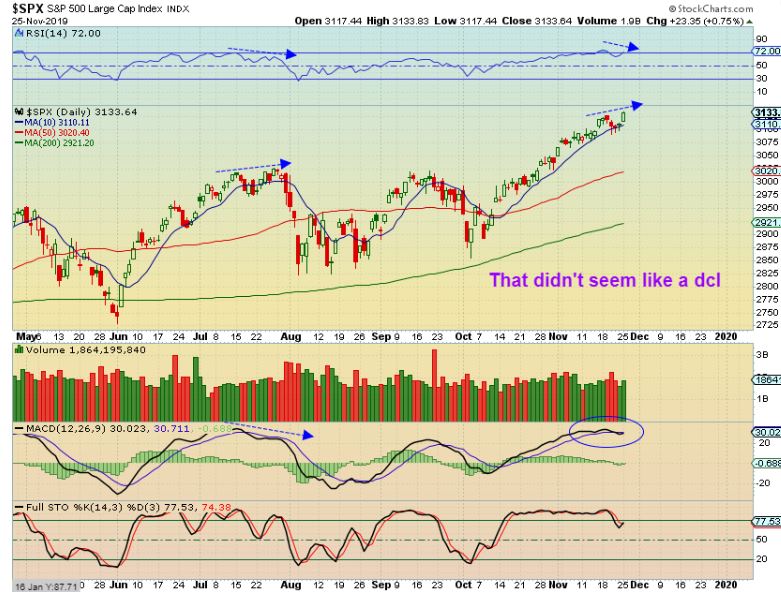
SPX – The 10 sma never dipped down, price didn’t close under the 10sma, and I see divergence on the move to highs here. For those reasons, this doesn’t really seem like we had a mild dcl. It looks like a continuation of the same daily cycle.
.
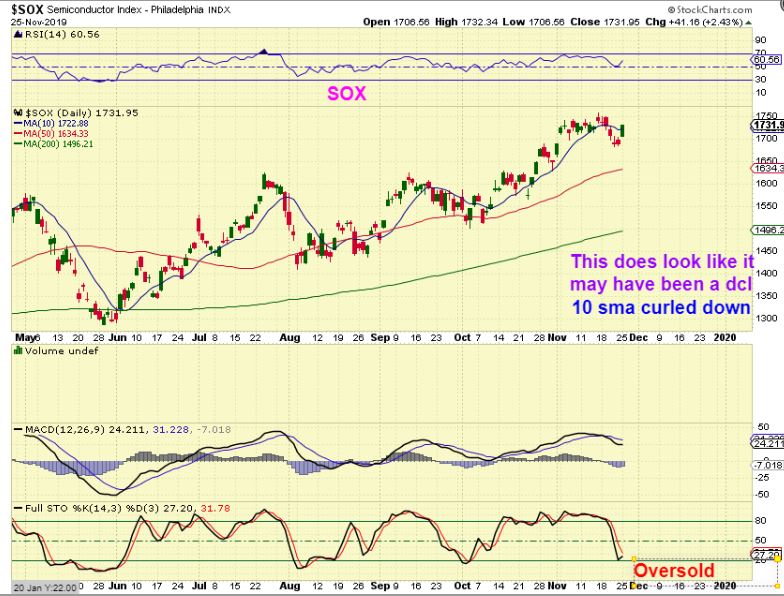
SOX – The Semiconductors actually do resemble a dcl, as the 10 sma dipped down with price closing below that 10sma. Also the SOX became oversold while the SPX, DJIA, and NASDAQ stayed over bought. At this point the divergence seems to indicate that it will get choppy or toppy short term.
.
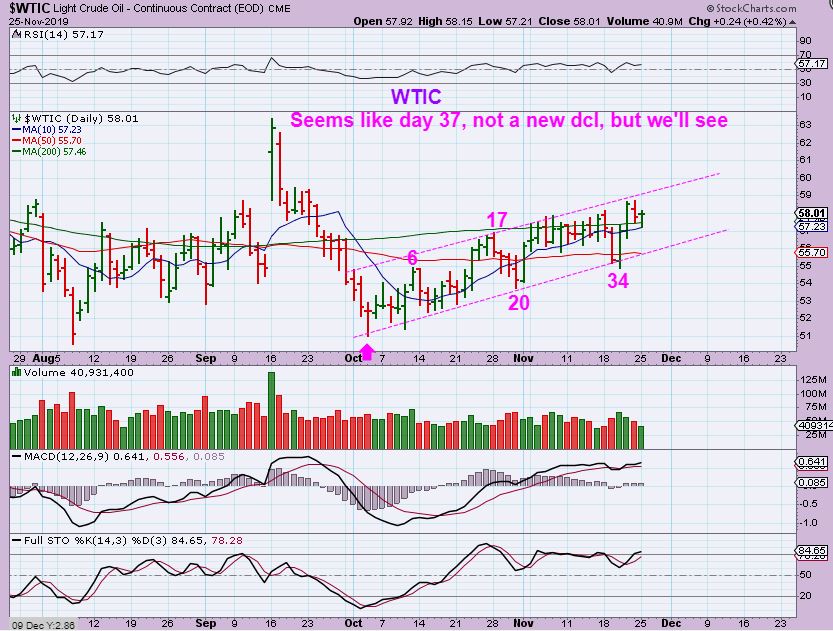
WTIC – Oil continues to close above the 200sma, but it has basically been sideways for weeks with a quick dip & recovery.
.
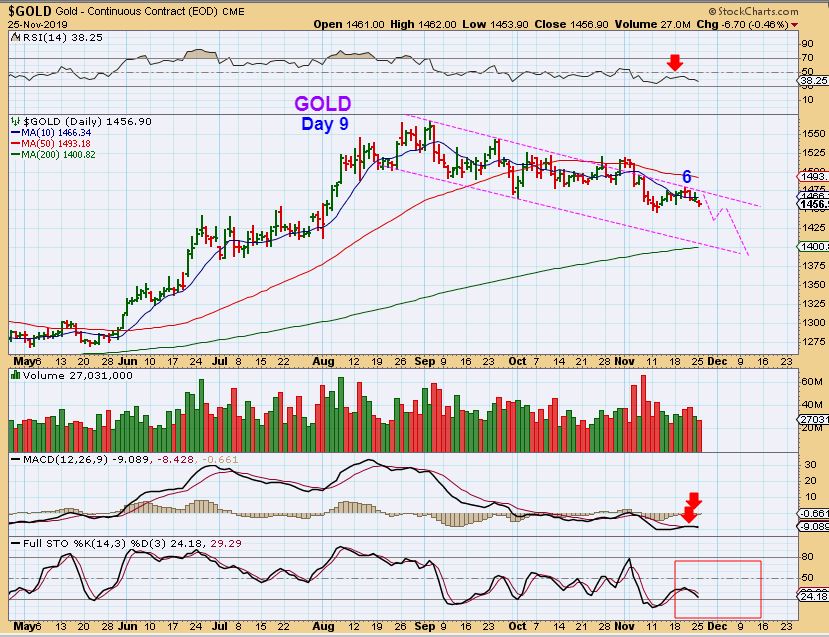
GOLD DAY 9 – Gold dropped Monday and closed below the 10sma. It has a day 6 peak, and this would be L.T. if that peak is never taken out. The lows need to hold or we have a failed daily cycle & Gold will then push down into the real ICL with a day 6 peak.
.
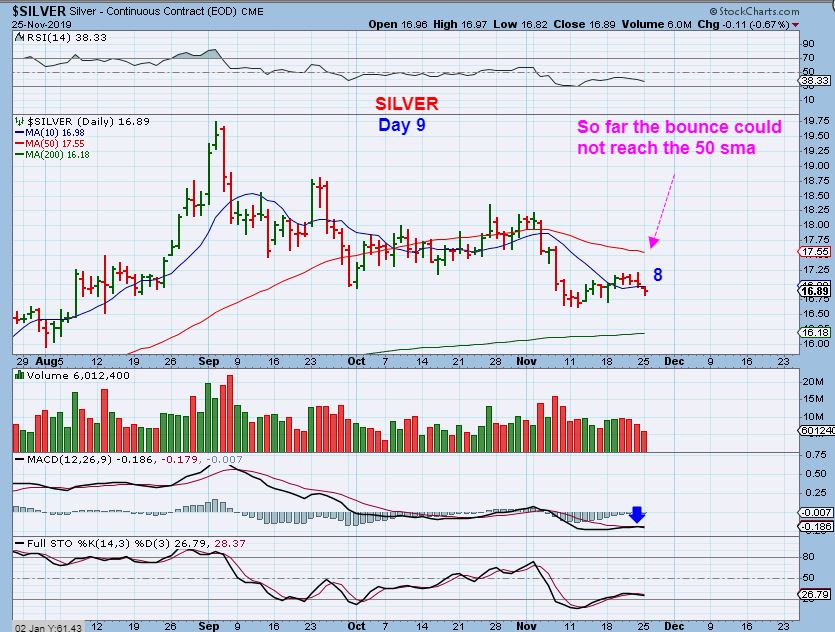
SILVER – Silver even looks a but weaker than Gold, it never Popped back up to the 50 sma. This can chop sideways and then POP higher, but at this point it looks like it is going to take out the recent lows.
,
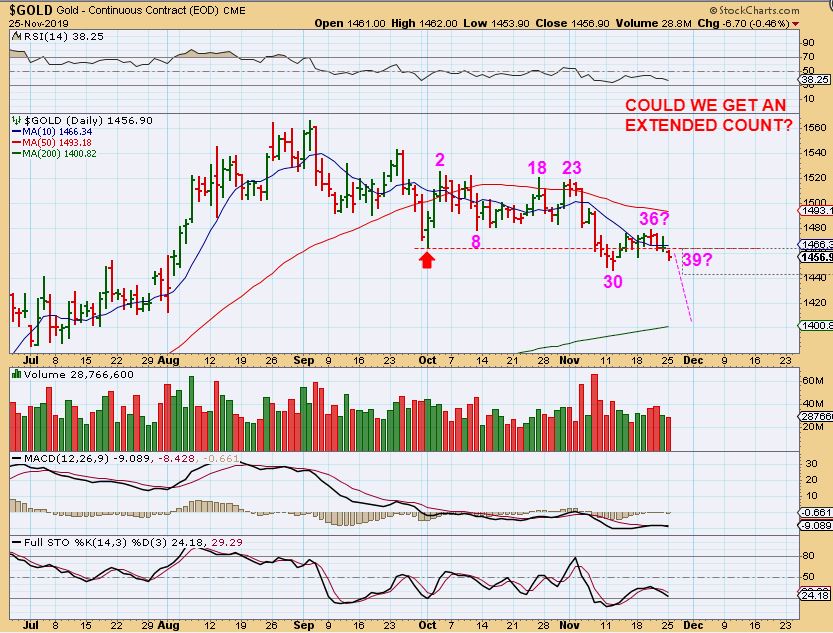
GOLD – The 10 sma did not really turn up, so is it possible that we could get an extended Daily cycle ( Say day 43 low) and then the ICL is in place? I wouldn’t rule it out, simply because the consolidation has kept many Miners in a Bullish formation. Picture an A-B-C down from day 23 to day 30, to day 36 and to the 200 sma area.
.
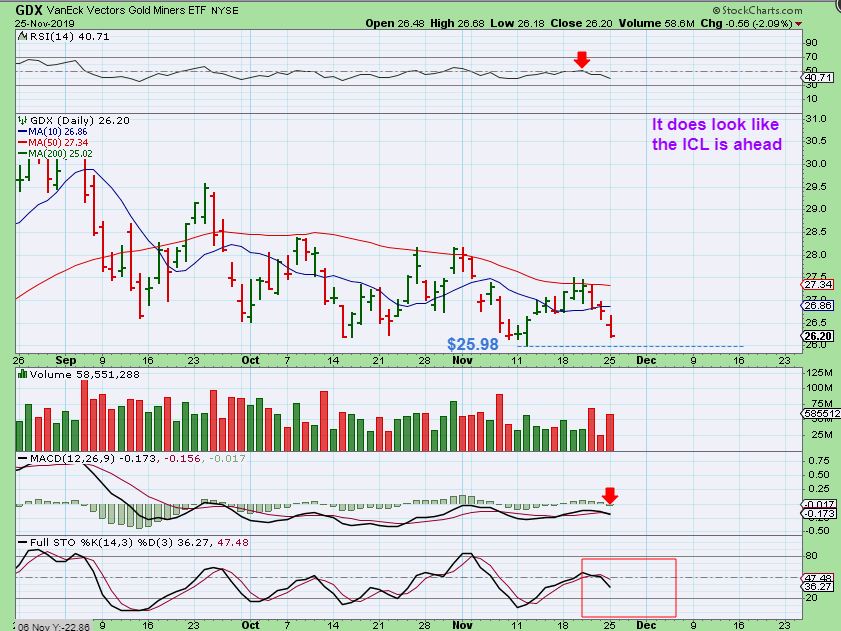
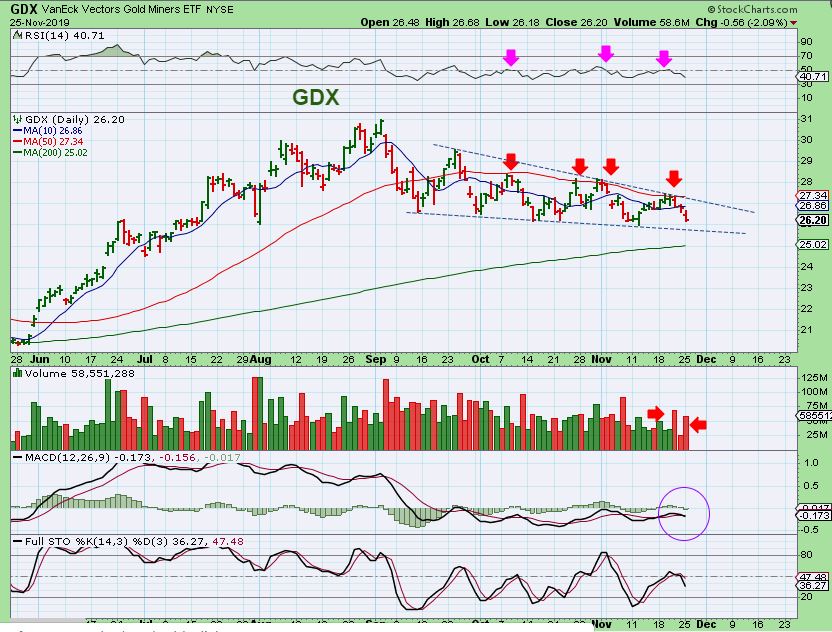
GDX – GDX dropped and is also threatening the recent lows, with an increase of selling volume. It has been very choppy, so both bulls and bears ( JDST & JNUG holders) have not been happy with the lack of progress.
.
GDX – Breaking the lows could lead to a normal back test of the 200 sma (finally), but we have to expect a possible ‘shake out’, because they have been common lately too. Again you can see why holding a position in Longs & Shorts has been frustrating or even boring. A great buying opportunity will come with a solid rally out of an ICL though.
.
The sideways chop in the precious metals sector is putting traders to sleep. We have been waiting for confirmation of an ICL with a strong rally higher, or a break down in the daily cycle that will lead to a final low and then a rally out of an ICL. The current choppy sideways action is helpful, because sentiment was getting too Bullish with the last run higher. Now many are losing interest in the sector as it churns sideways and sentiment drops. We could still see a sudden burst higher and a rally could surprise everyone, but it seems more likely that we will visit the 200 sma area. If we could see a sell off below recent lows where price drops lower, it could make for a great trade opportunity in December when we get the final lows in place. For now, I will discuss a few trade ideas below, but remember that this weeks trading is a short week in the U.S.
.
Enjoy your Tuesday trading!
.
~ALEX
.
Tomorrows report may only consist of a very brief review & a few more ‘Trade Ideas’ if the General Markets continue higher, since Wednesday and Friday will be holiday altered trading.
,
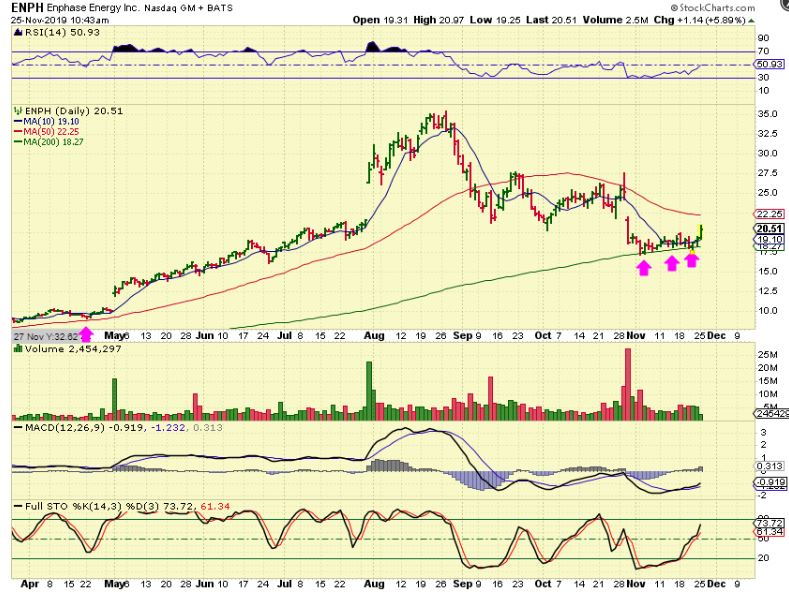
ENPH – After an extremely bullish run higher, ENPH finally started to consolidate those gains. It finally reached the 200sma as a back test and rode along the top of it for over 2 weeks. Monday it broke higher and this is a low risk entry with a stop at the 200sma. I captured this 1 hr after trading started and it closed with good volume ( over 8 million) and I bought it.
.
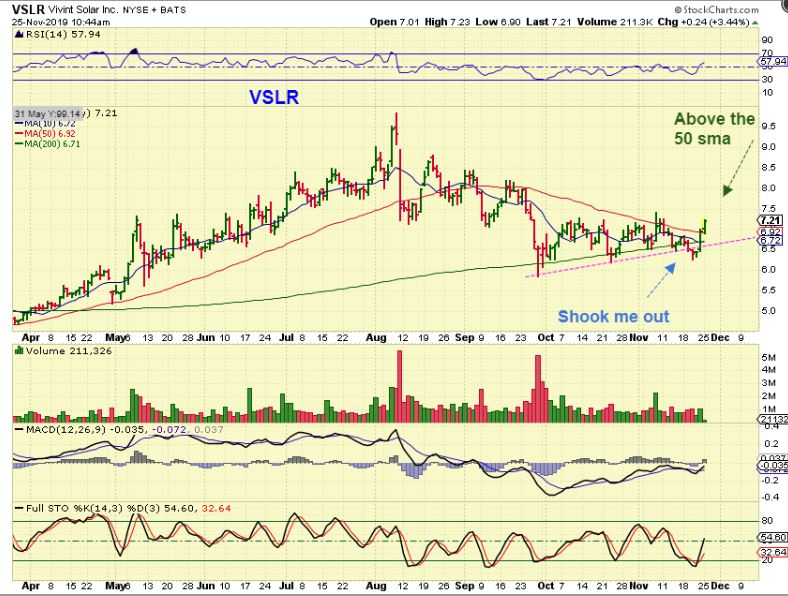
VSLR – VSLR has also been riding along the 200sma and now pushed back above the 50 sma, so there is a chance that this will try to run back to recent highs. It is also a low risk entry and I bought this one too.
,
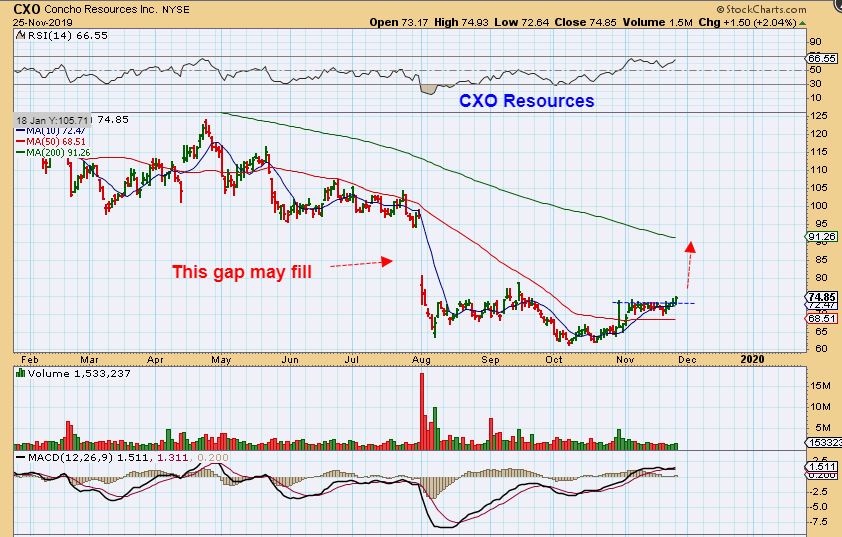
CXO – This looks ready to move higher ( See a 3 moth chart). Here I am showing an upside target.
.
.
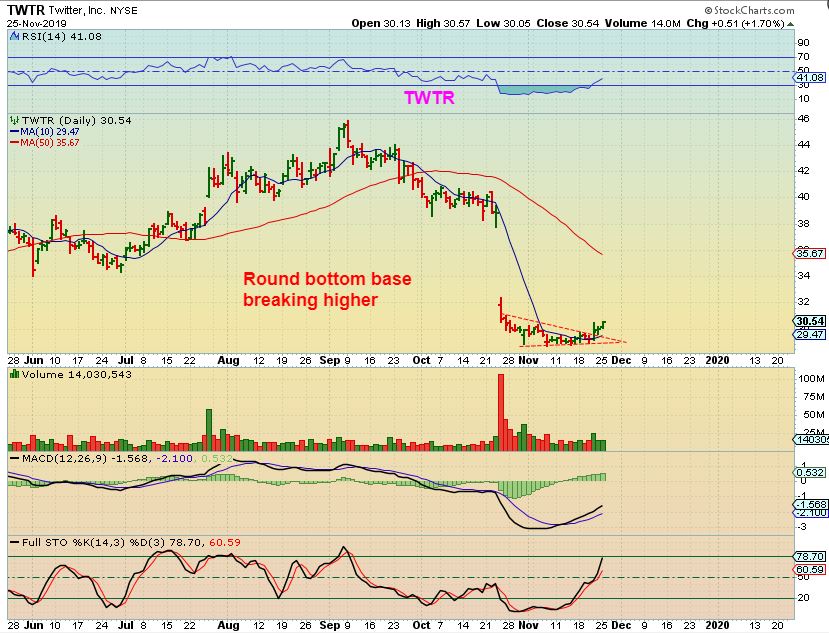
TWTR – I would say that this should be a short term trade only, but this could run nicely as a trade.
.
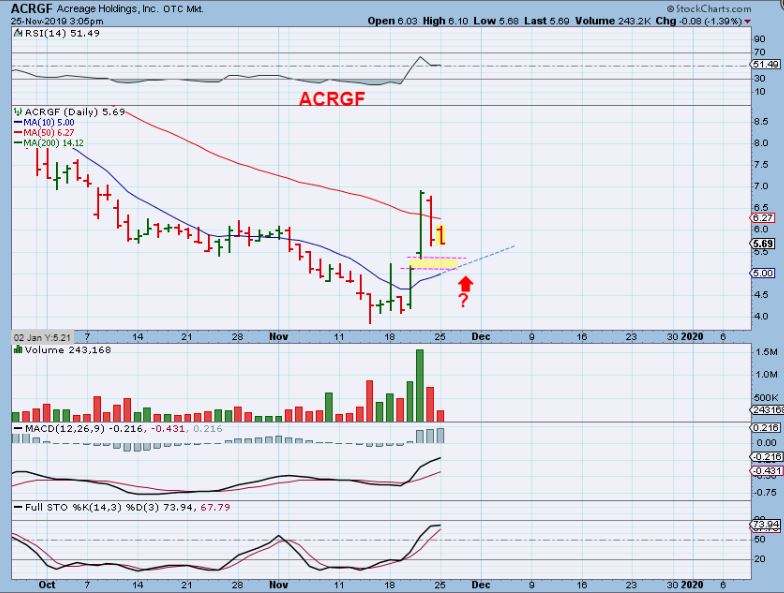
ACRGF UPDATE – What a POP from under $4 to $7. I bought the 2nd high volume break of the 10 sma and sold some above the 50sma. The pull back is on light volume, so that is good. If this is going to remain bullish, it may just drop down and do a gap fill & reverse at the 10sma. I’ll be watching for a reversal there and if that happens…
.
.
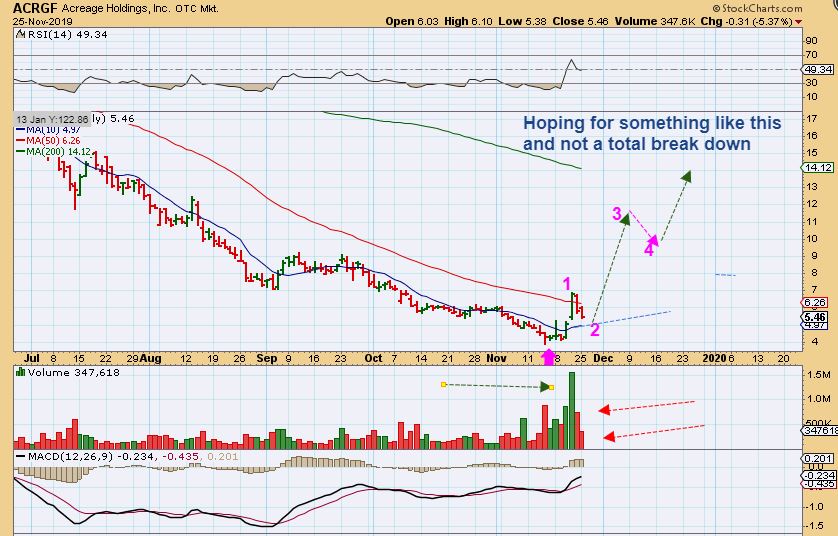
ACRGF – We would be hoping for a good move like this over time. These also might just go sideways and put in a base, but I pointed out the weekly reversal candle in the weekend report (similar to CDE Weekly), so this would be the more immediate bullish expectation. I bought this at the lows, sold a portion at the highs, and want to re-add if it acts correctly, because …
.
I POSTED THE FOLLOWING 4 CHARTS IN THE WEEKEND REPORT:
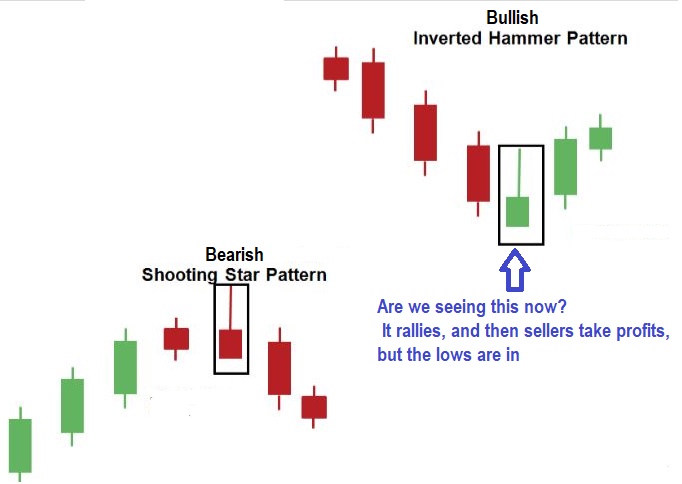
1) We are looking at a BULLISH INVERTED HAMMER PATTERN AT THE RIGHT SIDE OF THIS CHART
.
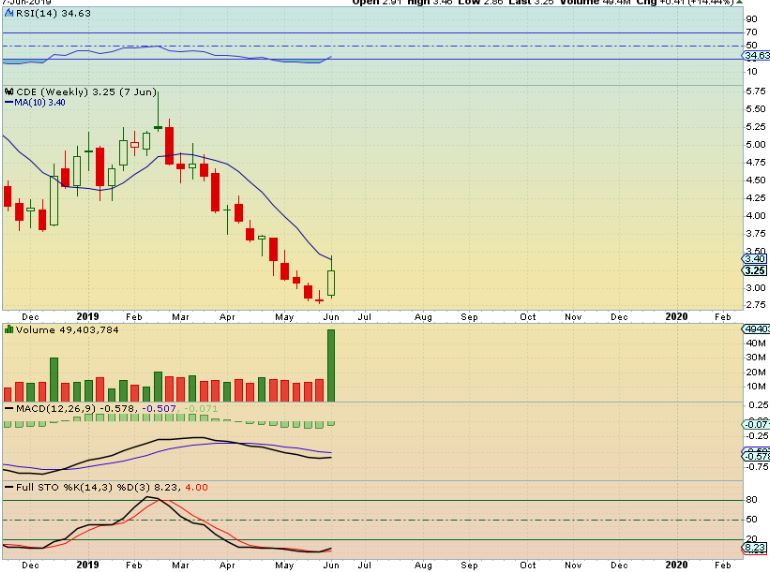
2) CDE ICL – Stare at this chart for a few seconds and then go to the next one.
.
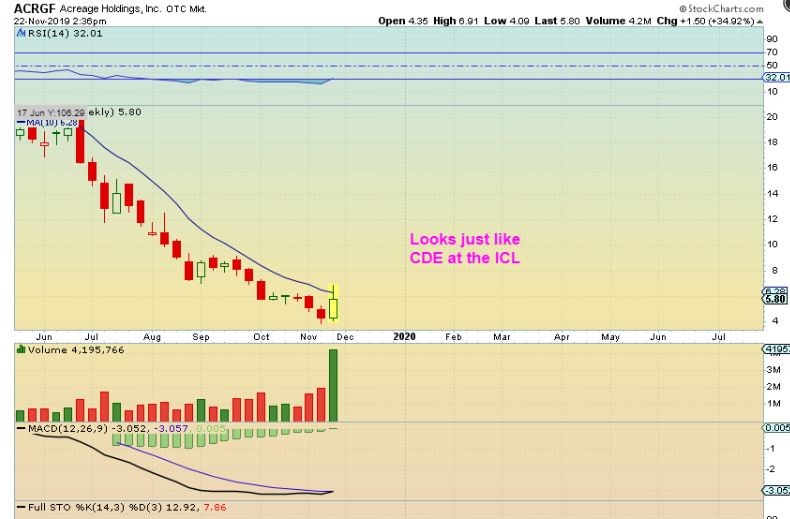
3 ) It certainly looks like CDE & ACRGF Weekly charts had that BULLISH INVERTED HAMMER PATTERN.
.
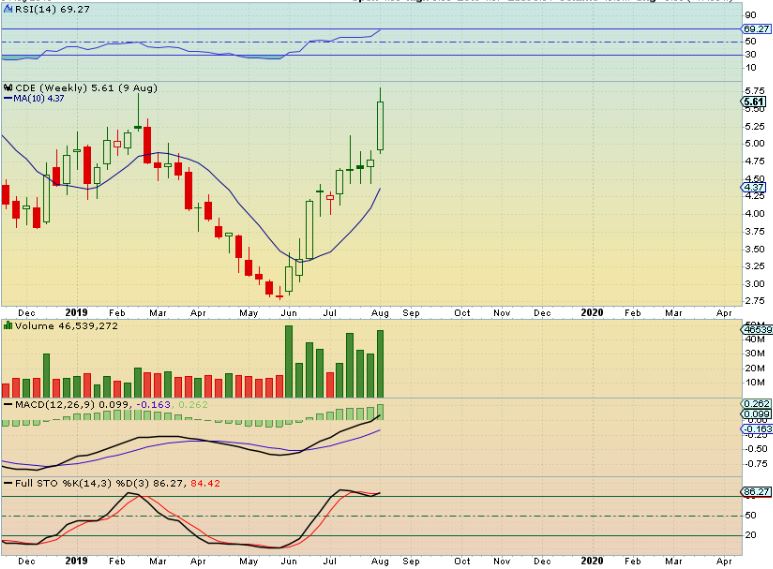
4) CDE RUN – It ran for weeks higher. A solid V-Bottom actually. I’d like to see these MJ Stocks bottom and move higher like CDE did.
.
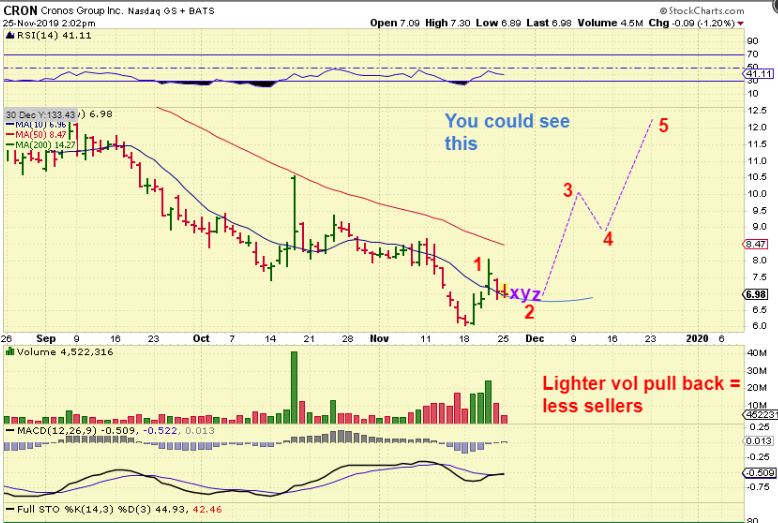
CRON – We would see something similar in several of these set ups. I drew CRON here with a possible crawl along the 50 sma, since I have seen that type of action in the past too.
.
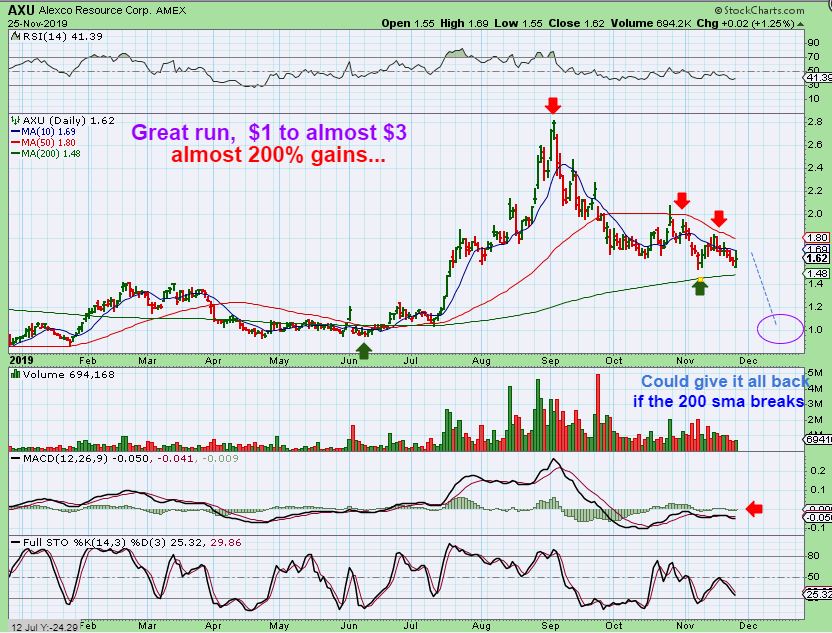
AXU – I was looking at AXU yesterday and realized that it has given most of its gains back. This could become a great buying opportunity at the next ICL. It ran from under $1 to almost $3 out of the last ICL. It has returned to the 200sma and could drop even further. For now, it is pinched between the 200 & 50 sma. A shake out at the 200 sma could be a H&S pattern.
.
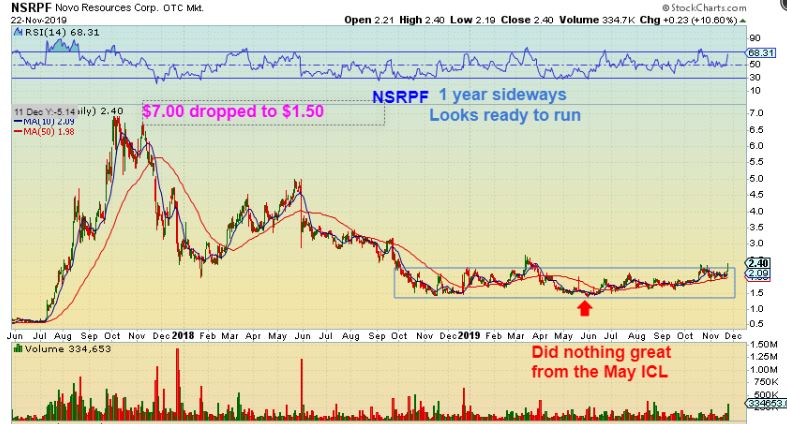
ANATOMY OF A BULLISH TRADE SET UP. I WANT TO REVIEW NSRPF.
.
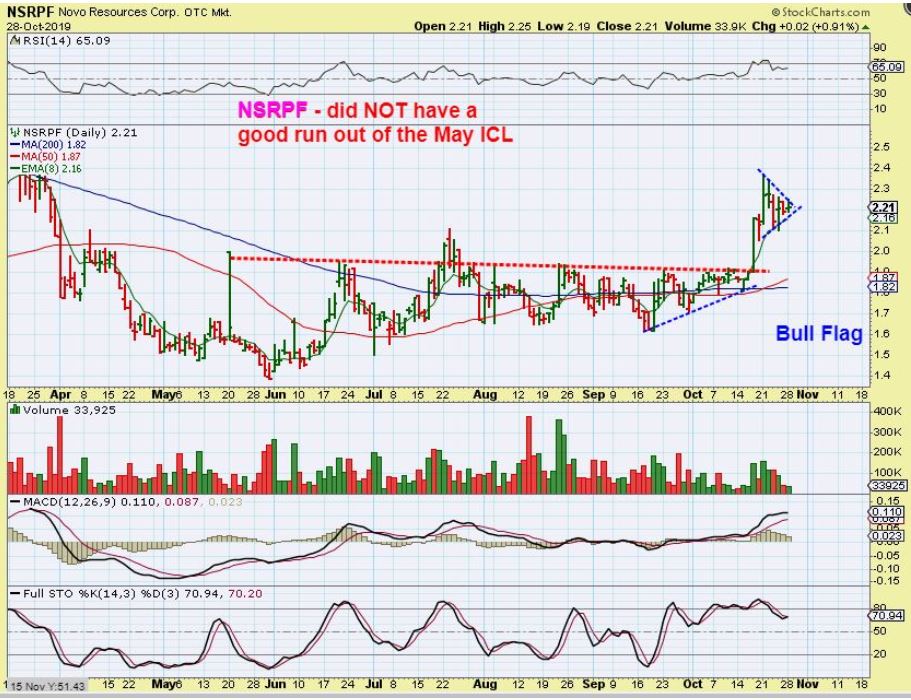
NSRPF OCT 28th – I posted NSRPF as having a tight bull flag at the end of October. It did NOT have a great run from May to September, so I mentioned that it could play catch up after popping from that base.
,
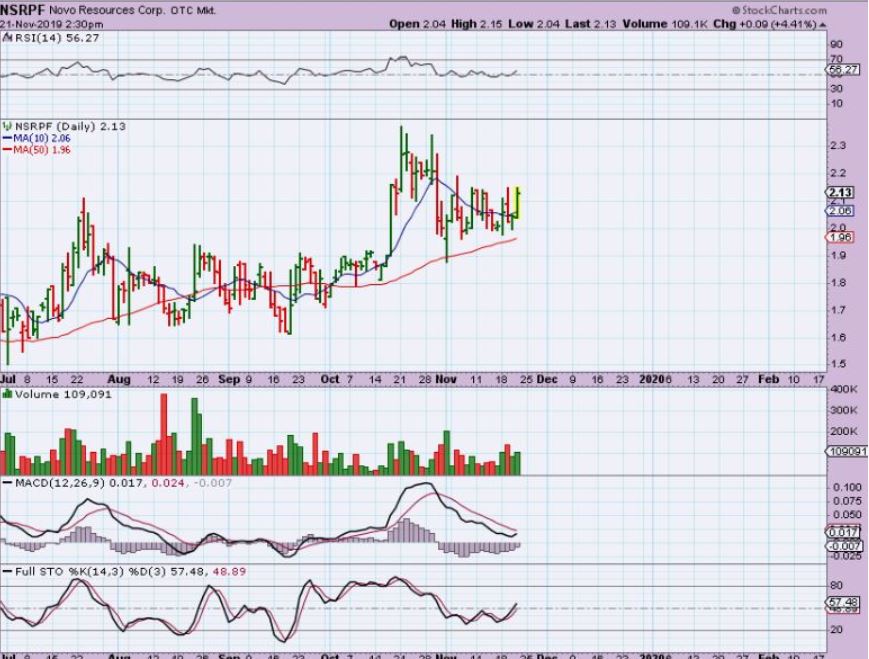
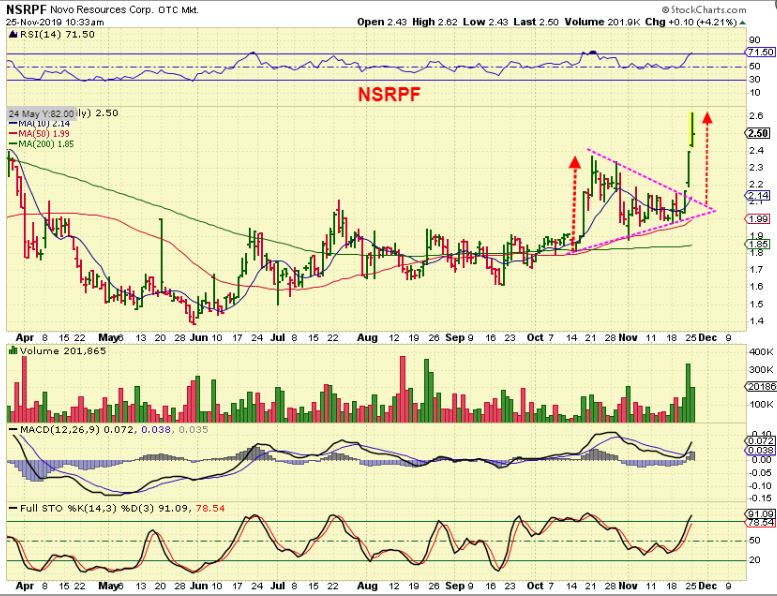
NSRPF NOV 21 – You can see that that Bull flag ( end of Oct) Actually broke down. I then pointed it out here as a triangle on the 200sma last week. This was midday and I saw volume coming in & price rising WHILE GOLD WAS DOWN. I could not find any news.
.
NSRPF – Friday & Monday saw NSRPF continue to break higher, but this has a $2.60 measured target, so I posted this in the live commenting area. THESE CAN EXTEND, but with gold down, this may be all we see for now. The blue arrows show the basic measure and…
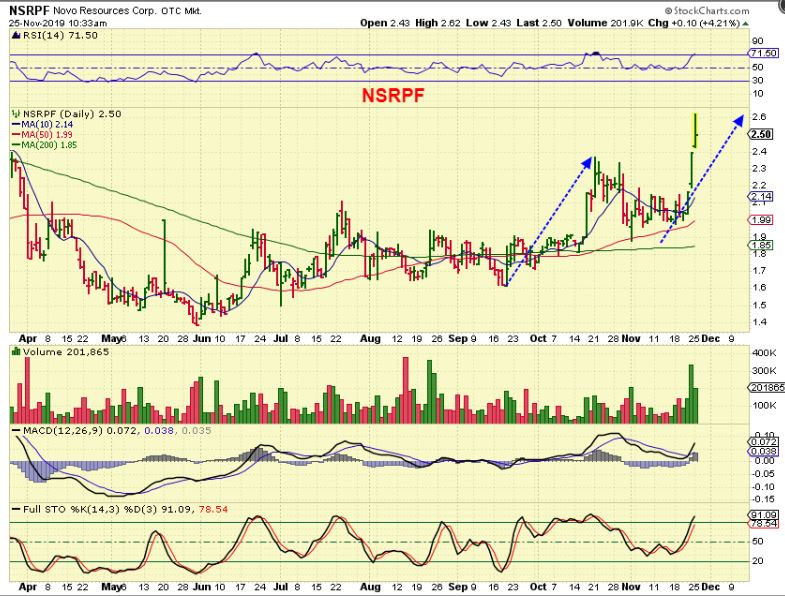
.
NSRPF – The Red Arrows show the other basic measure. Both get to roughly $2.60.
.
NSRPF – SO we MIGHT see a drop like this, since we have seen a drop like this to the 200sma after prior runs higher ( Especially if Gold pulls back now).
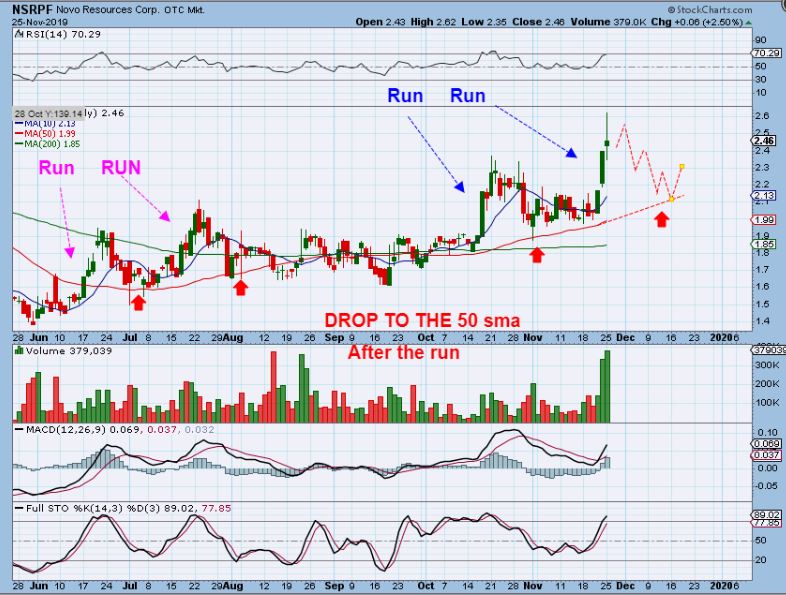
YOU WANT TO KEEP THIS ON YOUR WATCH LIST IF IT PULLS BACK, because of this base. You can just buy it here, but after that push higher, we may see a pull back to the 200sma again. THAT would be a great buy opportunity. ..