Friday November 8th
I found something interesting in the General Markets, so I’ll start by sharing that with you here. We all probably know how Fear & Greed usually run in the markets. When we see excessive fear, no one wants to buy , it looks dark & gloomy, and suddenly a low is formed and the markets take off higher. Then when there is no fear and people feel they are missing out and nothing is wrong, they buy & buy and suddenly a drop comes along and a sell off occurs. So we use technical analysis, Cycles for timing, and ‘sentiment’ to alert us to Greed & Fear to be able to monitor the conditions within the markets.
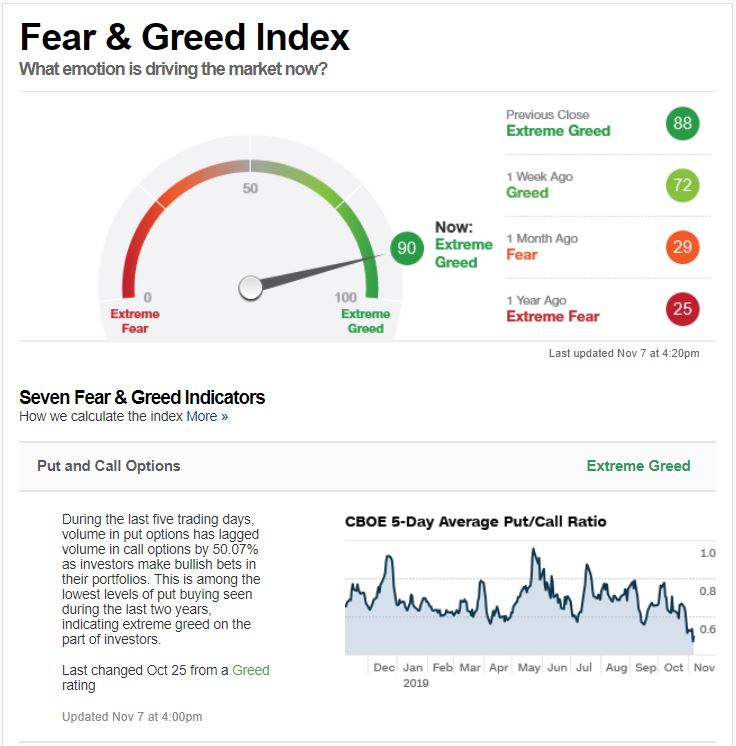
I have been seeing EXCESS GREED, which usually signals that a sharp sell off can happen. GREED is currently SO HIGH, that it looks serious & I wanted to research this further. THAT IS WHEN I FOND SOMETHING THAT I FIND VERY INTERESTING…
.
FEAR & GREED – You can see that the GREED is at 90, and that is uncommonly high, so usually I’d expect a market top any day now. We are also on day 25. With the Put / Call indicator at the bottom, it is the lowest level of PUT Buying in 2 years. Hmmmm…
,
.
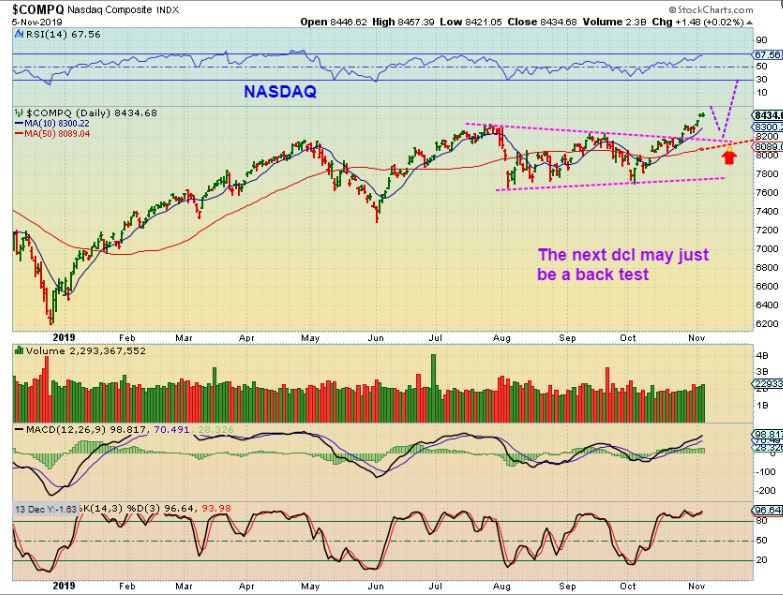
I have also discussed that a drop may just back test the recent break out, an on day 24 that drop can start at any time or it can start after day 30, I would still expect that. The question : Is this THE TOP or is that going to be a great buying opportunity? Well notice what I found when examining that Greed indicator of 90 further…
.
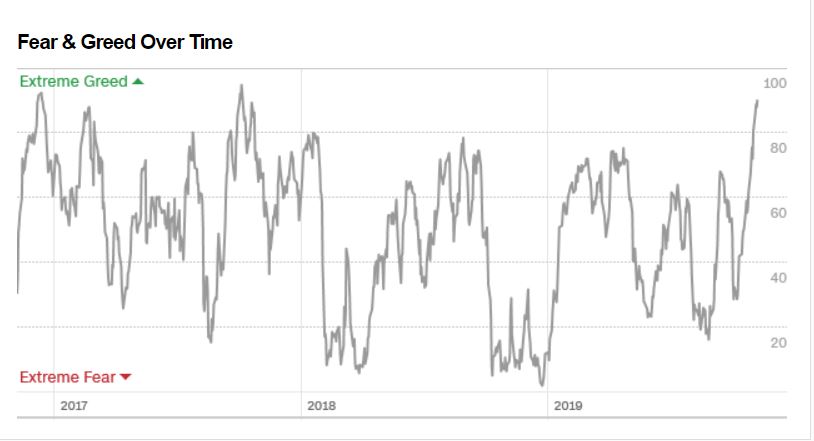
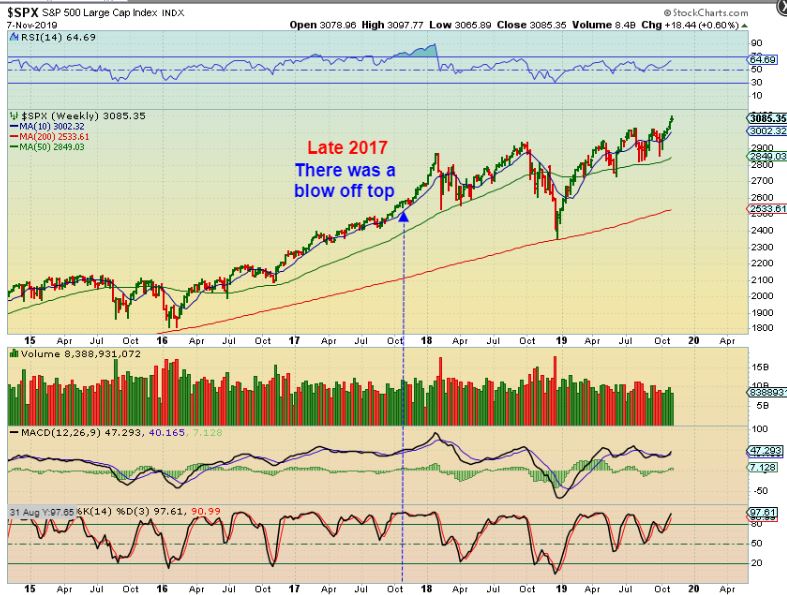
FEAR & GREED – Going back to 2017, the end of that year is the last time that I found Greed at this level. Notice how we are currently at 90 reaching near 100% now, and look back at what looks like OCTOBER 2017. That seems to be the last time the Markets hit 90. So I had to ask myself, ” I wonder what happened in the last few months of 2017 when Greed hit 90%? Did the Markets top & Crash??”
.
SPX– Look at September / October 2017 to the end of the year. Greed was 90% then too and the markets just rallied to a blow off top. I will discuss this in the weekend report, because I did a bit more research and found other factors, but I bring it up now because I was looking to possibly put on a short position with Greed at 90. Now I won’t. I do expect that we could get that back test, but I am not shorting at this point. And again…
.
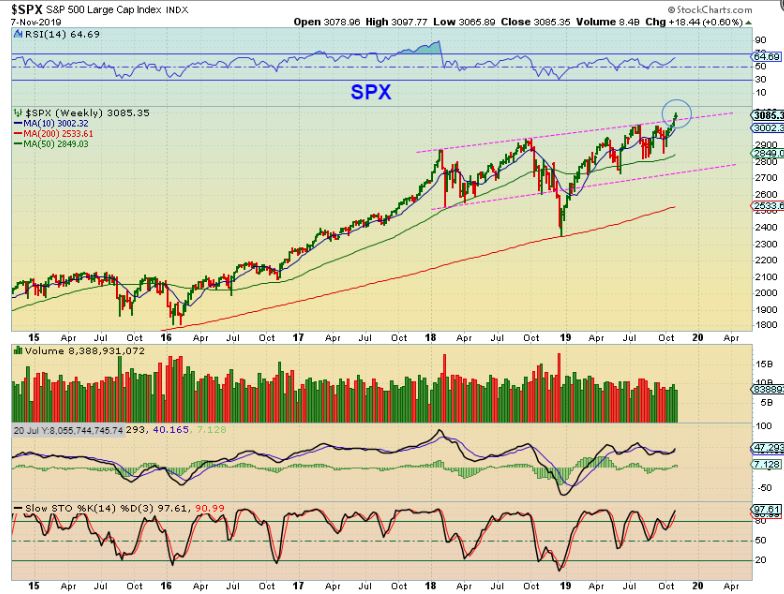
SPX – The General Markets are either doing a false break out & will fail with excess Greed, or it could start to ramp up higher like 2017. I will share more in the weekend report, but so far the recommendation was to keep raising stops and a drop to a dcl will eventually take you out of the trade. Re-buying a back test may be a great opportunity to catch a bull run parabolic blow off top type of an event. I FOUND ONE OTHER FACTOR- and will share that in the weekend report.
.
.
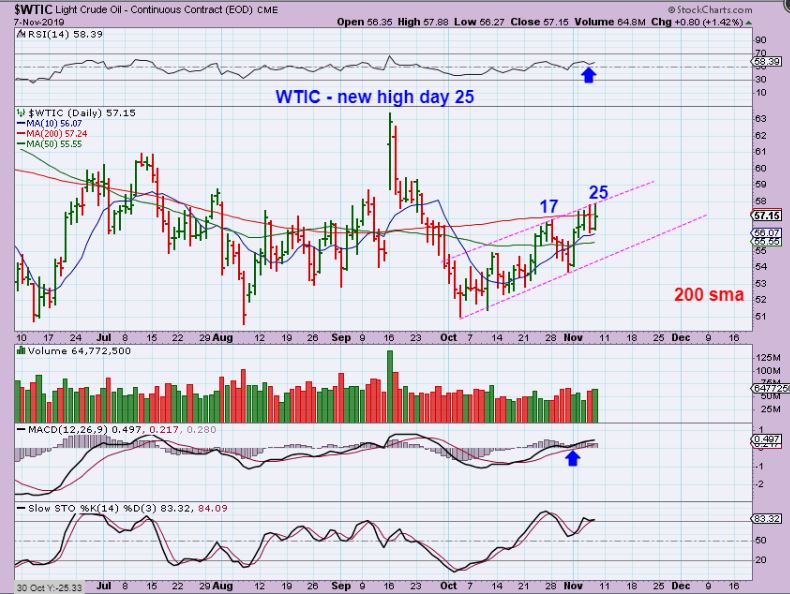
WTIC – Choppy Oil is still trying to break that 200sma. It did this in August & September too, but failed. This does look bullish, so we’ll see if it can break out and maybe back test that 200sma on the next dcl. Then OIL would be a good buy in that area. Some Oil stocks seem to be bottoming.
PRECIOUS METALS
.
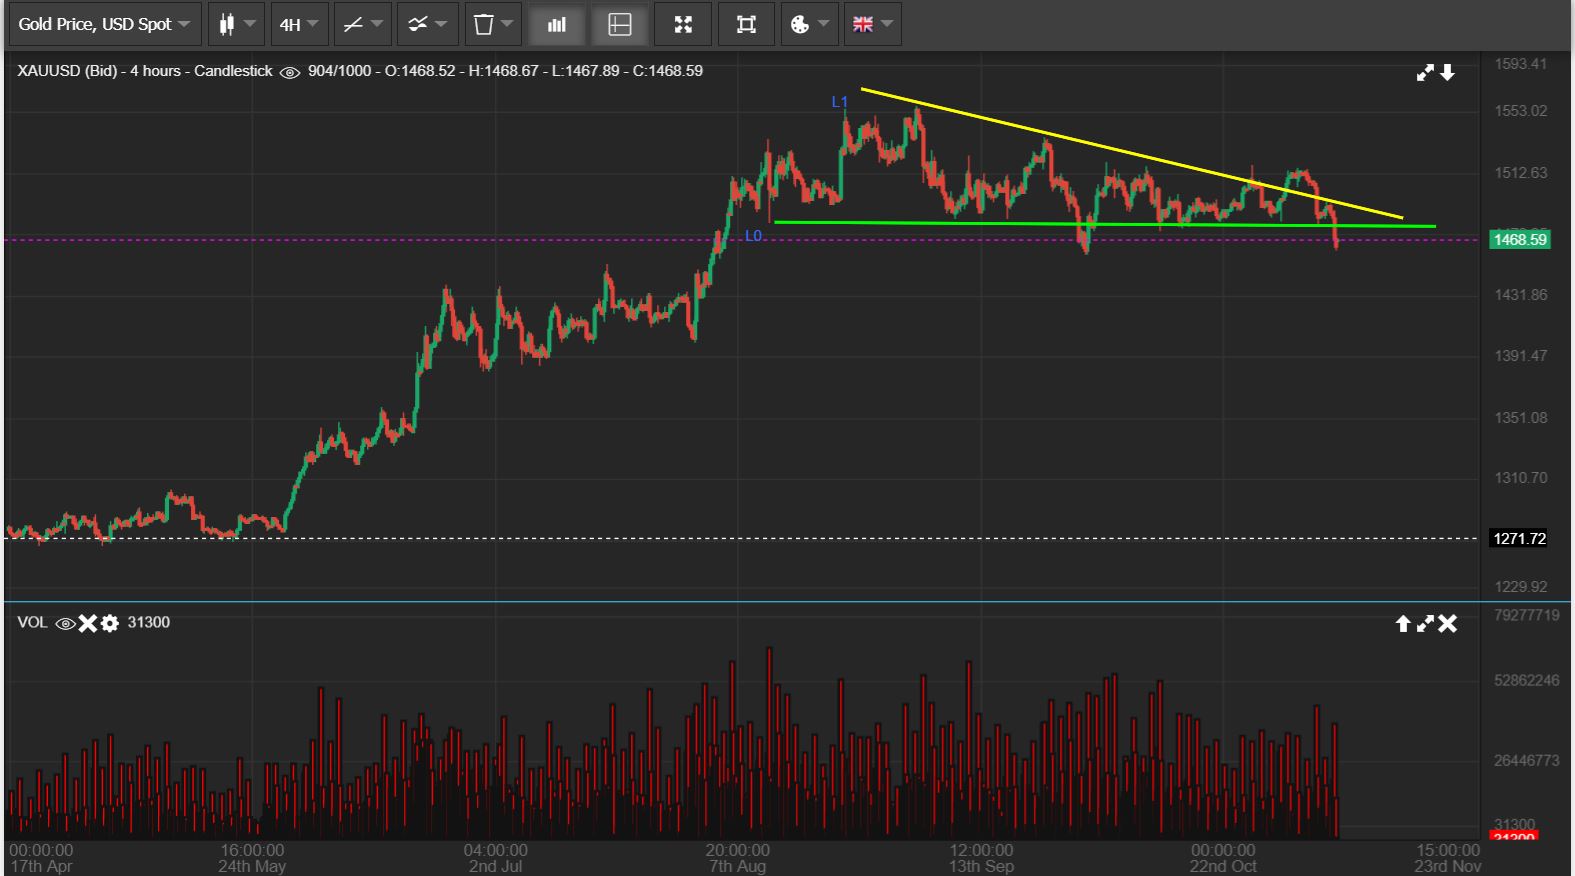
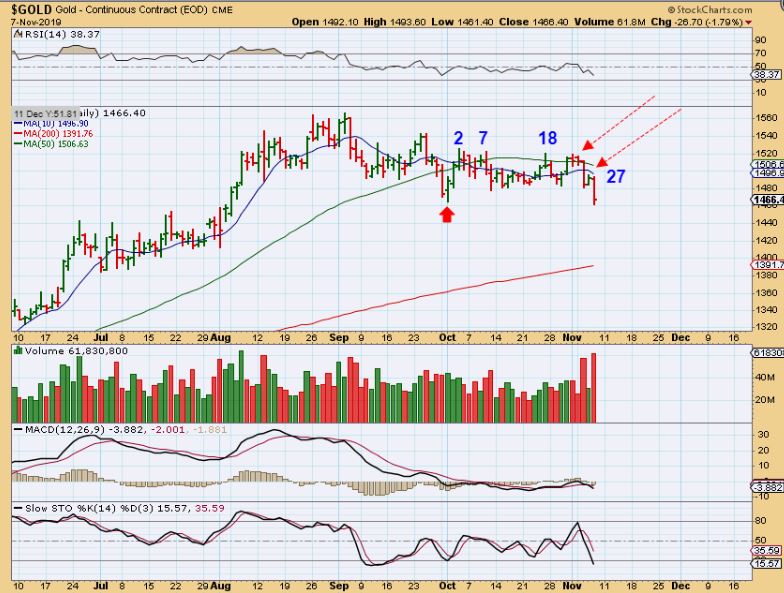
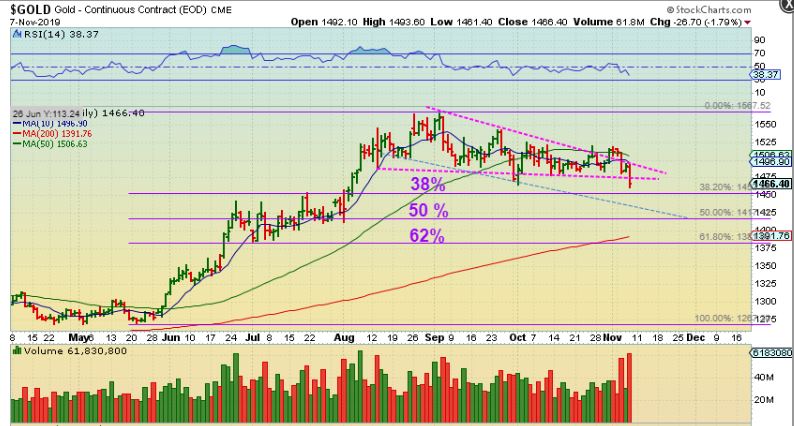
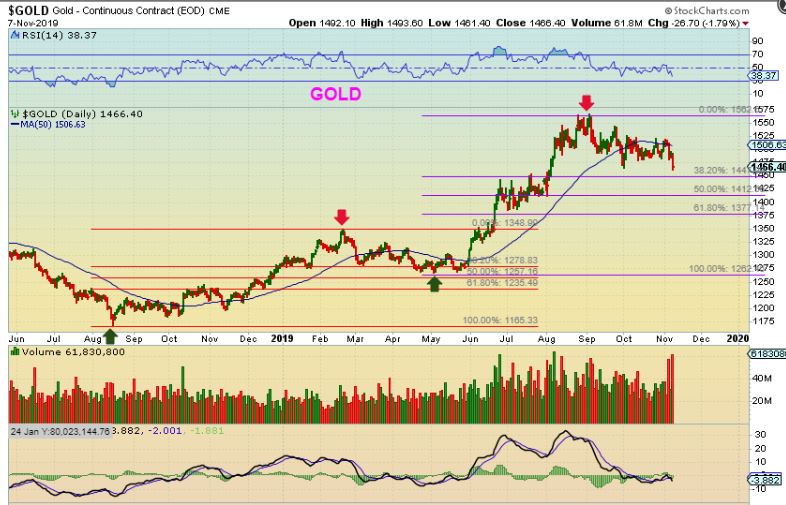
GOLD – Just a glance at this chart shows you that Gold has been choppy & sideways, consolidating recent Bull Run gains for months. This is impossible to trade day by day, and so it has frustrated both Bulls & Bears looking for a direction.
.
GOLD Review
1. I have been drawing a triangle and we saw Gold break out about 7 months after the last ICL. It seemed too mild to be an ICL, but
2. 7 months is within the timing, and a Triangle broke out, so
3. I had to go long. That set up will normally take off higher.
4. Gold fell back inside as a false break out on Tuesday. NOW DO WE GET A NORMAL DROP INTO AN ICL?
NOW DO WE GET A NORMAL DROP INTO AN ICL? Maybe we do and an ICL could come 7 months after the May 3 ICL.
.
GOLD -If I lower that lower trend line to 2 areas of ‘touch’, we could see a drop continue, but this has been choppy and tricky, so we’ll just have to see how this plays out. Knowing where we are in the stream of time may help us to guage the ‘timing’ for a low (dcl or ICL), so where are we timing-wise? …
.
GOLD – The Red Arrow is a clear low. It doesn’t show up on GDX or GDXJ, but GOLD & SILVER Show that OCT 1st reversal as the low. From there, we are on day 27. Since I often see daily cycles run 32 days, or 34 days, or even 36 days, MY recommendation is not to go long yet. Waiting for a dcl/ICL can save you frustration. I closed my HL on the Tuesday drop as it was near the highs, and closed my longs ( I owned a starter of JNUG) too. If this can drop for 5-10 more days, I do not want to ride that down.
.
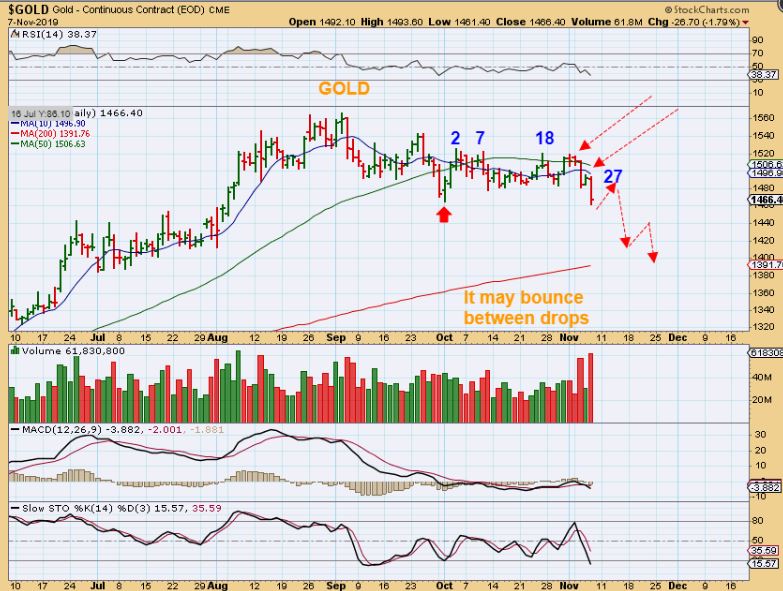
GOLD – We could see something like this if selling picks up. Little bounces here & there will have people calling a bottom & they may call it a buy. Eventually it will become one, but waiting for a swing low reversal is less risky. Does it have to drop to the 200sma? Not really…
.
GOLD – Gold is nearing the 38%, and that is a support area from the July consolidation, so it MIGHT stop there. A drop to the 50 & 62% would bring it to the 200sma. Any of these could be valid. Let me show you one more thing…
..
GOLD –
A) Tagged that 50 sma repeatedly in Feb to May drop to an ICL, but that drop was Choppy, Sideways, and Frustrating too. It only dropped 38 – 50%, and that low was tricky too.
B) A repeat of THAT may be what we are seeing now. Gold tagged that 50sma a few times already here too. We could be close to the low here, but this weeks drop on day 25 & day 27 may be the start of the final drop.
.
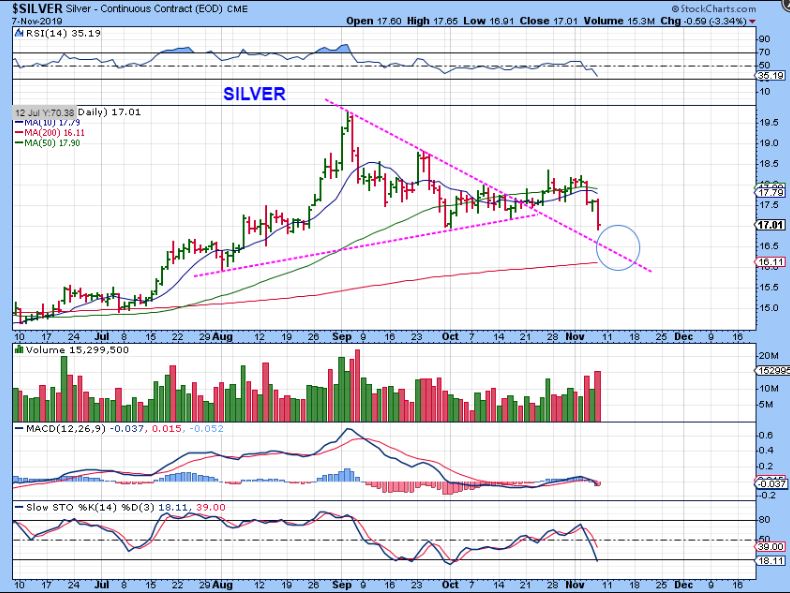
SILVER – And Gold was not the only one that dropped. Silver also dropped on day 25 & 27. Silver COULD drop to the 200sma and simply be a back test of the down trend line that was broken in October. Volume has increased on the drop.
.
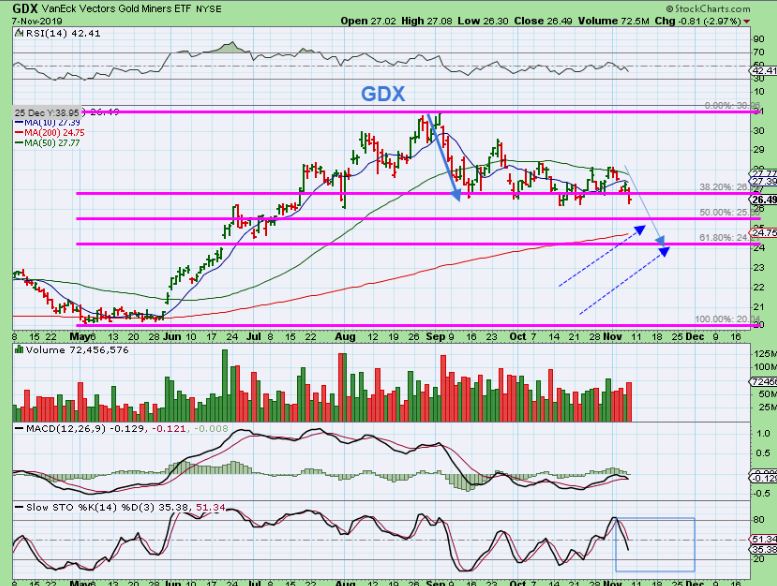
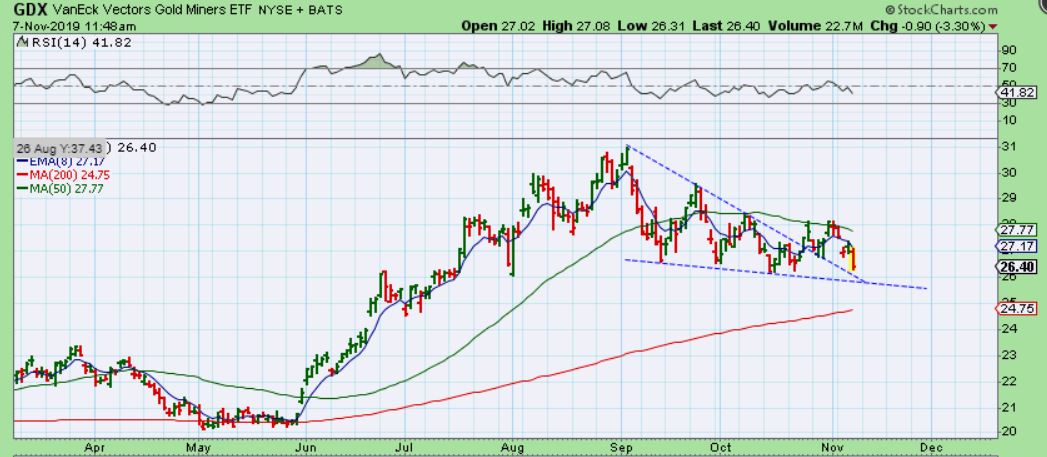
GDX #1 – GDX FIB LINES are given on this chart, so we could see Miners drop further too. The stochastics is not oversold yet.
,
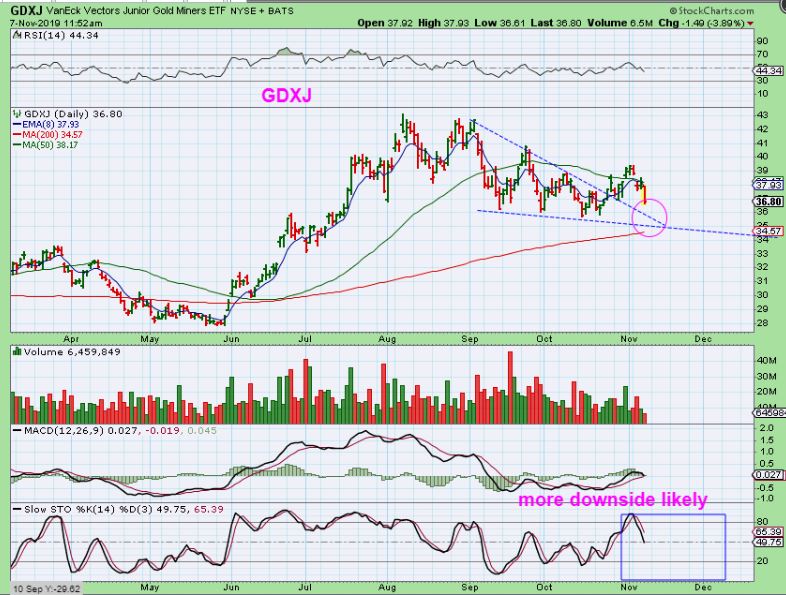
GDX #2 – GDX was rejected at the 50 sma twice, which is what I originally thought we’d see, but when GDXJ finally closed above it, it looked like a Buy .
,
GDXJ – So GDXJ closed above the 50 sma and Tuesday it broke back below it ( Fake out). I closed my long positions and this could drop further, Possibly to the 200 sma. Read the chart.
.
GDXJ – As I was leaving to meet someone for lunch, I was asked about buying at a back test of the trend line. My reply is that you can try, but it can just bounce down the trend line, as shown here. I said that I’d draw a chart of that, and here it is. Buying a back test may not work with GOLD & SILVER on day 28.
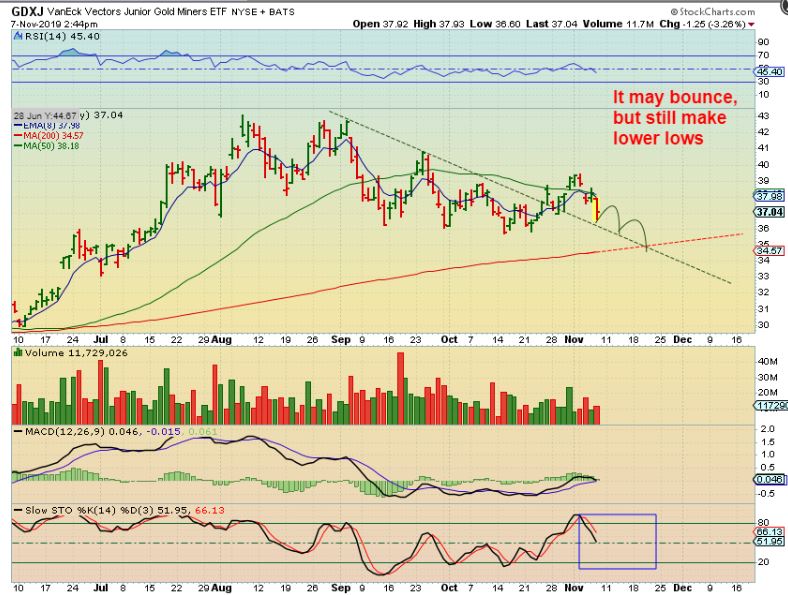
.
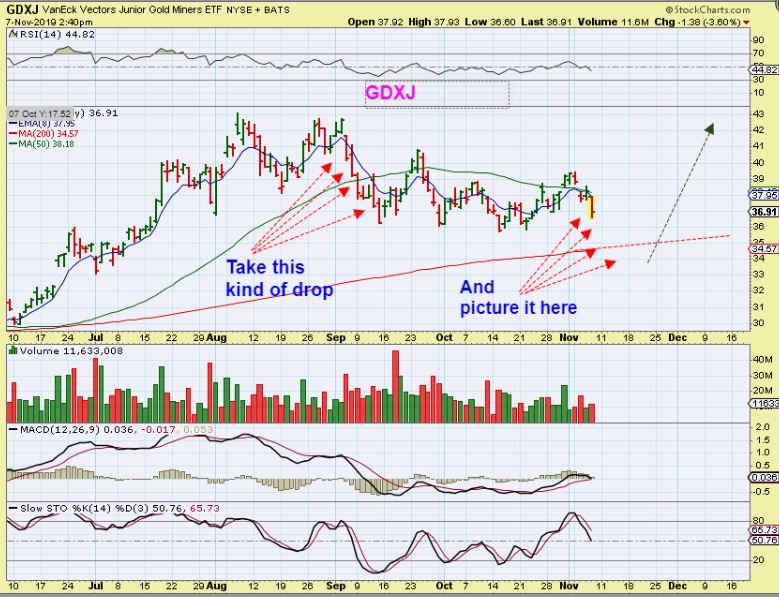
GDXJ – The selling in early September was a solid week of sell off. I wouldn’t be surprised to see that now, and that could drop this to the 200sma too. That is a normal back test in technical analysis, so why not expect it.
.
This is what we have so far in Precious Metals:
– The charts were triangles in the precious metals, they can be bullish continuation consolidations.
– Gold, Silver, and Miners all broke higher through down trend lines and GDXJ even closed above the 50 sma.
– It looked like a Mild ICL could be in place, especially since many Miners started rallying & some were at highs as GDXJ closed above that 50 sma
– That GDXJ close above the 50 sma was an opportunity to ‘Buy with a tight stop’. See the above chart and you’ll see that that lasted 3 days above the 50 sma.
– Tuesdays sell down day was a warning, Wednesday bounced, and Thursday continued down. That starts a day 25 sell off in Gold & Silver and we are now on day 28.
We’ve been here before and if it feels bad, it is not. This is actually very good if we can get more of a clear sell off in precious metals. Bulls will be upset, many will feel that ‘something is wrong, the bull run is not going to happen’, and then a low can form (ICL) and a rally can begin. Identifying an ICL and riding it out of the lows is one of the best trades out there, and we may now be on the way to seeing a more clearly identifiable ICL. We had a drop Tuesday, a bounce Wednesday, and another drop Thursday, so it may not be straight down, but the 2 drops were pretty big, so it is best to let it play out.
.
We’ll see how this sell down plays out over time, and I will cover more in the weekend report. I will have a few quick trade ideas below, but it is Friday and some may just want to rest up into the weekend. Enjoy your Friday !
.
~ALEX
.
Steel, Aluminum, & Copper stocks are still acting correctly, like they are bottoming, so lets review a few charts.
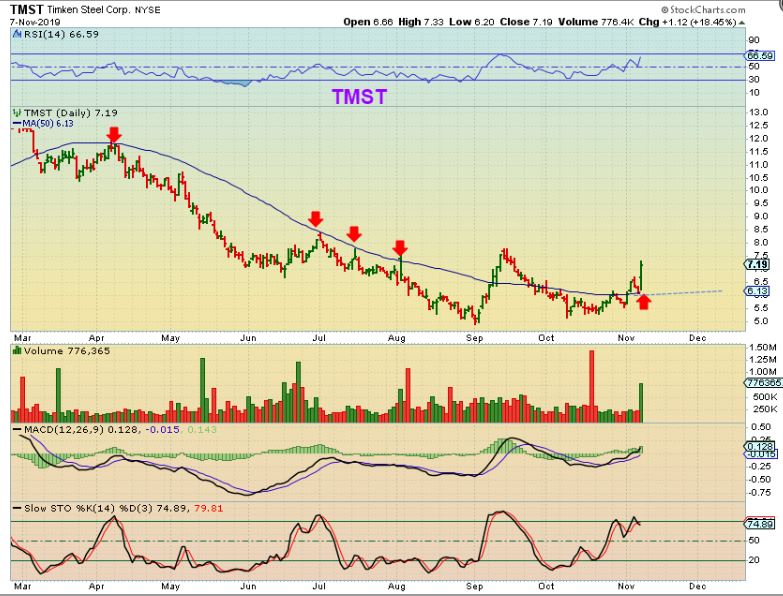
TMST – ‘X’ was discussed recently as a Steel stock that popped. Now Timken Steel Popped 20% after already putting in higher lows and regaining the 50sma, so the sector has further proof that things may be improving. I would definitely buy a bull flag if one forms, but this also may just keep running.
.
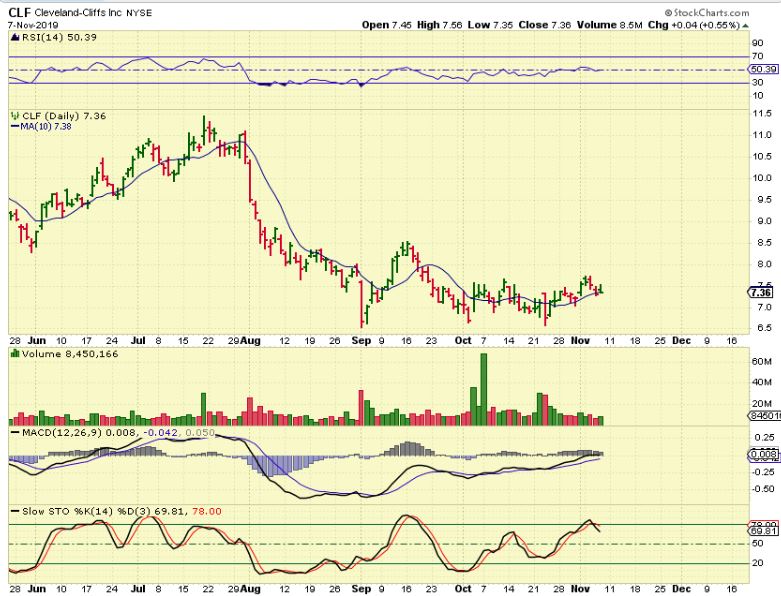
CLF – As always, watch for earnings release, but CLF seems to be rounding at the bottom, above the 10sma. The MACD is bullishly aligned.
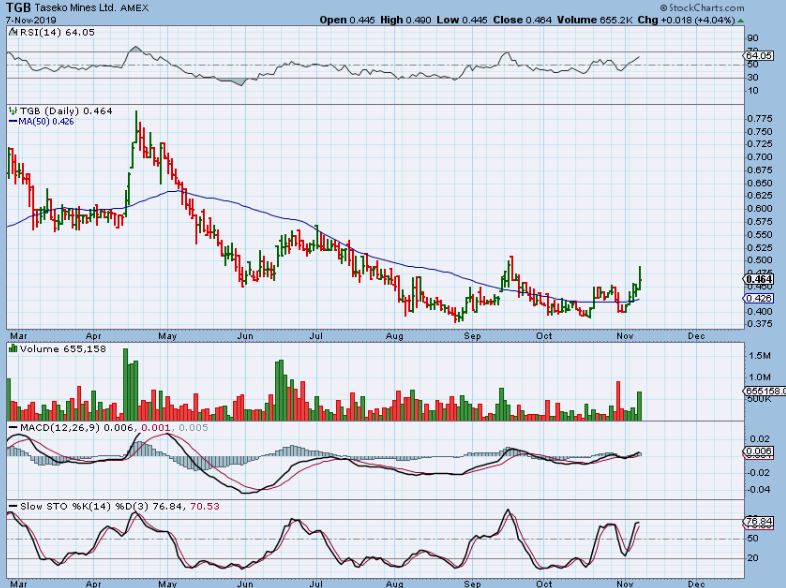
TGB – TGB broke higher yesterday after releasing earnings. With earnings out, this is a buy, though it may be choppy and still bottoming.
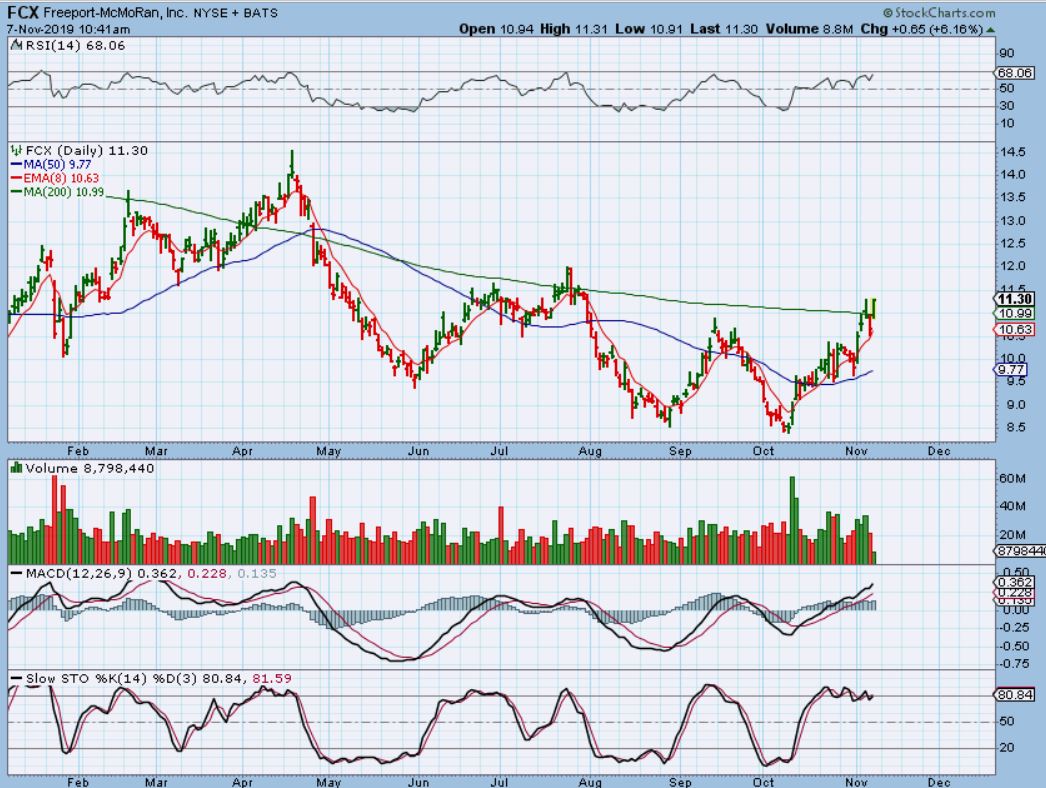
FCX – FCX was pointed out above the 50 sma, and now it broke above the 200 sma. So we are seeing steady improvement in the Metals area.
.
.
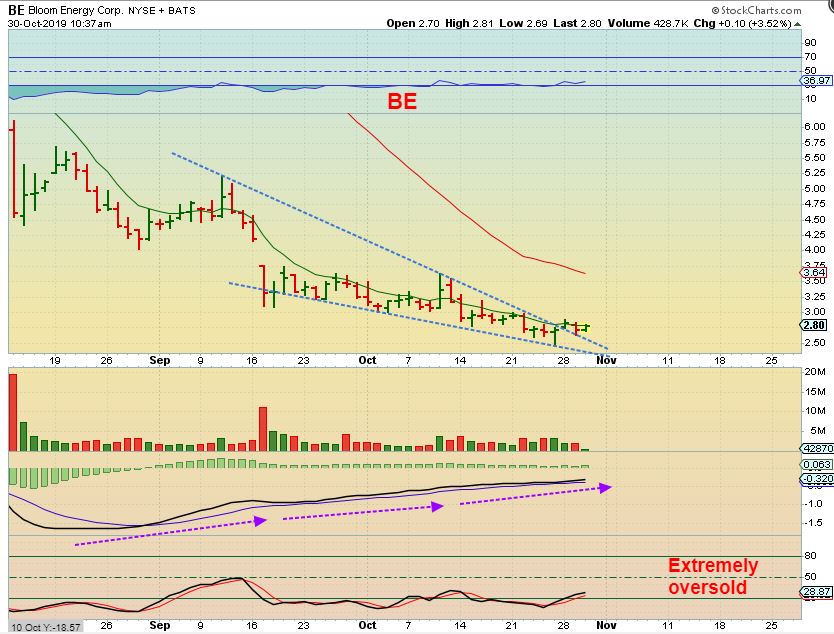
BE – I posted this at 10:30 on Oct 30 – This was a buy at $2.80, or wait for it to get above the 10sma, but it was a break of a bull wedge.
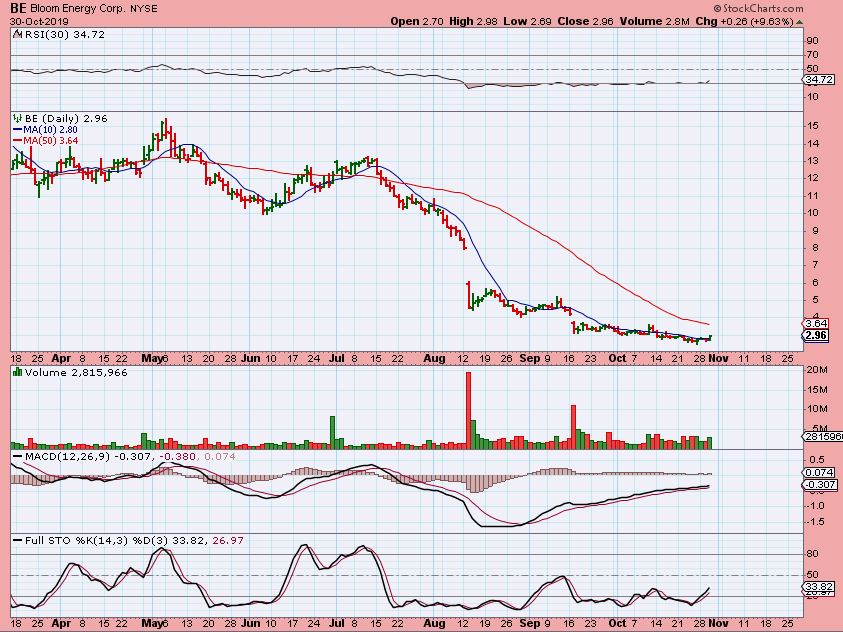
BE – It was pushing higher , now near $3. This moves fast, but I loved that base.
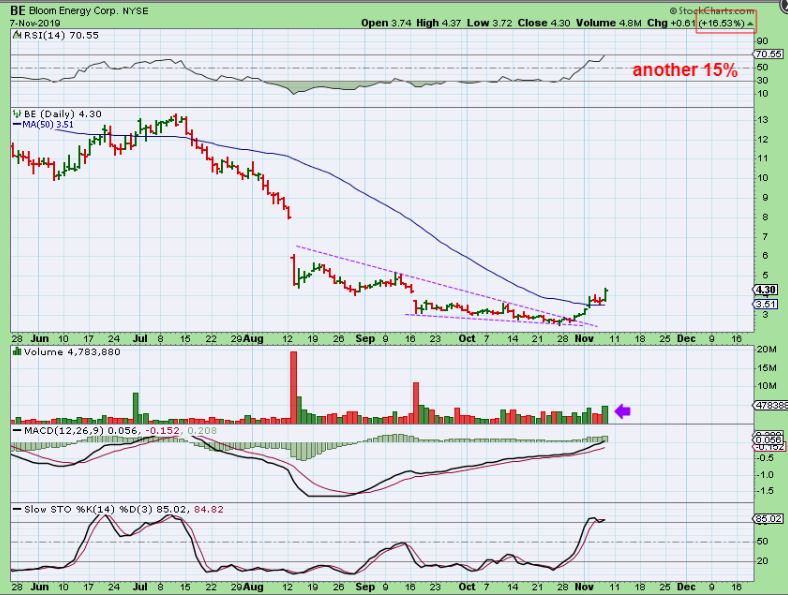
BE – I posted a few more charts since then, and it stalled at the 50 sma. EARNINGS CAME OUT NOV 7 & it got a 20% pop. Now it is up almost 100% from the lows and looks to be bullishly breaking higher. The potential is great, so if you bought it, I think it can be a buy & hold with earnings already out. Buy a dip if it pulls back to that 50 sma over time
,
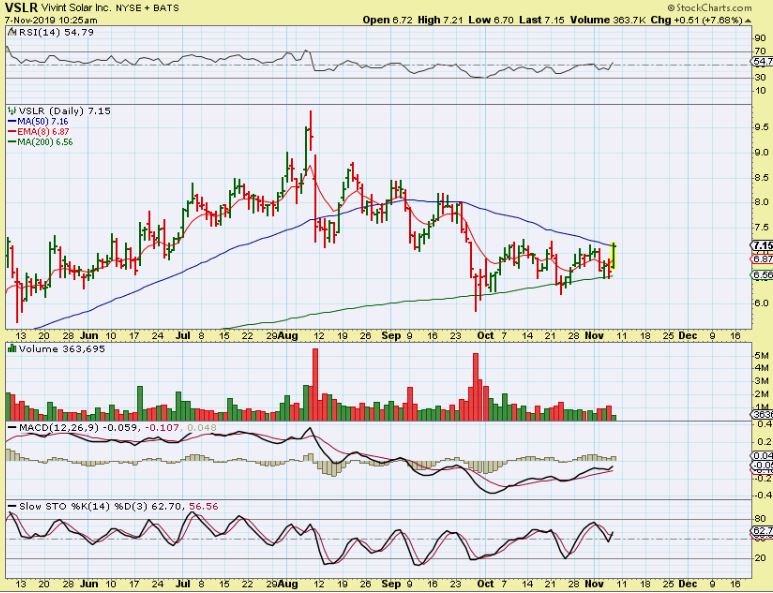
VSLR – VSLR and other Solars sold off and now look to be bottoming too. VSLR bounced off of the 200 sma 3 times, so it could at least be bought with a stop under the 200sma now.
,
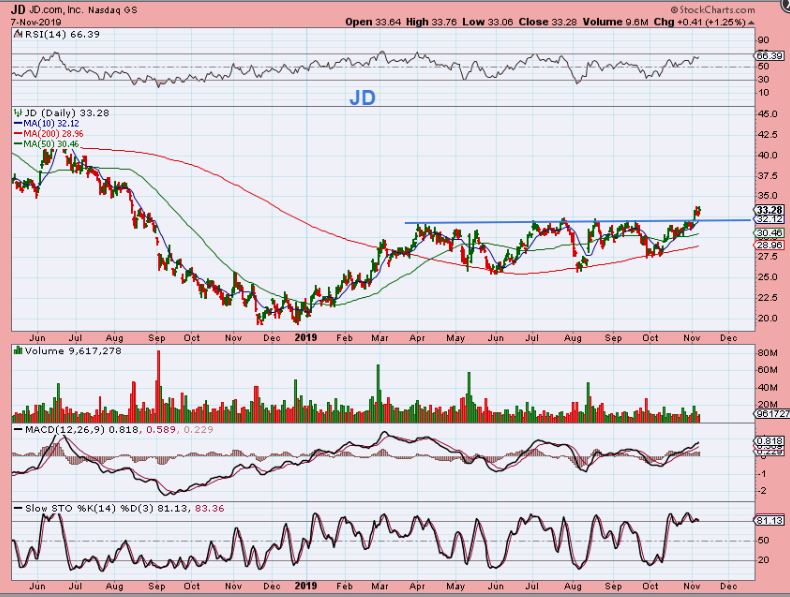
JD – I posted JD days ago, it is still acting correctly
.
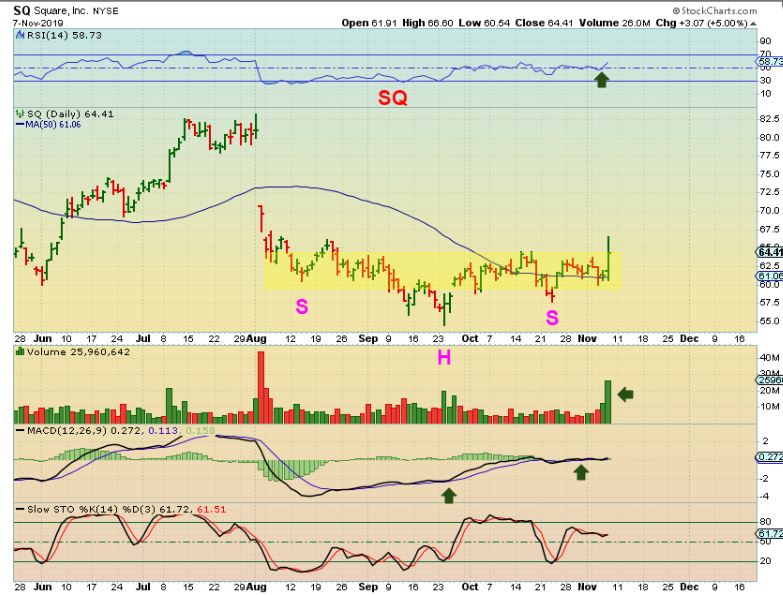
SQ – SQ popped off of the 50 sma after earnings and looks ready to run. It also can be bought with a stop under the 50 sma