Friday November 22
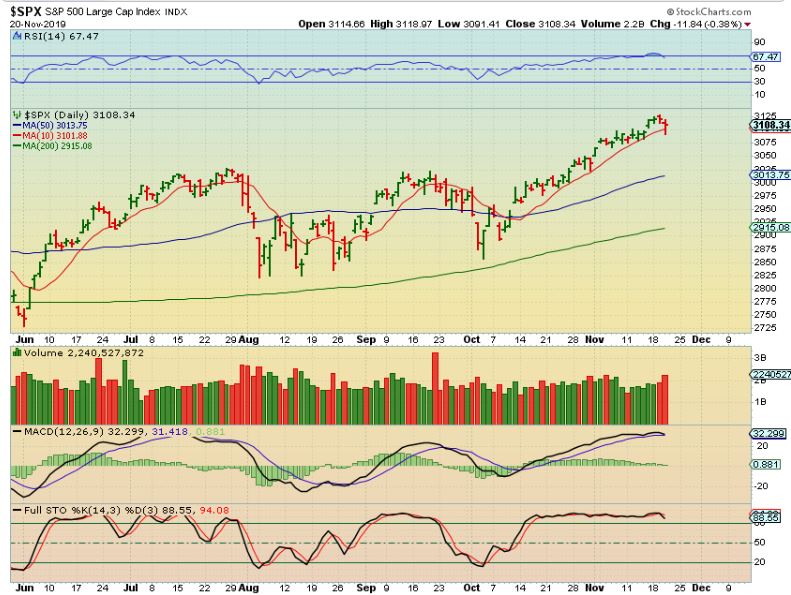
FROM THURSDAYS REPORT SPX – The SPX dropped & slightly broke below the 10sma on day 34, so we see a swing high here. It started to recover, but this could finally be the signs of topping anticipated.
.
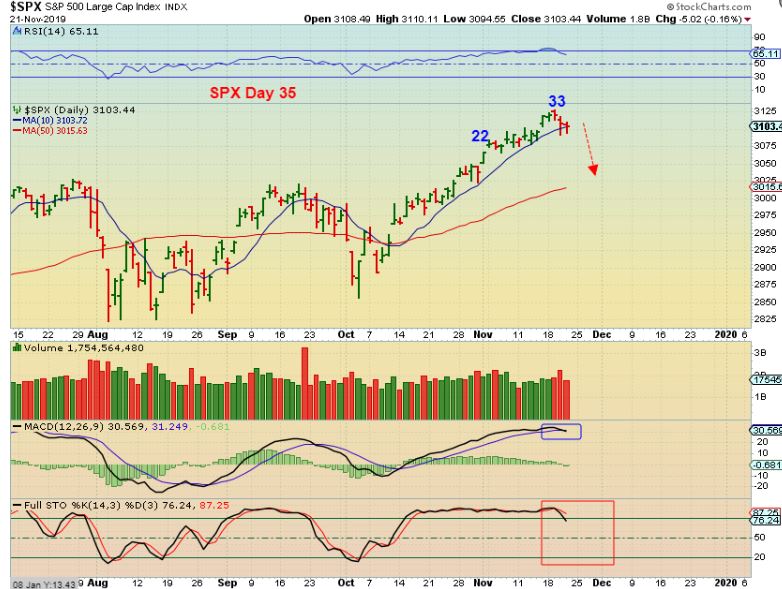
SPX CURRENTLY – We had the same thing to day. It is hard to get the selling going in a bull run, but eventually I think that the ‘Buy The Dip’ crowd will see a pull back. This is day 35, and it is due for a dcl. HOW DEEP? We’ll have to wait and see.
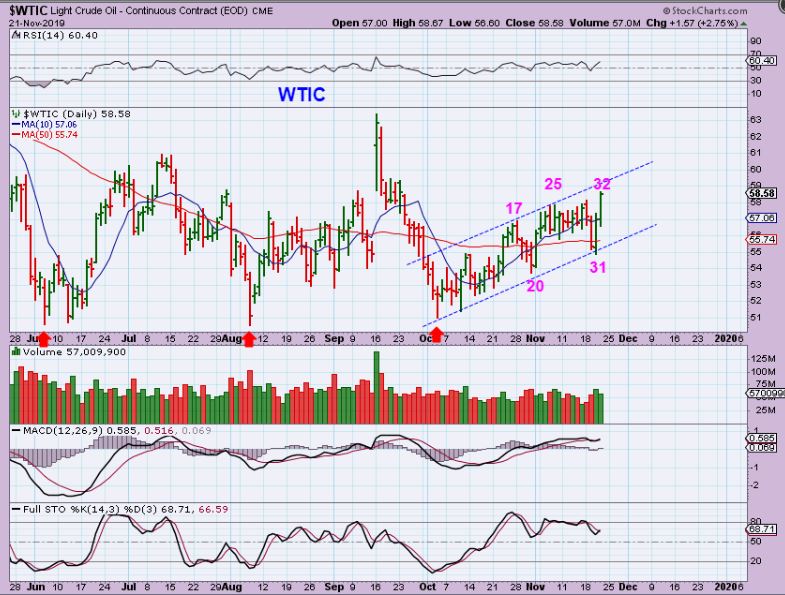
WTIC – Oil broke to a new high for this daily cycle on day 32. It is back above the 50 & 200sma again and the volume looks pretty good, but it has been choppy. We’ll see if it can get the follow through from here, but it has been trapped in this channel so far. Oil daily cycles can be 40 to over 50 days long, so this is starting to lean toward a R.T. Daily Cycle.
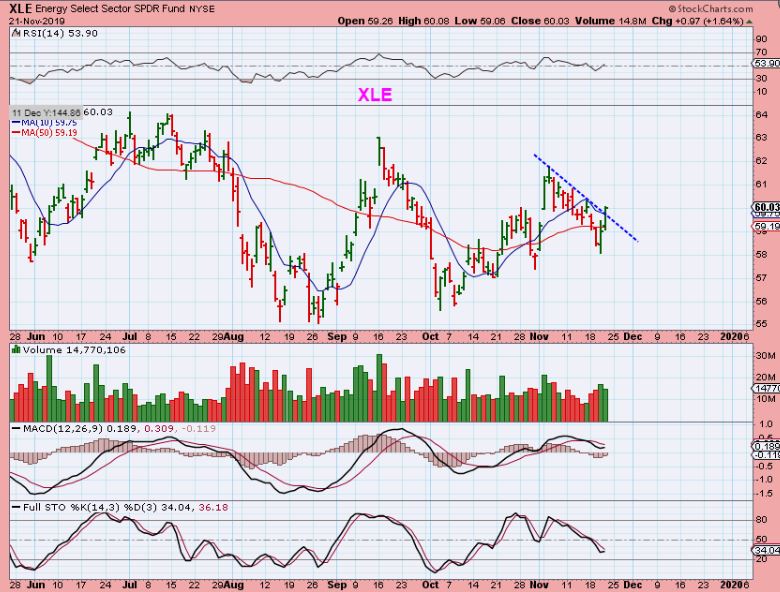
XLE – The XLE regained the 50 sma and is starting to break a down trend line. The reversal could have been be bought with a stop under that days lows 2 days ago, or this can be bought with a stop under the 50sma ( as long as one knows that the sector has been very choppy lately). I Don’t own Oil / Energy.
.
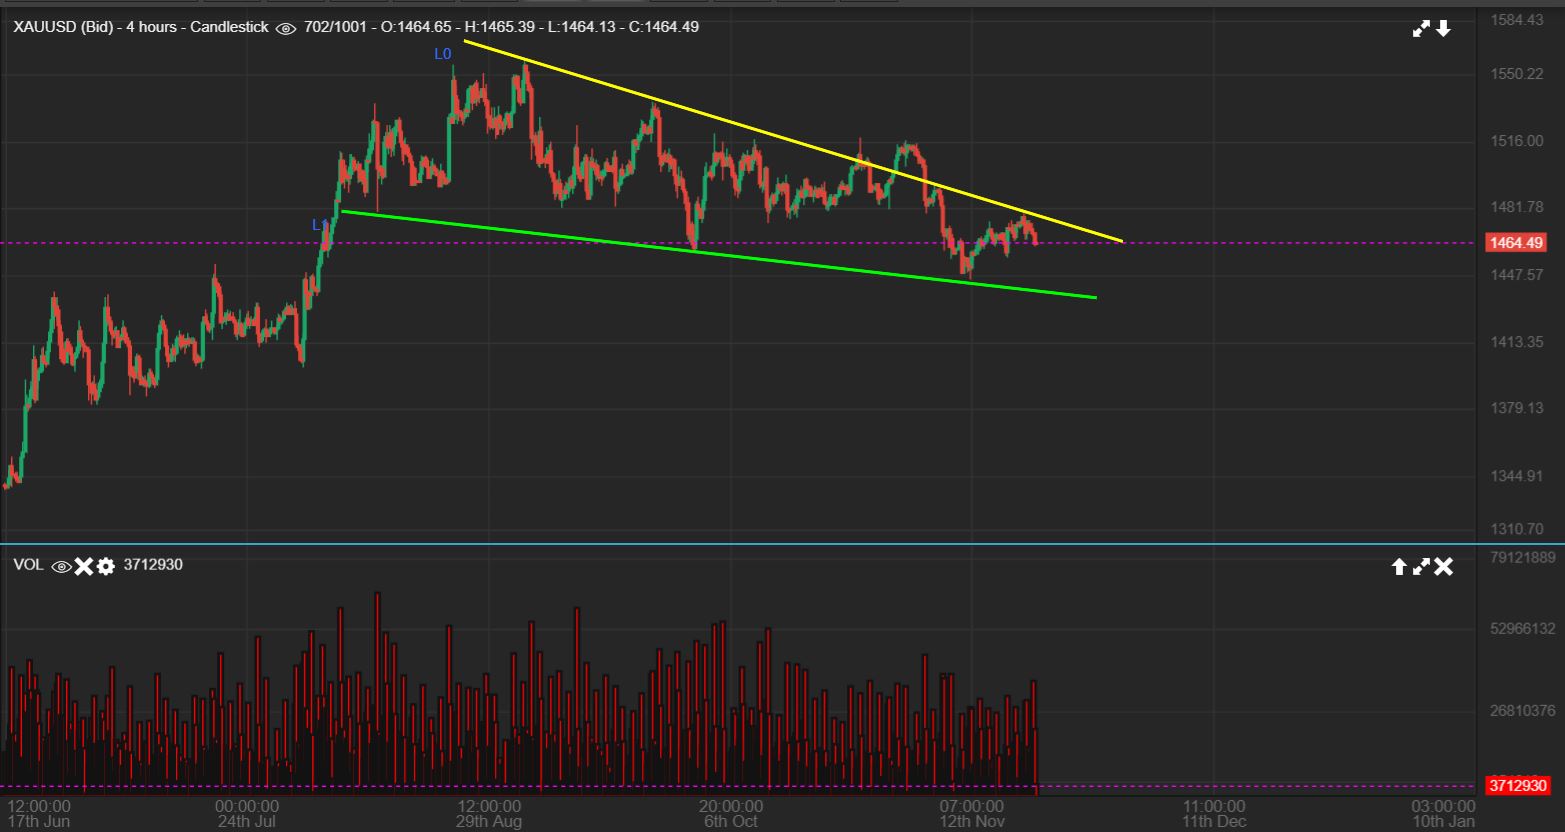
GOLD 4 hr – This is my ongoing 4 hr chart. Gold stopped at the top of that wedge trend line. We had a false break out in the last daily cycle, and now we have resistance. Now let’s go to the daily chart.
,
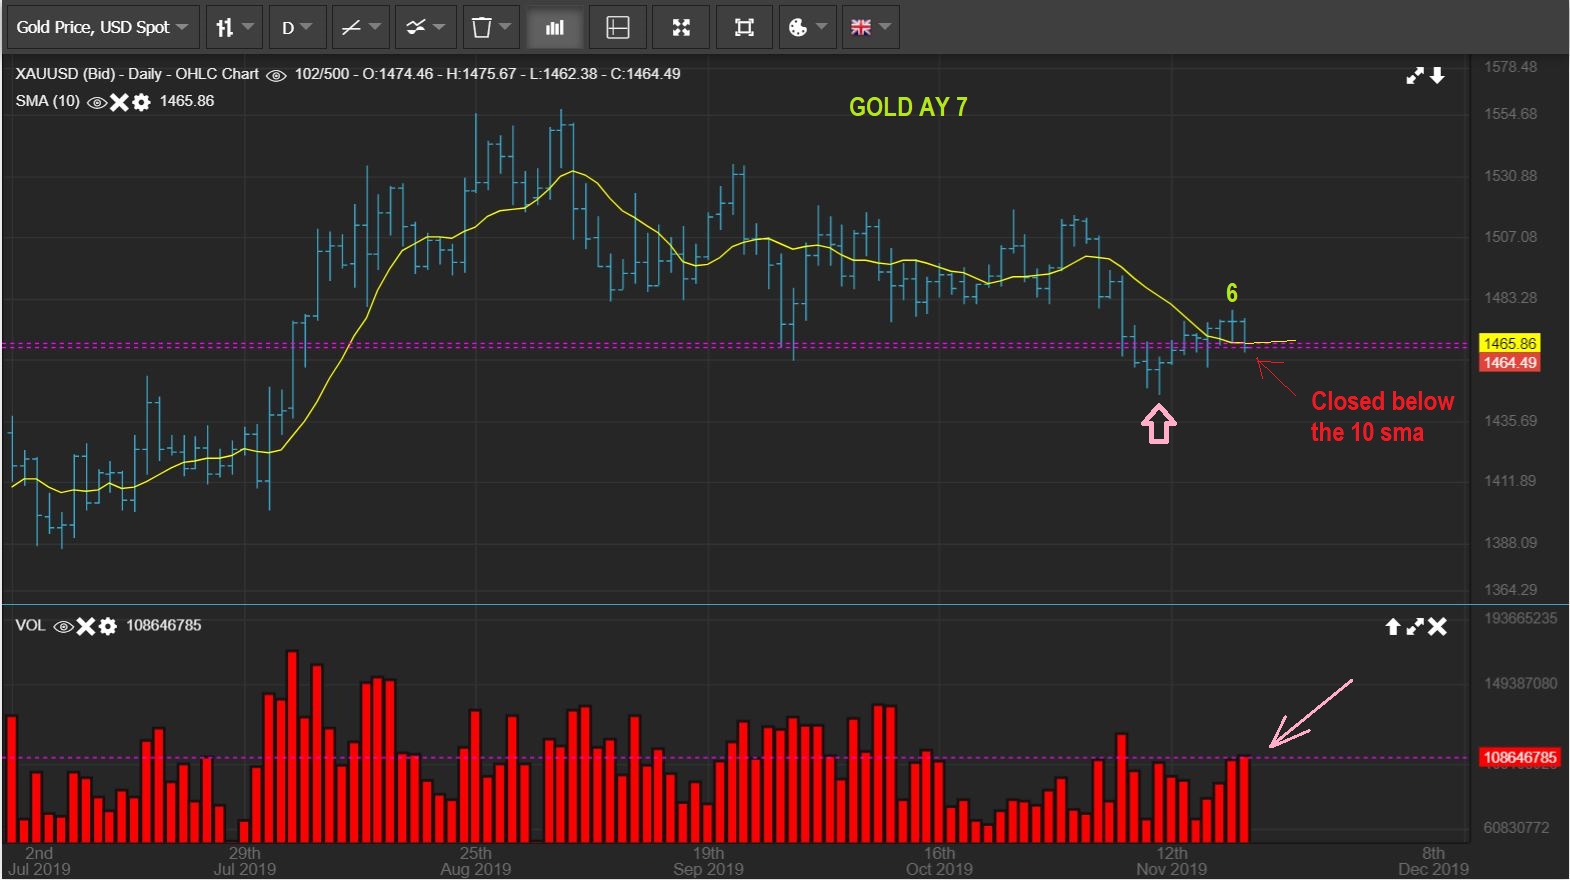
GOLD DAILY – Gold closed slightly below the 10 sma on day 7, and day 7 would be the time that we would see if Gold was going to top L.T. That said, even though we don’t like to see a close under the 10sma, it can happen and Gold can still hold above the lows…
.
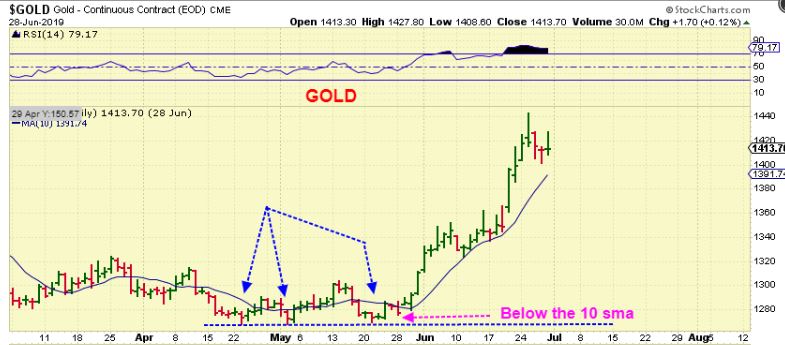
GOLD DAILY – Gold broke the 10sma and never broke the lows in several different choppy patterns of the past.
.
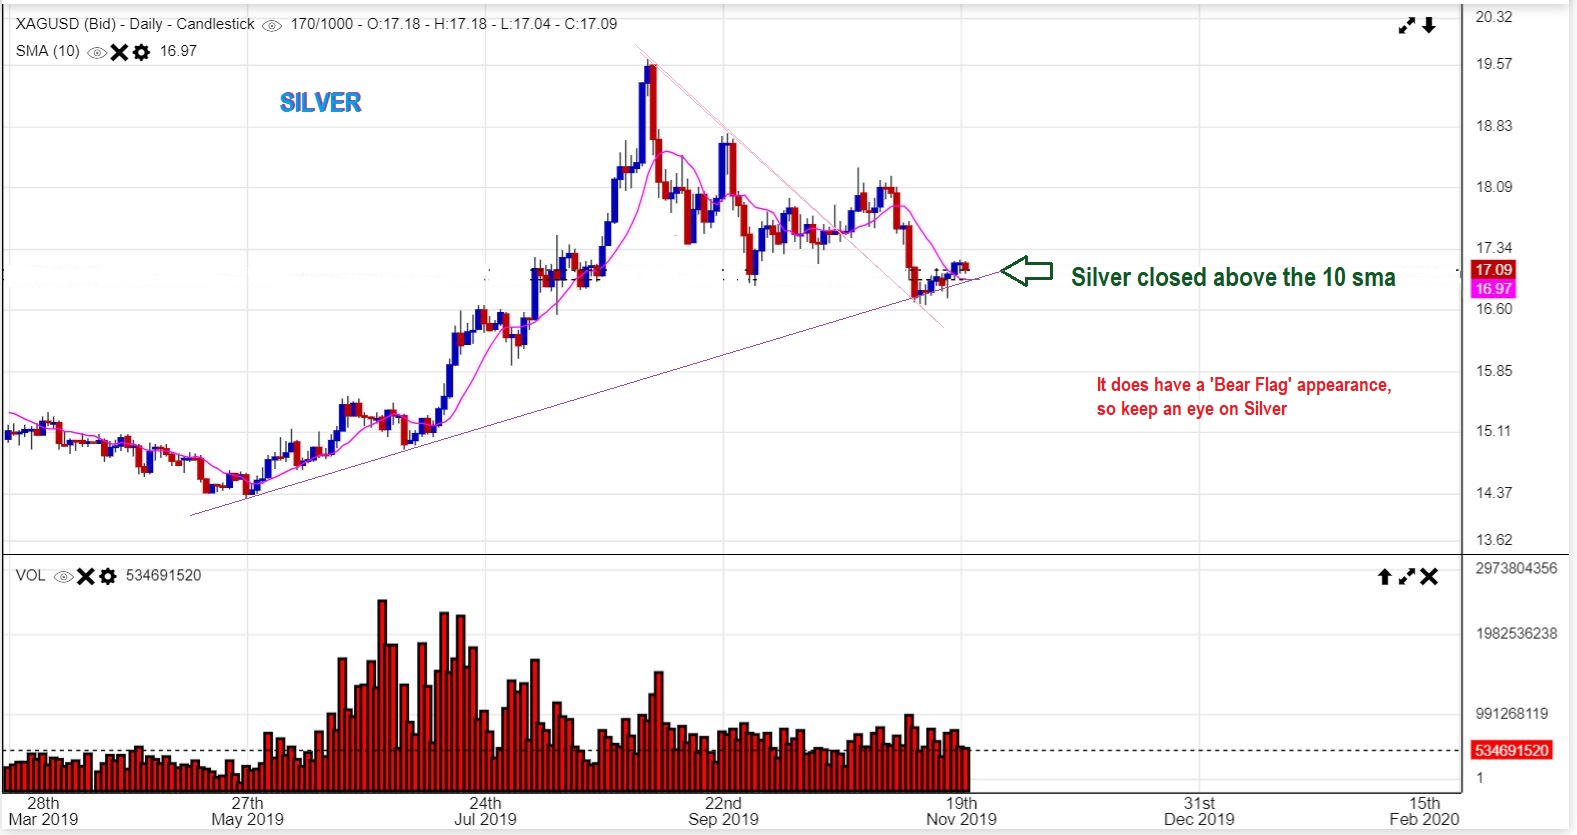
SILVER – Silver held above the 10sma . It looks like it could be a bear flag, but a push higher would negate that quickly.
.
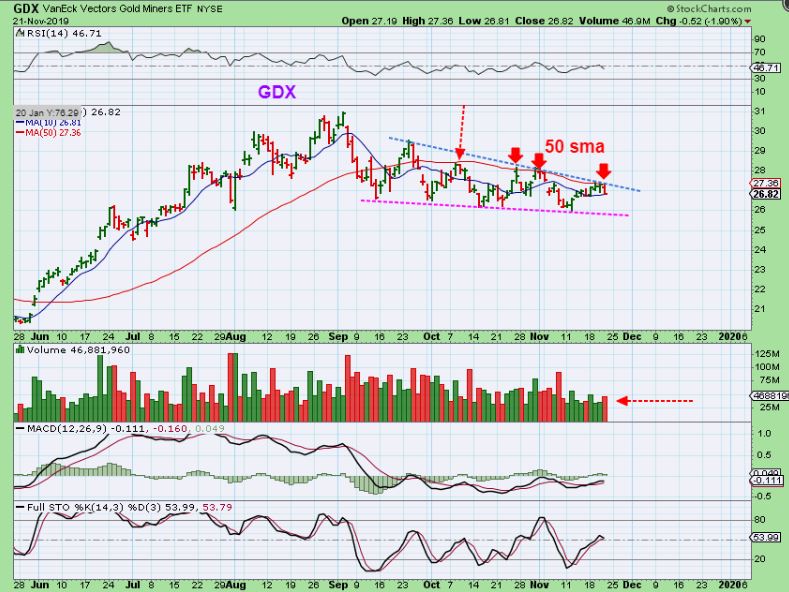
GDX was rejected at the 50sma (Again) and rejected at the down trend line (Again), and volume did increase slightly on the selling. Basically if you remove cycles from the thought process, you would say,
“GDX has been choppy within a trading range of a triangle, but looks bullish overall”.
.
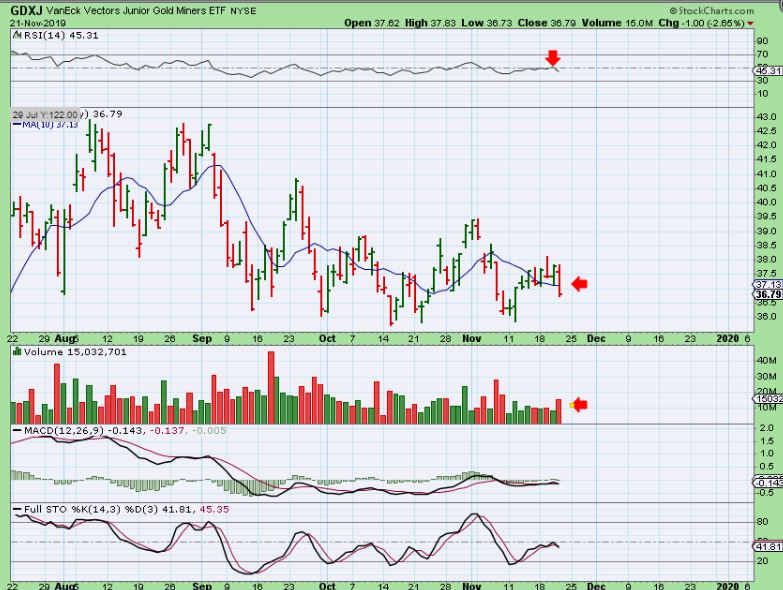
GDXJ did break below & close below that 10 sma and volume increased a bit here too. We’ll see if it can recover or hold above recent lows.
.
A few thoughts :
.
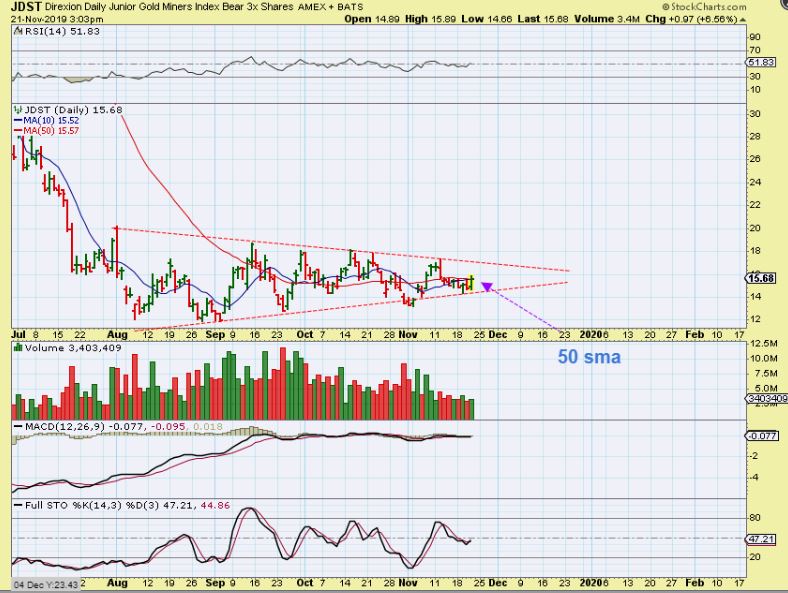
JDST – I grabbed a chart of JDST yesterday just to show that it does look like it could go higher. It has been very choppy, just like the GDX & GDXJ Charts though. Will it move to the top of the triangle and then drop again? Or break out? That likely depends on if we are in a new stronger daily cycle, or a final weak one.
.
NSRPF – So with GDX & GDXJ selling down, how about a good looking Miner? NSRPF looks to be breaking higher on a day when they sold off, after riding along above the 50 sma.
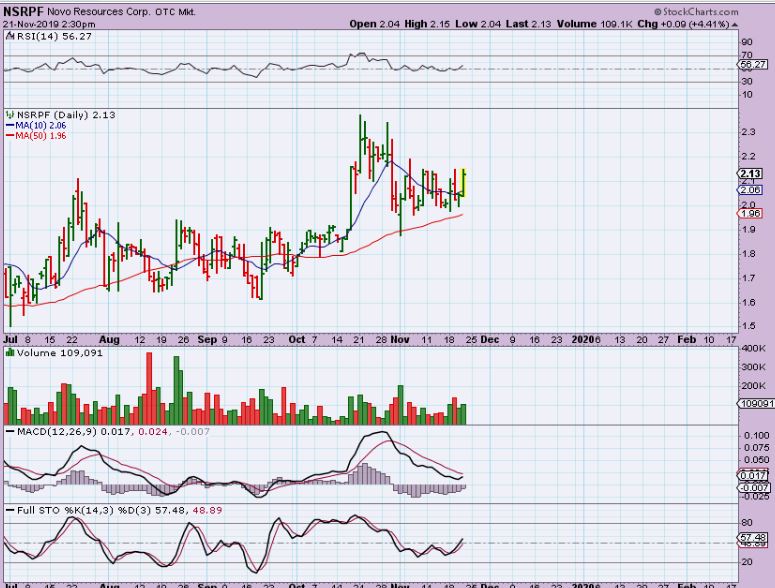
.
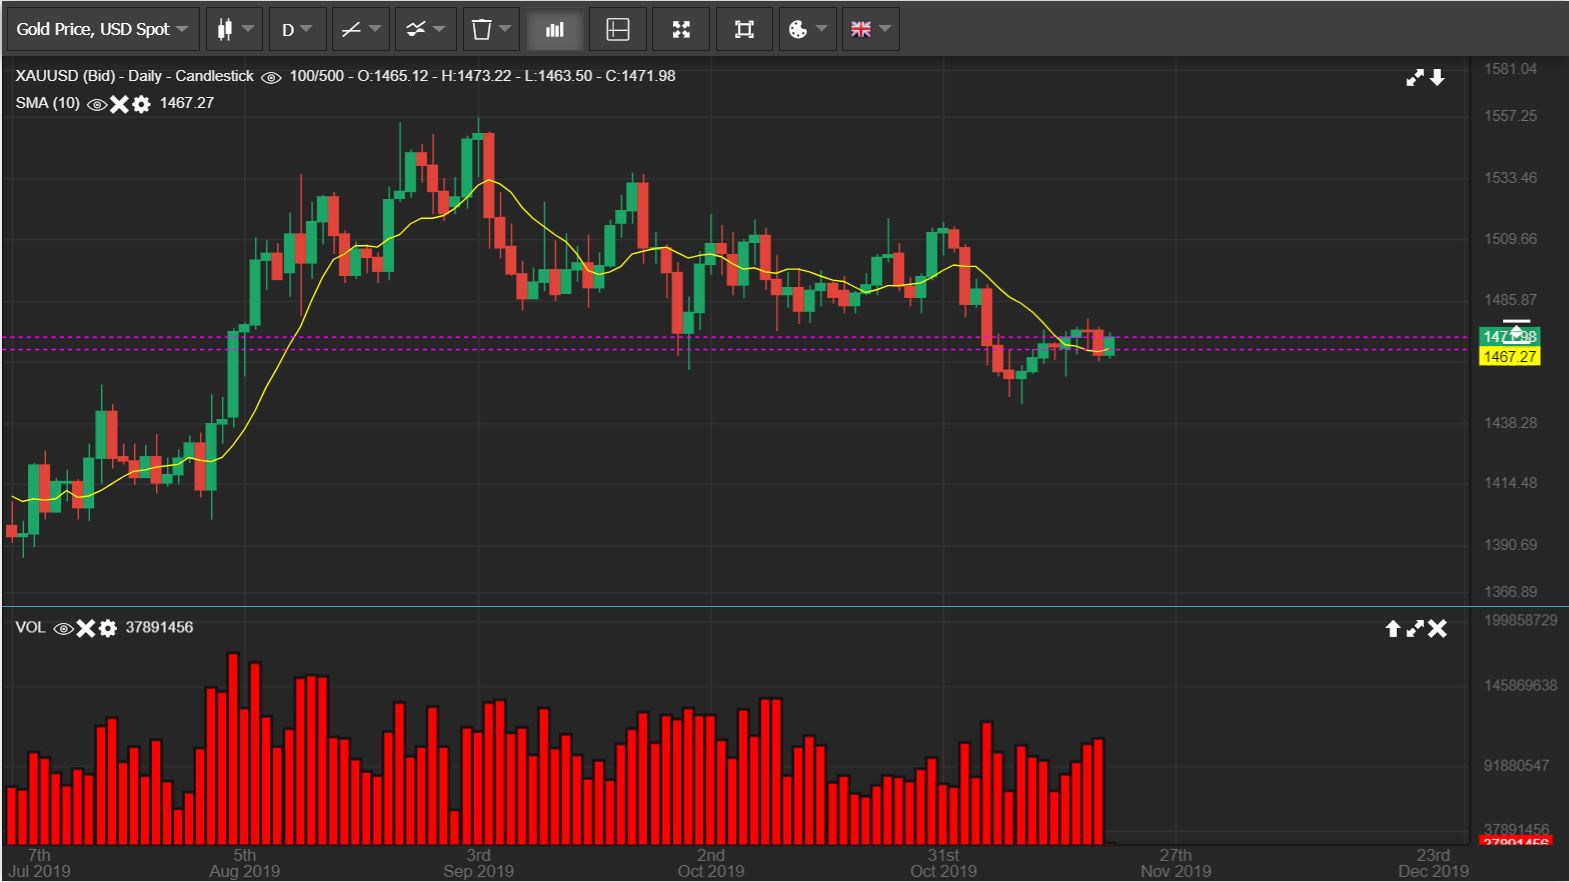
EDIT GOLD LIVE 6:30 A.M. – This is GOLD as I proof read the report , and it shows that price has reversed at the 10 sma and if the volume on this chart is correct, it looks quite heavy already.
SIDENOTE: As a trader, I have been buying a few MJ Stocks to go where there is some fast trading. That is not always what I recommend here, I trade for a living and that is How I trade. When I am trading fast positions like these MJ Stocks coming out of the lows, I tend to need to focus on that sector during trading hrs, so I sold partial positions in some Miners like SVM, HL, CDE, and others that had good gains. I just want to lock in gains at their highs and watch GOLD on day 8, 9, 10 for clues, while trading another sector. I basically just started to have too many open positions with recent MJ Stock positions, Miners, JNUG, SNAP, etc and wanted to simplify on day 7, but this does NOT mean that now I see something has changed in Miners. The set up is exactly the same. We are on day 8 with Gold now and it can top as left translated anytime from day 5 onward, or it can chop around and then just take off higher as Right translated and signaling that an ICL is in place. Nothing has changed except that I personally jumped to a bullish opportunity for some faster trades, and locked in some gains in Miners for now. I can easily jump back in with a clearer signal later. GOLD popped this morning, and it could just start running higher. Fridays running higher would be great for the weekly charts 🙂
.
So that is a review of the various Market Sectors, enjoy your Friday trading & your upcoming weekend!
.
~ALEX
.
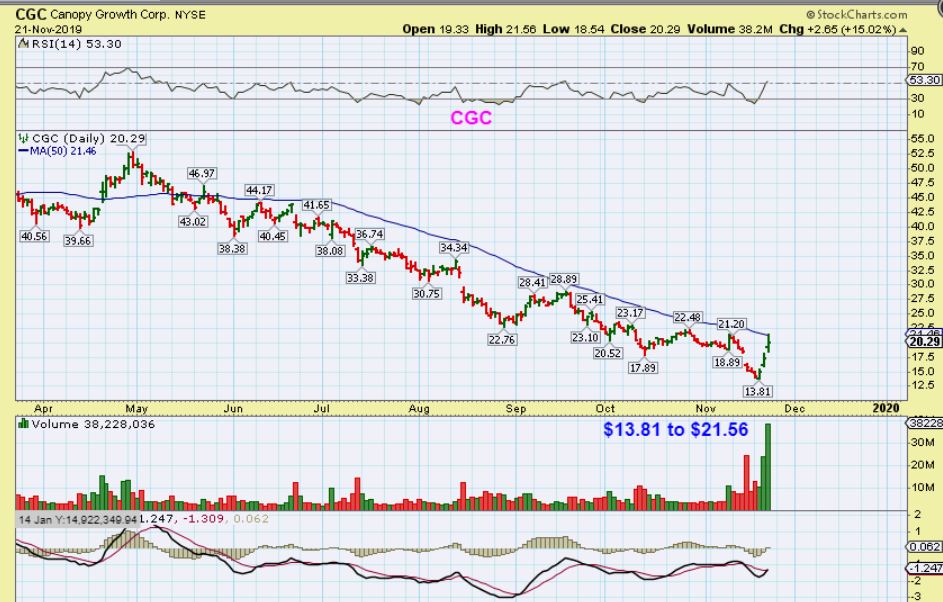
I want to mention again that the MJ Sector has rebounded sharply, and now we’ve seen some of these stocks blast higher out of the lows at a rate or 20-30% per day. Big moves that I like to trade , but there is a big caution about holding too many for too long. The dangerous part is the pull back. Buying now is a bit more risky unless you catch one near the lows… the extended stocks that ran up 20% Tuesday , 20% Wednesday, & 20% Thursday can easily drop 30% Friday, right? So that could hurt, but BUYING THAT PULL BACK may be an option later, if we start seeing them find support and reversing. Let me show you something that I will be looking for…
.
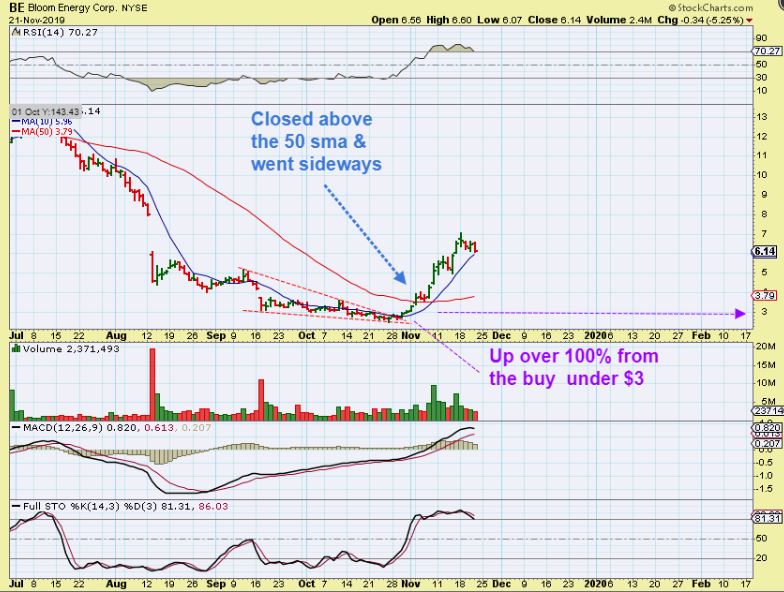
BE similar to ACRGF? – BE broke from the lows quickly too, and this is 1 thing that I’ve seen in the past.
1. BE took off out of that sell off low for 4 straight days of big gains.
2. Notice the break through the 50sma, and then what?
3. It went sideways using it as support and then continued higher. now it has only tagged the 10sma since then, so this is just leaving people behind. SEEING THIS BULLISH RUN, LET’S LOOK AT ACRGF...
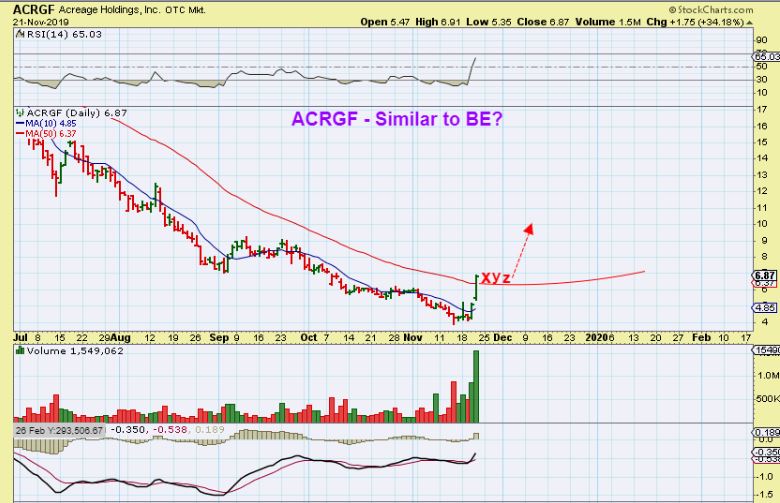
ACRGF – This also broke the 50 sma. What if it were to do what BE did and this 50 sma area would act as support? That may be an entry point IF IT HOLDS. Or…
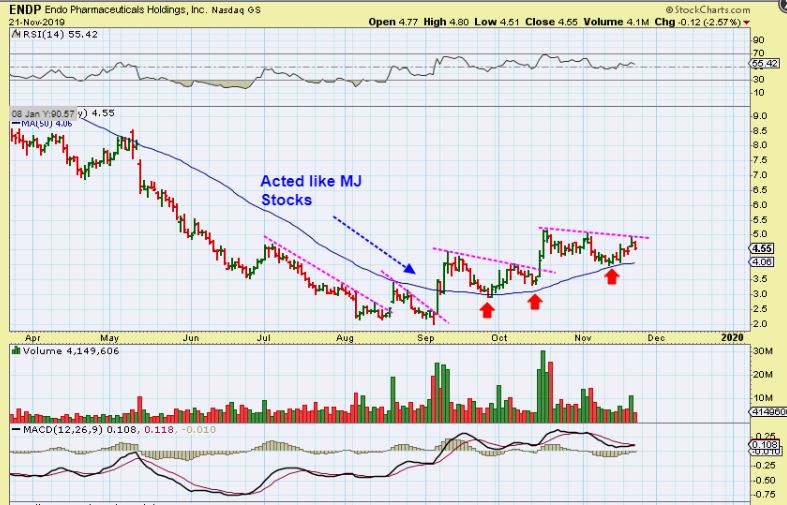
ENDP – I also like ENDP and MJ Stocks may recover in a manner similar to it. This is an orderly rise out of a deep sell off too. Notice that it surges for a few days, and then consolidates with a choppy pull back then surges again and consolidates those gains too. THIS might be how the MJ Stocks act over time if they are in ‘recovery mode’, so I will be looking for set ups like this in the future too, as Buy opportunities for a sector that may become very bullish again.
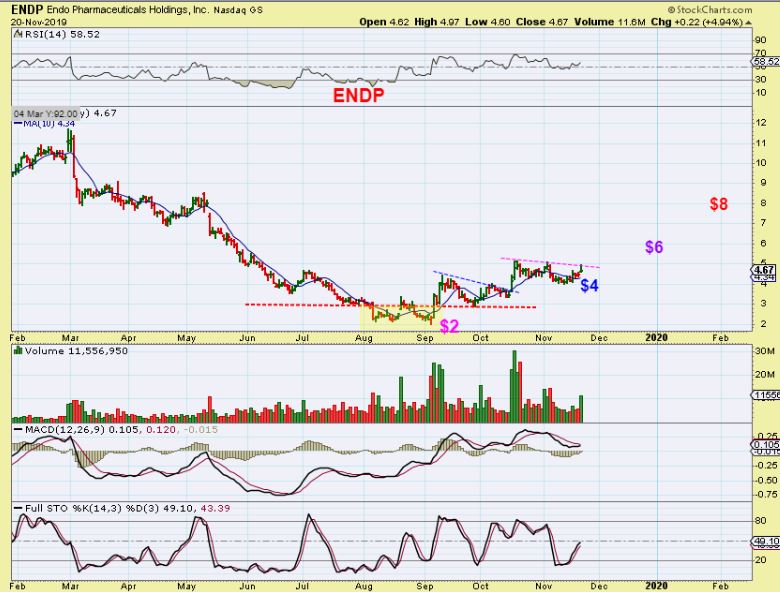
By the way- I like ENDP, with these high volume surges higher. It dropped on Thursday and may become a buy at the 50sma, since this has been acting correctly. It would be a buy if it keeps dropping back to the 50 sma & reverses, or even if it breaks out higher. Over time a stock like ENDP has doubled and can even double again from here, if they don’t disappoint.
CGC – Just an example of what I am talking about. Look at this 3 day move. BIG GAINERS. Buy the dip? 🙂