
Friday November 1st
I have been buying starter positions in Miners before the fed, and I also showed many bullish charts in the reports over the past few weeks, some have emailed that they wanted to wait until after the FOMC Mtg. That is Fine, Better to be safe than sorry. Now I have been asked what the next step to buy is without chasing? I am going to slowly walk us through this current set ups , and I hope this helps those that need to buy.
,
When it comes to Buying the Dip or The Low at the end of a consolidation period after a nice strong run, there are a few different ways to do it, but I want to quickly discus 2 main methods. At an ICL, some try to catch the bottom, and the others that are happy to wait for additional evidence that lows are in. BOTH of these traders will be profitable in a bull run, so now let’s discuss our current lows and how to buy. It is NOT confirmed as an ICL yet…
.
-
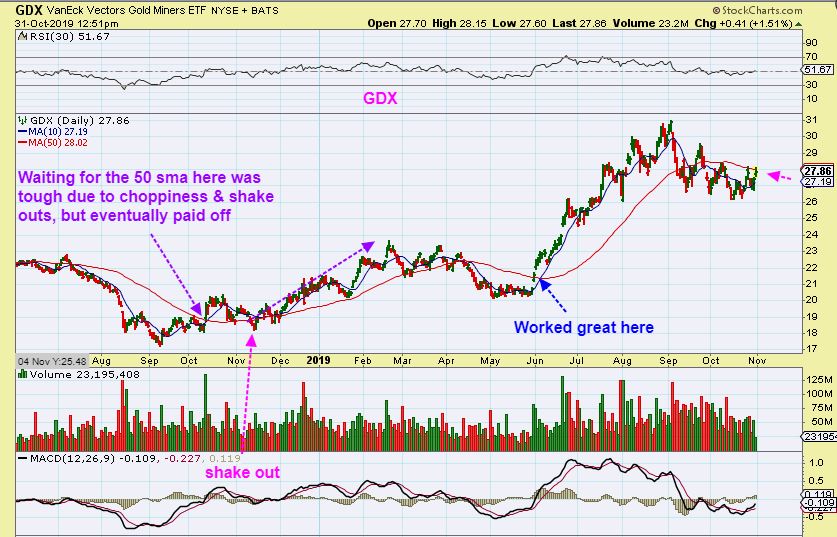
Again, some like to wait and examine all of the evidence. They buy when the results look right. At the last ICL, I strongly recommended against waiting for a pullback after the lows were in, because some moves out of an ICL can rip straight up with short cover. We saw that at the last ICL & also in 2016. For these traders, I tell them that it can be safer to buy above the 50 sma. That is 1 way to catch a good bull run when coming out of an ICL- take your time and examine the evidence.
-

- After examining the evidence in the chart below, some that didn’t buy with me in May were more comfortable entering the trade above the 50 sma in June. Some that have not followed my buying yet at this time may be more comfortable buying above the 50 sma too. This chart was as of Midday.
.
,
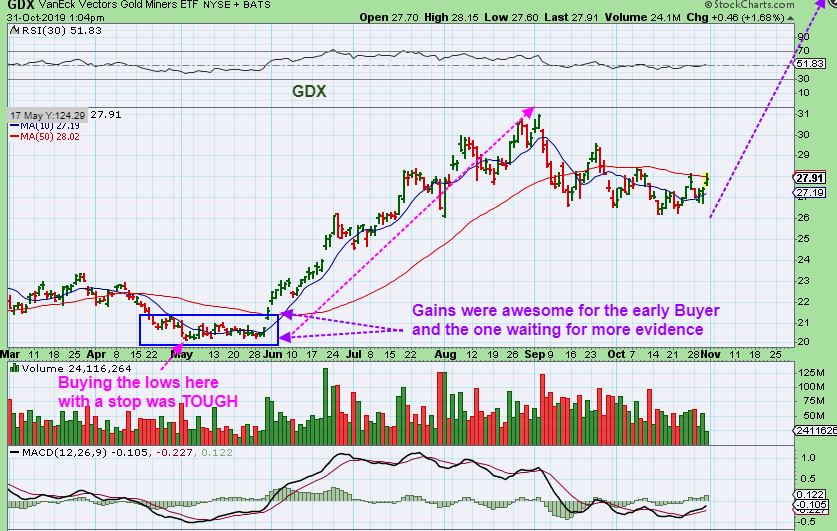
4. Then you have those that really want to get to it! They wish to get shopping as soon as possible, while prices are really on sale. They are eager to buy up the bargains & Ride the Miners right out of the lows. These traders may get stopped out a few times if it gets choppy, and that gets frustrating, but when the rally unfolds they make great gains out of an ICL. Let’s discuss this…

.
They buy a reversal above the 10sma after a deep sell off.
However: Notice that with a BASE or BASING PROCESS, the 50 sma drops down close enough to the lows that BOTH GROUPS enjoy great gains. Well, we actually have that now after this consolidation too. The 10 & 50 sma are close together. During a Crash & V-Bottom, the 50 sma is still much higher above price, so the bottom fishing group does a bit better than conservative group. We should now discuss our current set up further, but please read the chart first…
.
We could currently be at an ICL that has developed mildly, and if so ( it is still an uncertainty) I would say that it is an ICL that was measured out by ‘TIME’ instead of being measured out by ‘the degree of the PRICE DROP’. What we have in front of us and discussed over the past couple of weeks is this:
.
1. We have many Miners setting up bullishly and continuing to improve, so those have been encouraging to buy. Lows for those could definitely be in place.
2. I started seeing triangles forming and some Miners began to break above those down trend lines, so they can be bought with stops at the triangle apex. Several miners then began to break their 50 sma.
3. Price was still under the 50 sma for GDX & GDXJ. That changed on the day after the FOMC Mtg.
.
THESE ARE BULLISH SET UPS AT THIS POINT, So let’s go to the charts, there is still plenty of shopping left for everyone…
.
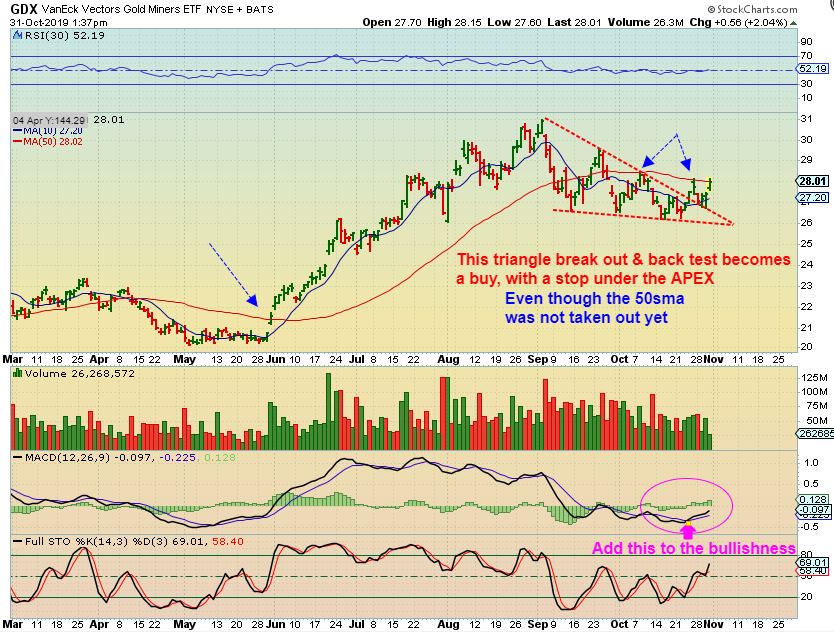
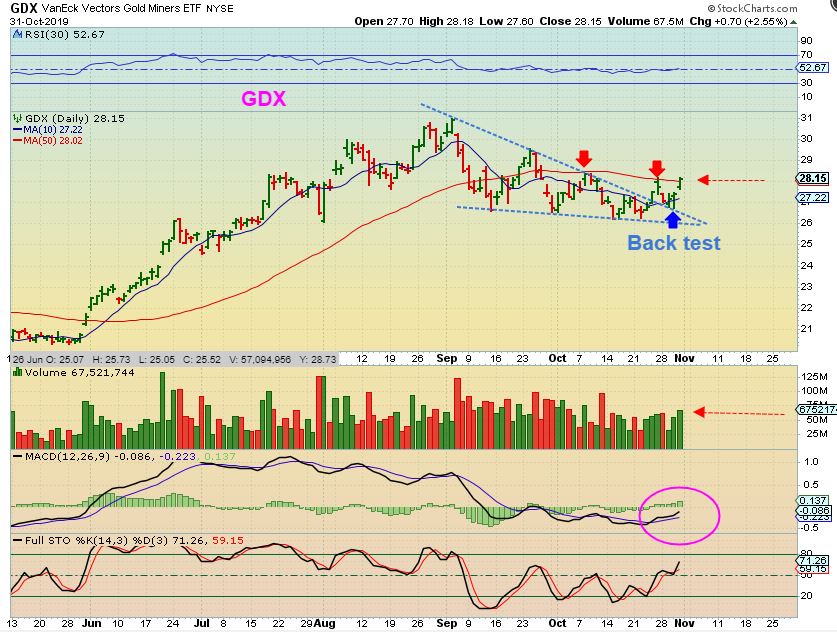
GDX MIDDAY – Though the depth of this correction seems too small for an ICL, it may be long enough time-wise. I watched as a triangle formed, and that can be a bullish continuation. As price reached that apex, GDX did a break out & Back test with the MACD crossing higher. I was getting ‘buy signals’ in a variety of Miners using Technical analysis. MANY miners continued to act bullishly, so we began buying starter positions on these signals even before the Fed. Read this chart from Midday Thursday.
.
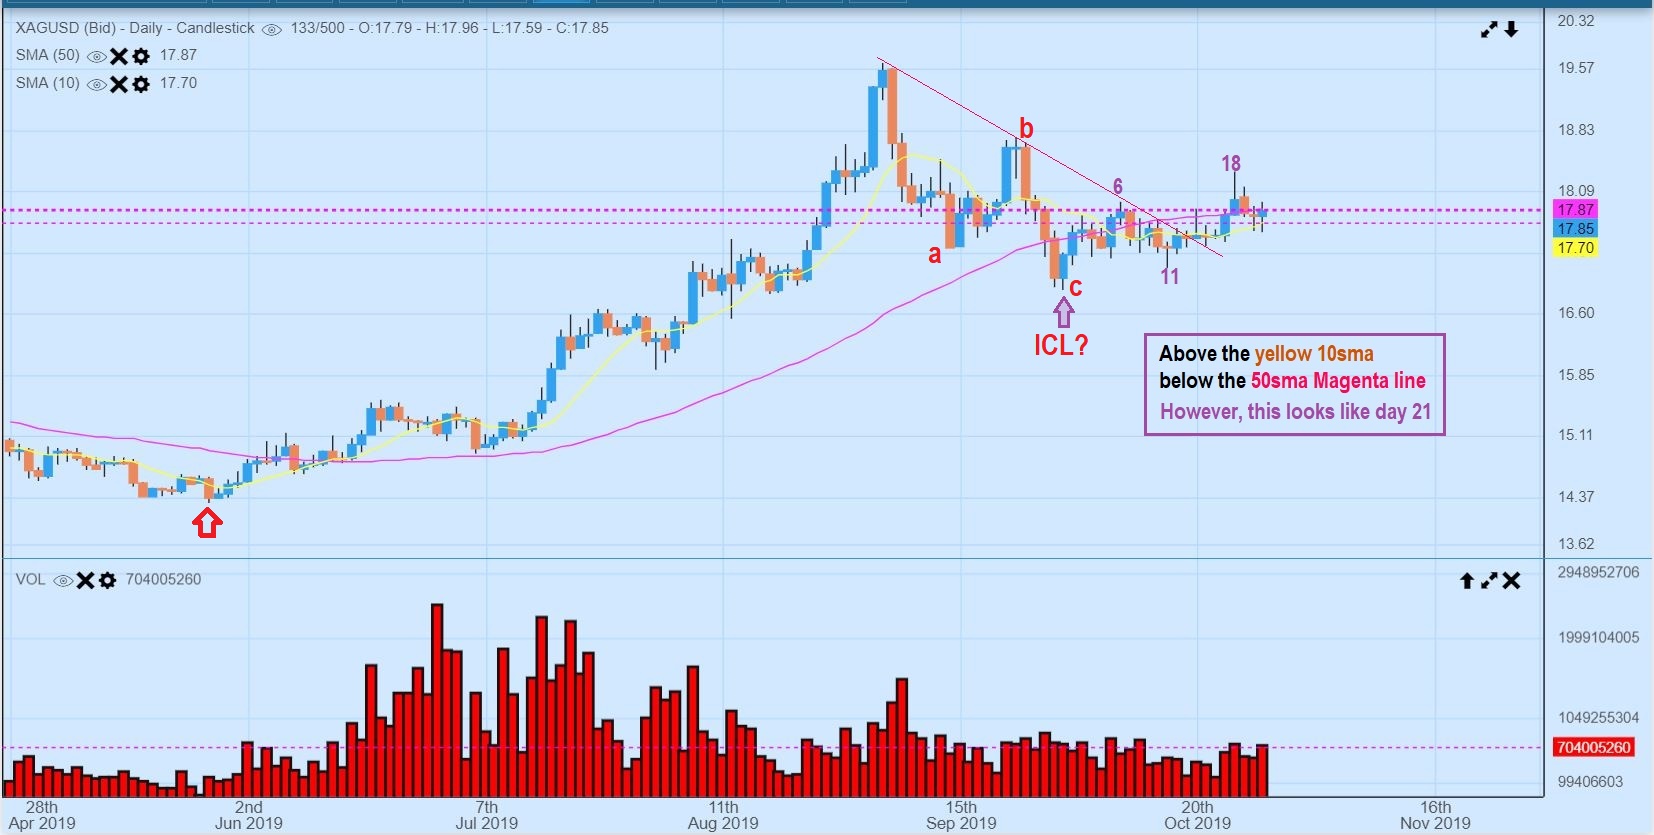
I also have been viewing SILVER as a nice looking chart. It has its down trend broken, and a cup like consolidation is starting to form, and it looks like an a-b-c ICL sell off actually. For the more conservative group of traders, Silver could be a shake out buy that did not yet recovered the 50sma yet. So,
I mentioned , ” Silver just simply looks like a steep a-b-c drop to an ICL more than Gold or the Miners do. That was only 4 month, but we have seen a 4 month ICL to ICL.”
.
/
SILVER – Good News! Silver has now broken the 50 sma too, so it can be bought with a tight top under that 50sma.

.
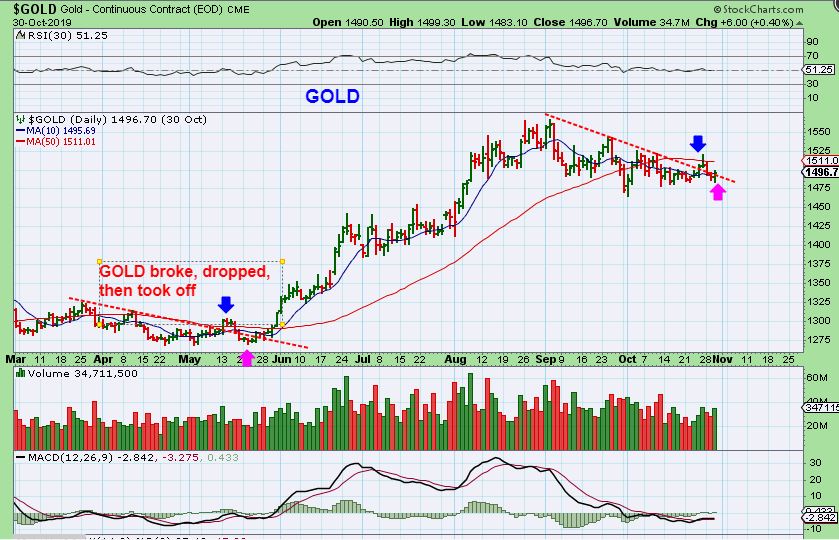
If I compare GOLD now with the last consolidation, we do still see similarities, as seen here on this chart. It even had 1 initial false break of the 50 sma & a drop. Notice that after that happened in MAY, Gold got above the 50sma & started to really tack on some gains. Gold is currently moving over the 50 sma, this is an OCT 30 pre-Fed chart, so this may be ready to make a nice run.
.
That last run out of the May lows took Months to peak, and this could repeat, so please do not feel that you missed the run. We are in a place similar to Gold breaking the 50sma in late May. Look how much more we enjoyed after that.
.
GOLD – This is something that was SLIGHTLY concerning to me, it just looked like we still needed more ‘time’. You rarely have a PERFECT SET UP, so I’ll have to ignore what I see with the MACD alignment for now. The last time the MACD set up this way & gold broke higher, it got choppy & it did dip back down 1 more time to the yellow line. ( See the chart then & now, pink vertical lines) . IF Gold does do that and drop again to the yellow line, Many Miners will likely hold up better than expected, possibly just doing a back test of break outs.

.
.
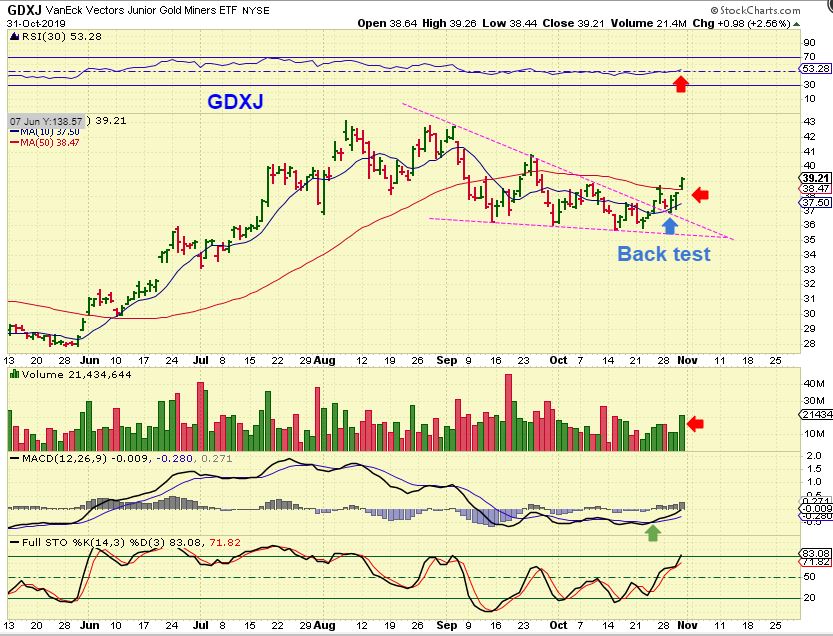
This is GDXJ as of the close on Thursday: With each passing day, we can see the Bullishness of the chart slowly developing more and more – like an old Polaroid camera shot. Notice that –
1. RSI just went above 50%
2. A broken down trend line or triangle was back tested
3. MACD bullish
4. Volume increased Thursday and it closed near the highs
5. We are above the 50 sma
.
This chart of GDX is developing the same way, so it is a buy set up. We have discussed MANY Miners in the past few weeks, let’s just do a quick review of a few.
.
This week I pointed out that some Miners like AUY are low risk ‘buys’, with earnings already out, trend lines back tested, etc . They can be bought with a stop. I posted this Oct 30.
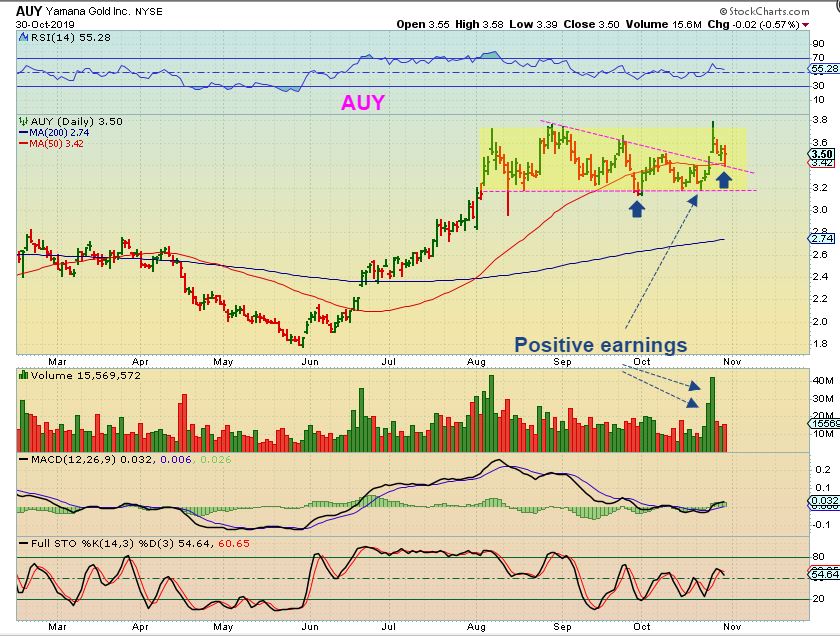
AUY – And it is still not too late when you think about where these could go if we are off to the races. DRD, GORO, AEM, AUY, HMY, HL, USAS are a few that I mentioned as bullish, and I will be adding many more to the reports as they set up.

.
AUY – Remember the Big Picture. If we are entering the next run higher, the gains will be good.

.
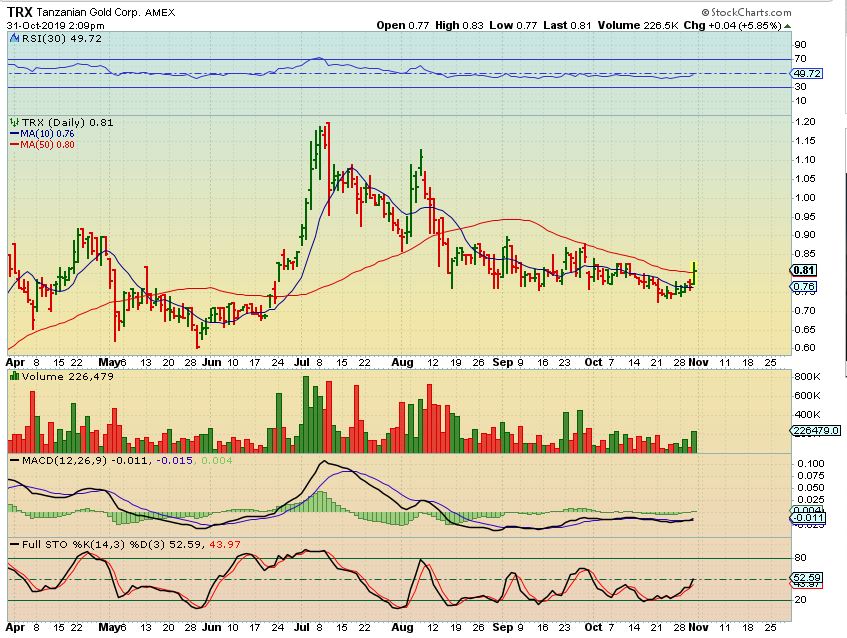
Some Miners have been basing or lagging. TRX was still near the lows, so TRX looks to be one of those that is just now starting to pop from a base, break from a downtrend, and also trying to get over that 50 sma. A run to former highs is a great run, and many of these will then break out and continue higher.
/
GFI is at new highs after a big drop & recovery. In fact…
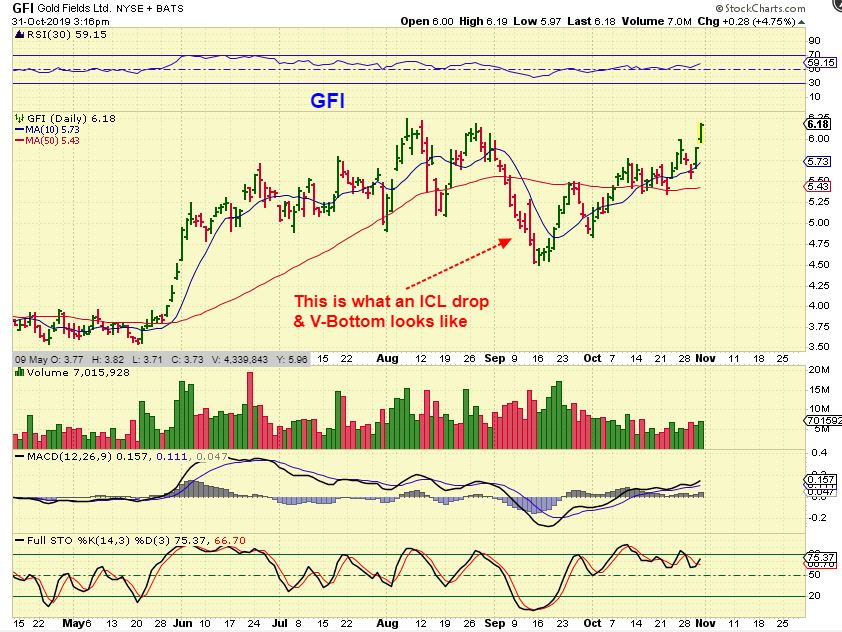
This drop in September, also seen in Silver, is actually what I would have expected to for an ICL in GDX / GDXJ.
.
Since GFI had a V-Bottom recovery, you can now see why buying at the 10 sma vs the 50 sma can lead to different results. Those that look for a reversal low buy at the 10sma with a stop under the reversal low. Buying at the 50sma here would be higher, but as it breaks to new highs, it can run for great gains for both traders.
.
.
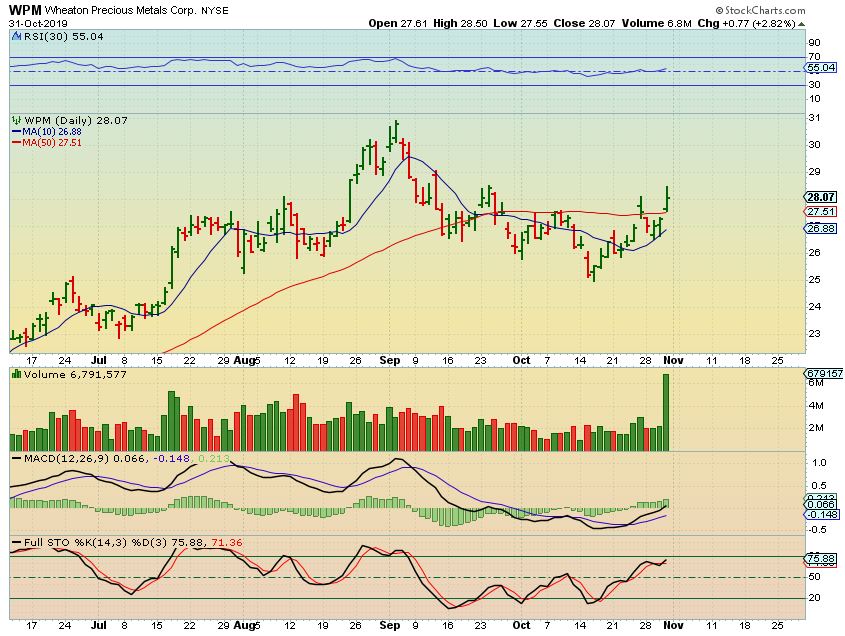
This was WPM in Yesterdays Report:

.
Look at that volume as it popped Thursday, but it is not overextended. WPM also didn’t close at the days highs, so this is still a good buy & hold entry ( With a stop). IT can form the cup at $31, and continue higher if the next leg of the bull run has begun.
.
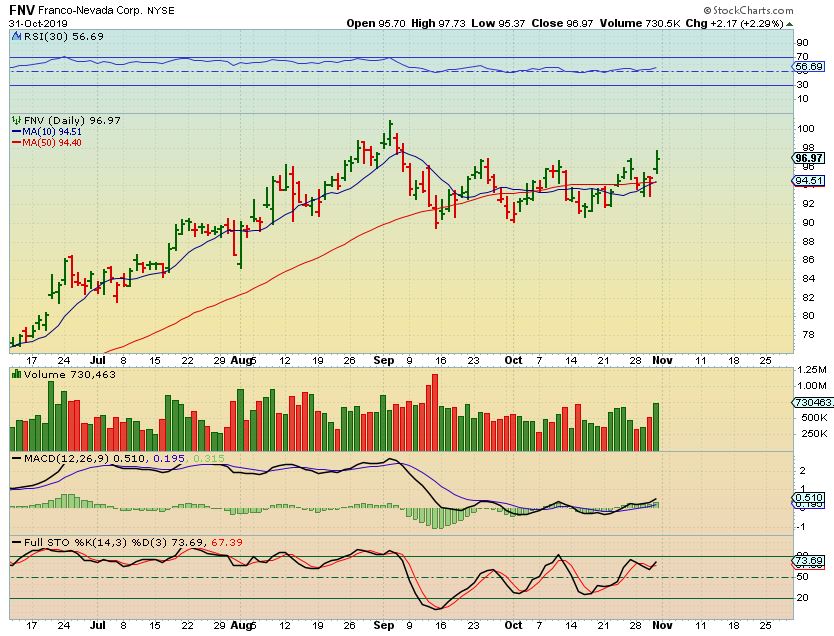
I also discussed FNV as a longer term BUY & HOLD in Wednesdays report, and it broke the 50 sma Thursday too. Good volume, this looks good and these could run for Months if the Lows are in.
.
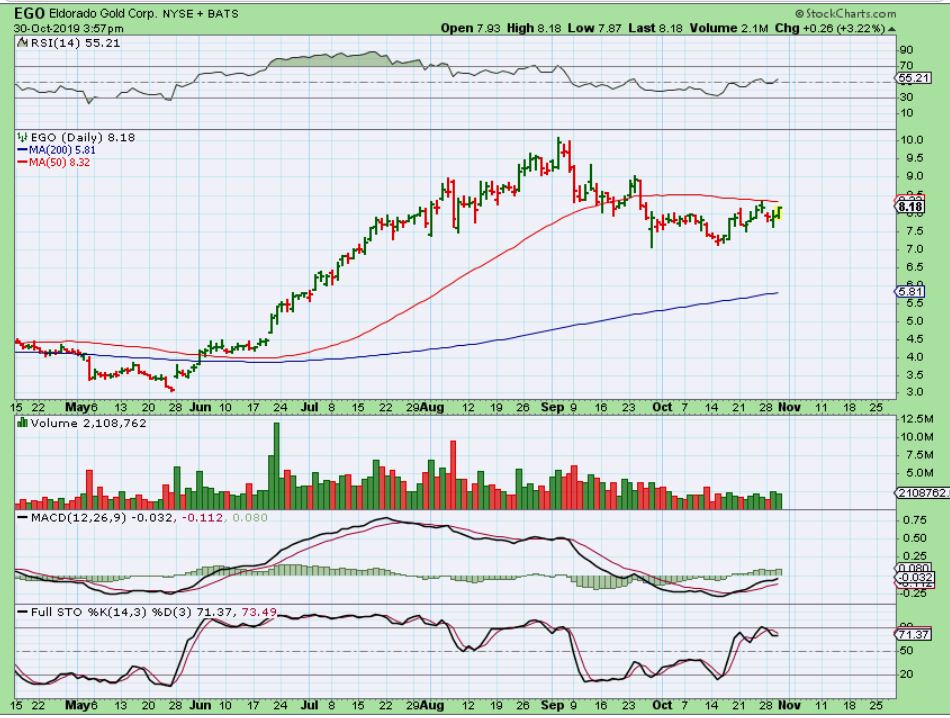
From Wednesday Nights Report: EGO could be bought here a bit early, or when it breaks the 50 sma. This is a bullish set up and should break the 50sma if Gold breaks higher. The MACD & RSI are rising while price chopped sideways…
.
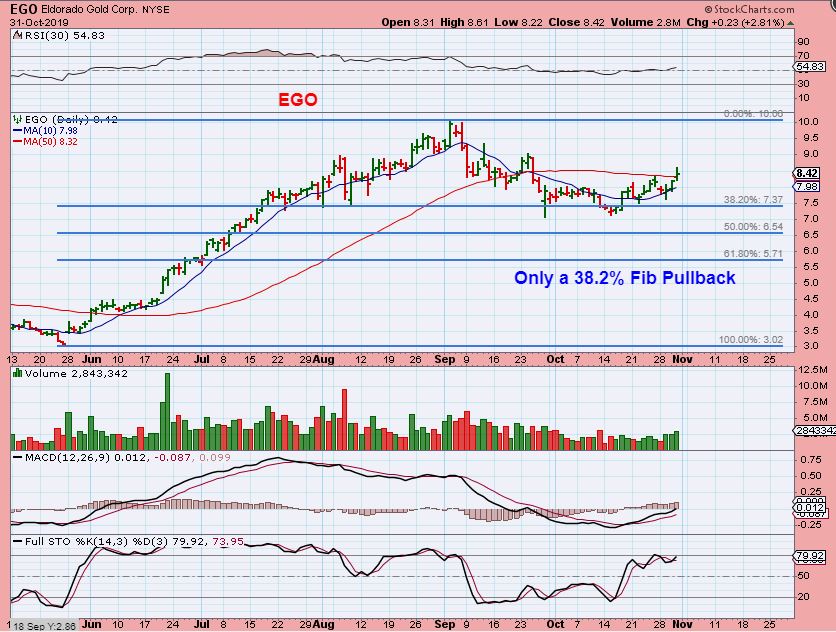
EGO – EGO only had a minimal fib draw down of 38% too. Thursday it broke that 50sma and sold off a bit before the close. That may be because they were releasing earnings after the bell. After their earnings, they were up a little higher in after hrs. Let’s see where it is in the morning.
.
WHEN BUYING INDIVIDUAL MINERS, I ALWAYS RECOMMEND A SMALL BASKET OF MINERS or an ETF. WHY?
.
SOME EARNINGS WILL BE VIEWED AS GOOD, you get a nice POP.
.
SOME EARNINGS REPORTS WILL BE VIEWED AS BAD , And that can become an ugly drop.
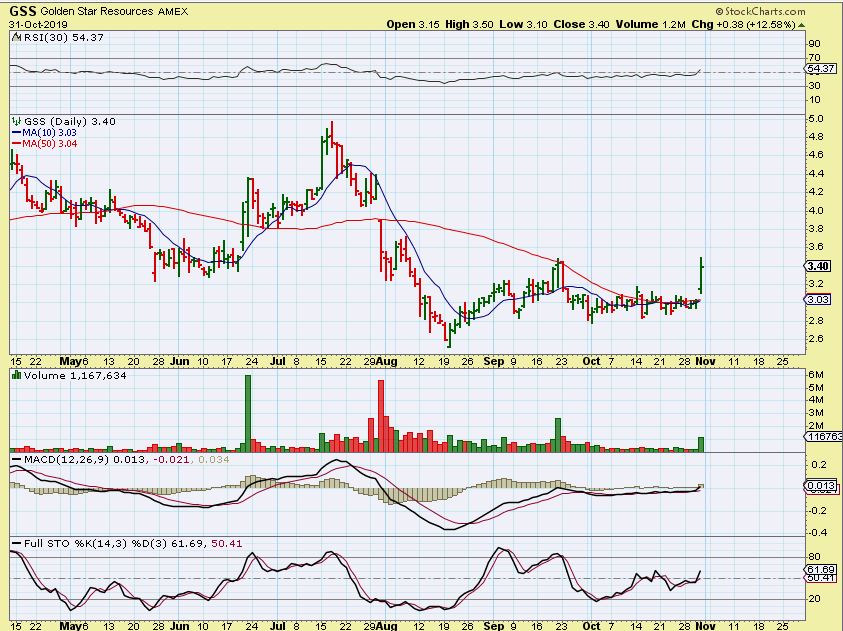
Some miners like AUY, GSS, AEM, GORO, etc already released their earnings. They may be the more extended ones, so you could start small there and add on dips? You can buy a few laggers and hope that they play catch up. Also as we move forward, I will be keep posting charts of Miners that are setting up bullishly,like I have over the past several weeks.
At this point we now are at the point where we do have a little more evidence that the Precious metals Sector is acting bullishly and seems ready to run. Price is past the 50 sma in Gold, Silver, and the Miners.
It may be time to do some More shopping

