Thursday Trading – Oct 17th
FROM YESTERDAY – MORE UPSIDE EXPECTED, but possibly limited: I WROTE …
.
.
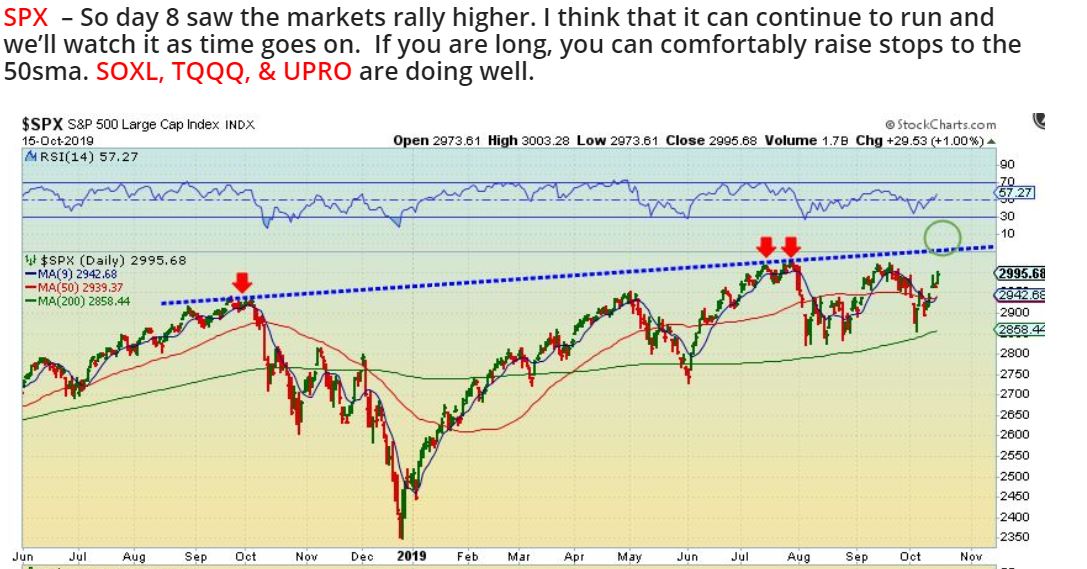
SPX – The markets paused on day 9, but this can still run higher. Notice how the June / July run paused & tagged the 10sma. Normal market action so far, but that first run was strong… 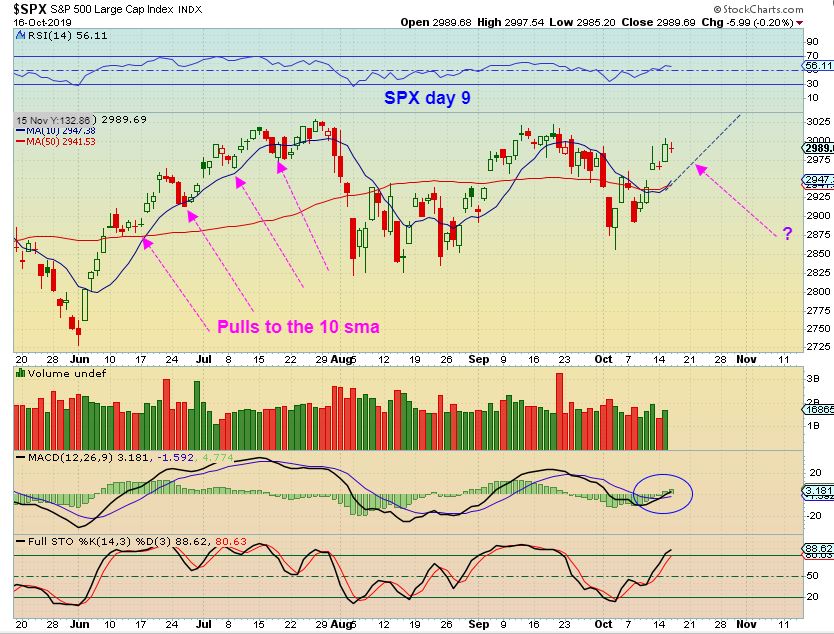
.
As a sidenote: Remember that
– the 1st daily cycle was strong, but
– the 2nd daily cycle was more choppy & formed a round top at the highs.
– This is a 3rd daily cycle so it could also get choppy& eventually roll over as L.T. somewhere between now & maybe day 16 ( fomc ?).
.
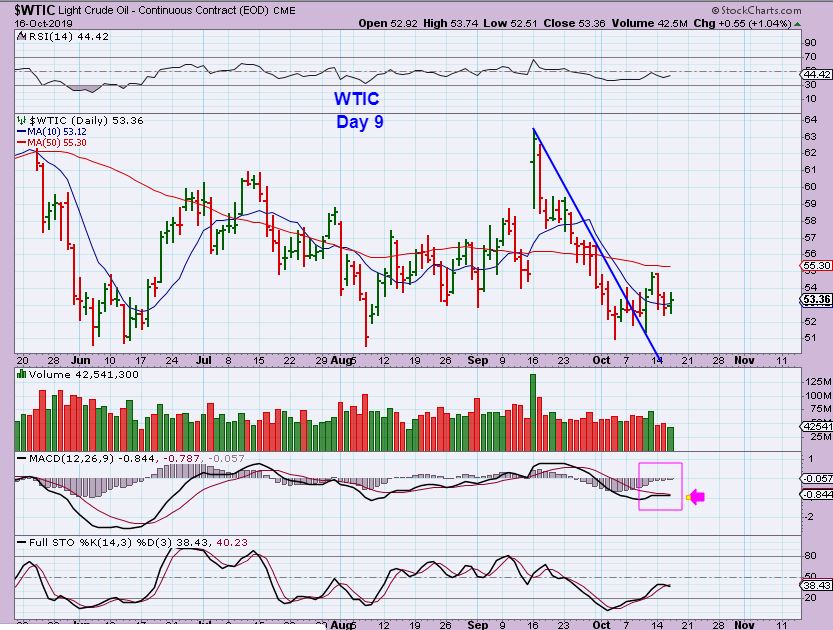
WTIC – Yesterday Oil dropped, yet the XLE moved higher. Now Oil flipped back above the 10sma and it appears to be day 9. We see 2 long daily cycles that went nowhere so far…
.
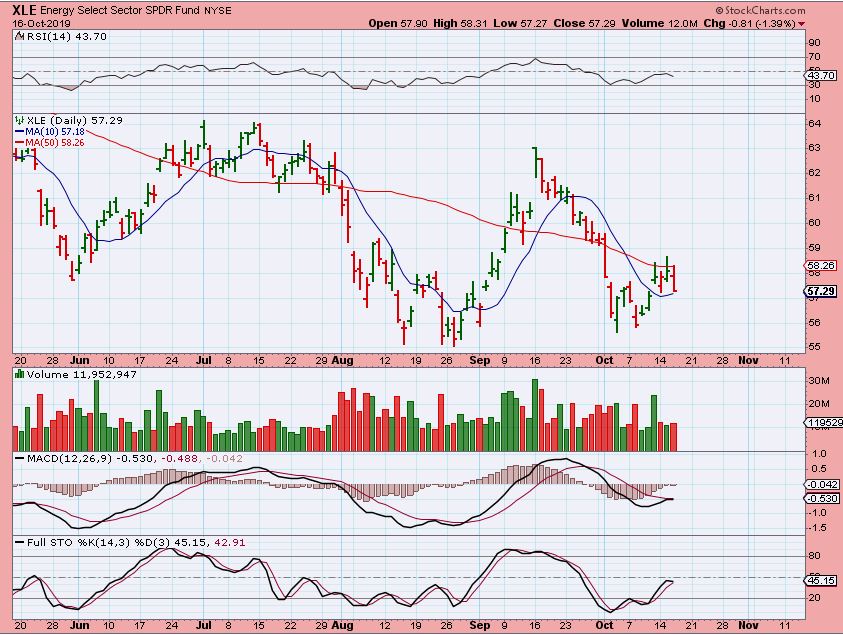
XLE – Oil moved higher and XLE dropped this time. This sector remains choppy ( obviously).
.
.
We got a pop in precious metals, but this late in a daily cycle, the pull should really be to the downside. Another way that I like to think of it is that the price should seem ‘heavy’. So we shouldn’t see a lot of follow through higher. If we do, I need to re-analyze the set up.
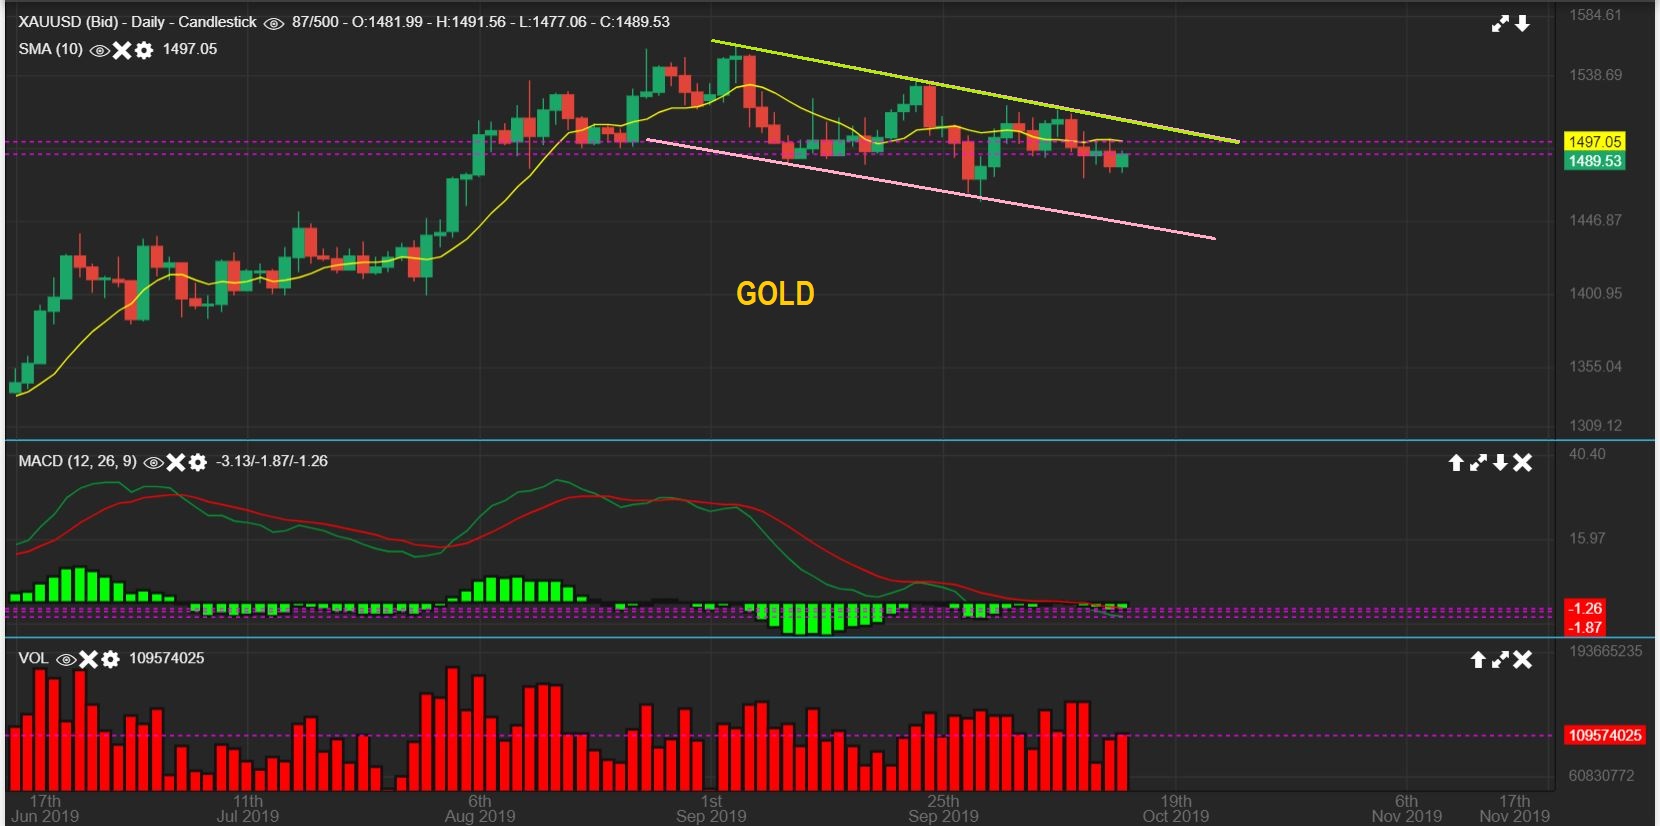
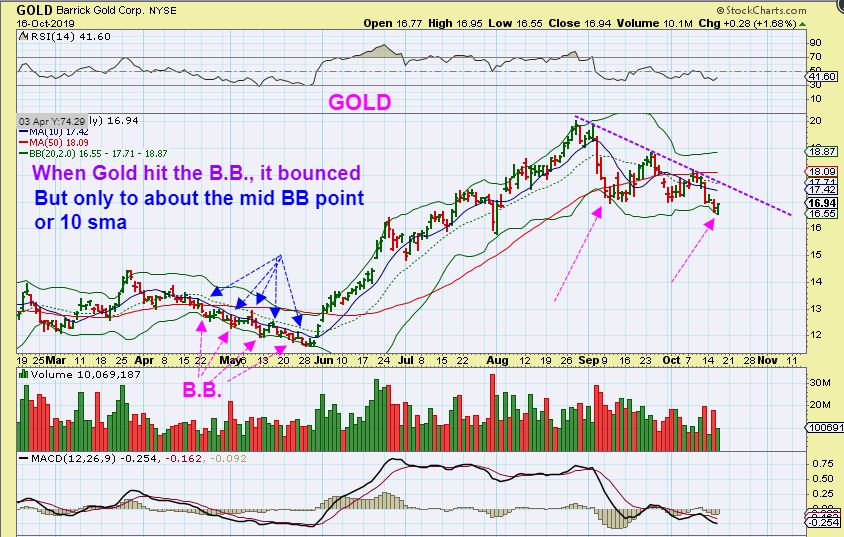
GOLD #1 – Gold moved higher on Wednesday, but so far it remains under the 10sma.
.
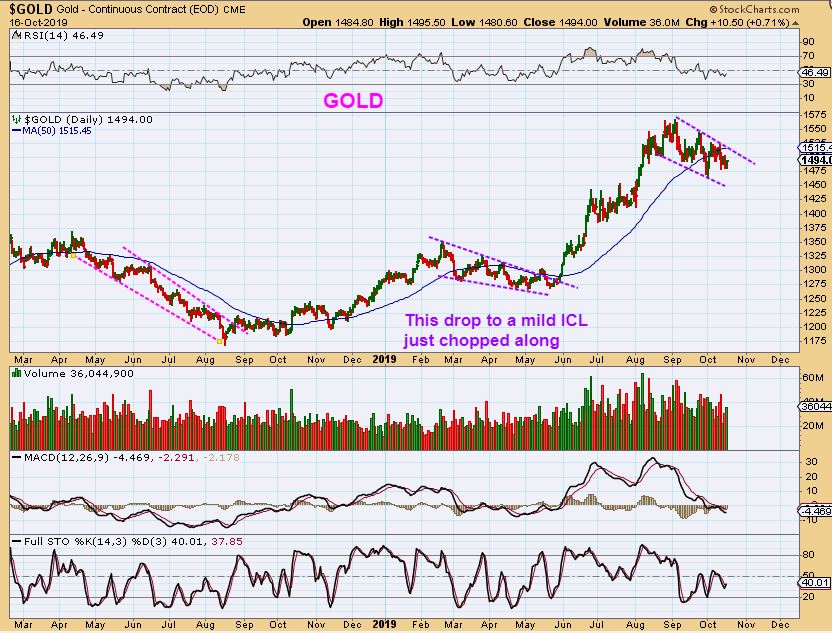
GOLD #2 – When GOLD drops into an ICL, it can bounce and chop around, but I do not expect it to break above that down trend line. Something that strikes me as very interesting is that…
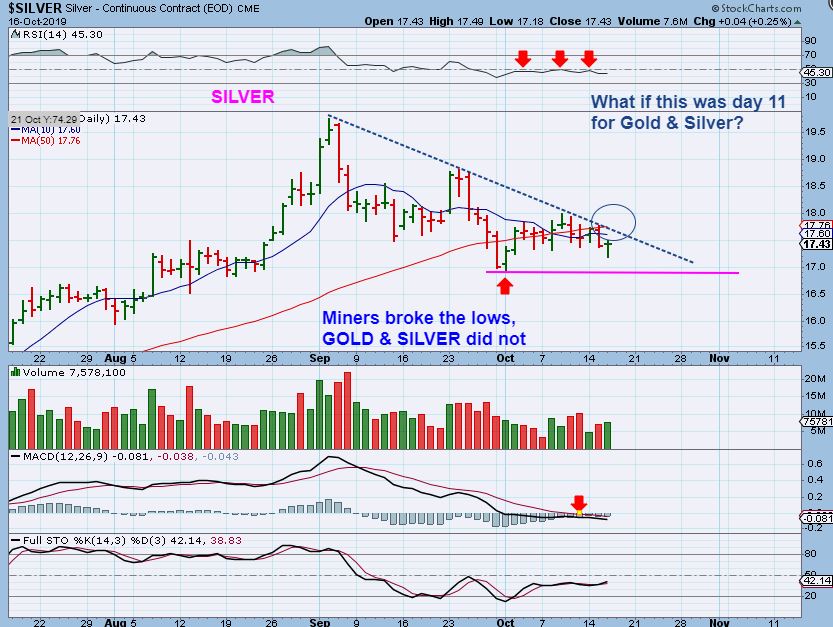
SILVER – Silver does not have much overhead room before it will regain the 50 sma & downtrend. I will be watching this, because what if this was day 11 & broke higher? Gold & Silver did not break the Oct 1 lows, Miners did make new lows, so it would get tricky…
.
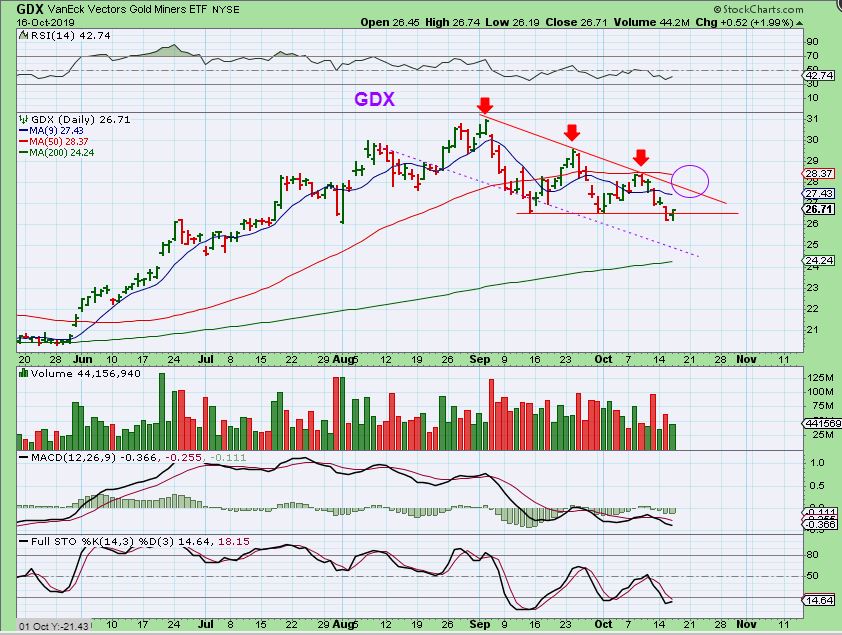
GDX – GDX broke down slightly yesterday & recovered, but it remains under the 10 & 50 sma. So GDX has a new low for October. This may bounce to that purple circle and we have lower highs & lower lows indicating the sell off is in place.
.
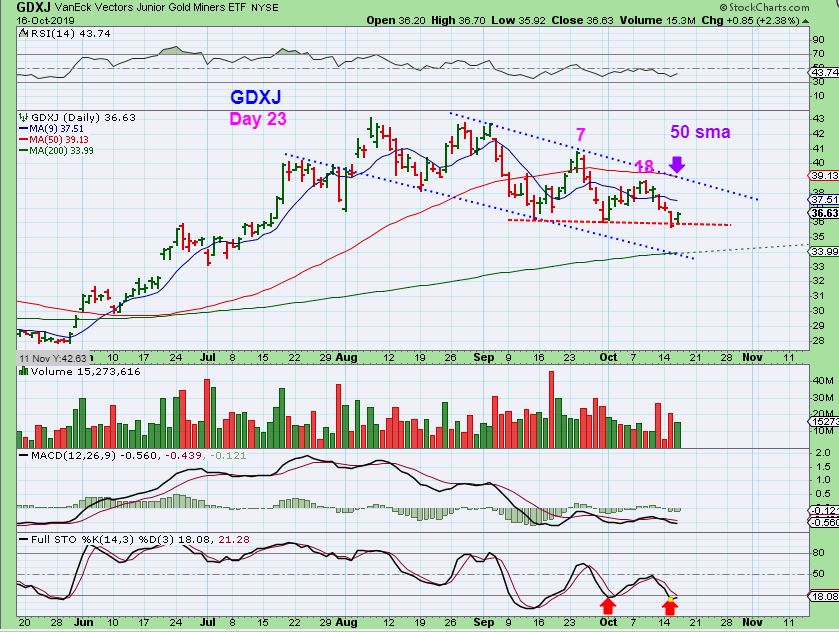
GDXJ – So we have day 23 as the start of a possible bounce. I am keeping in mind that the FOMC Mtg would fall on day 33, 2 weeks from now.
,
I did see what looked to be Bullish Action in a couple of miners, and this might be giving us a clue as to which Miners are going to be leaders. They may be under accumulation first. SO I will discuss a couple and you can keep your eyes on them too.
.
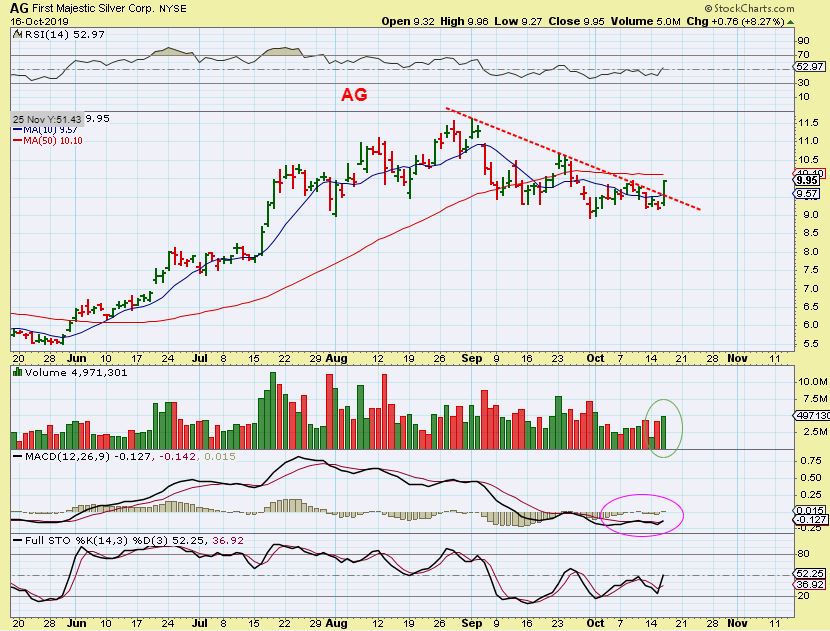
AG – Ag had a strong 8% reversal and it broke the downtrend line. This actually looks Bullish, and under normal conditions, I would buy that with a stop under Wednesdays lows. We’ll see what happens at the 50 sma Thursday.
,
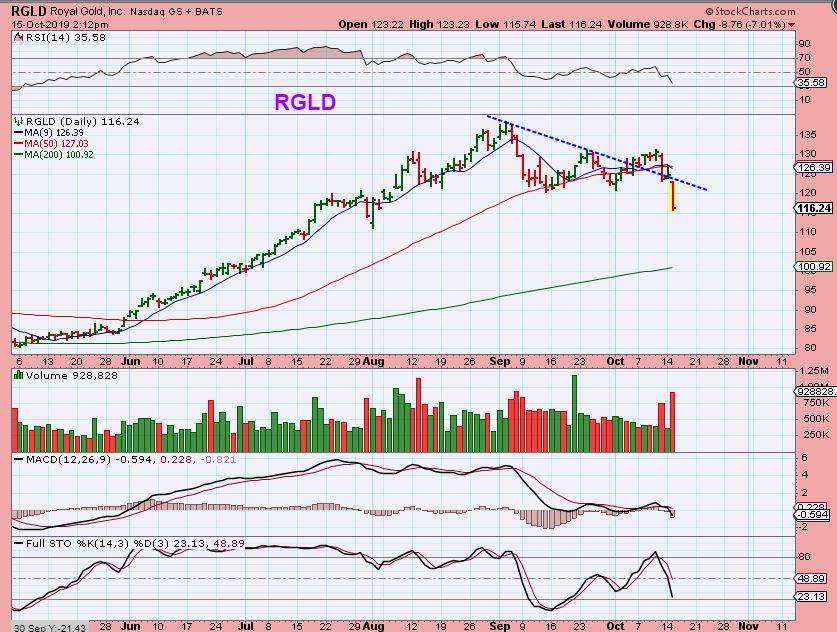
With that chart of AG above, I want to go back to RGLD last week. This also looked bullish, broke a down trend, recaptured the 50 sma, but…
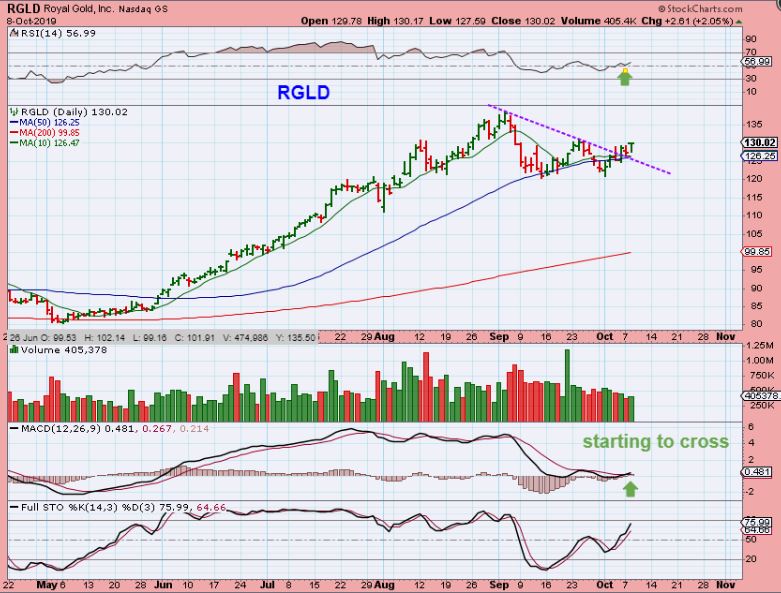
RGLD – It still rolled over & failed. So AG might be bullish today, but until we have an ICL, it can be vulnerable.
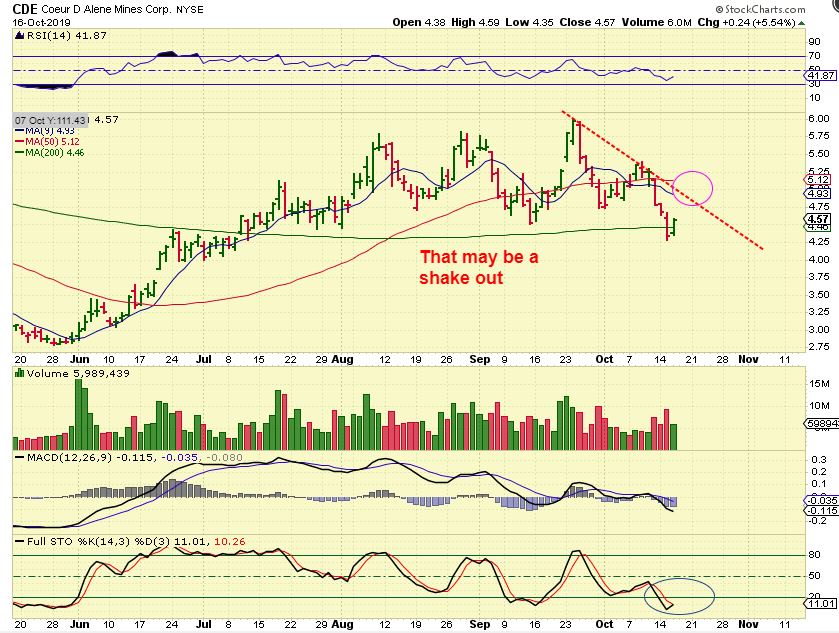
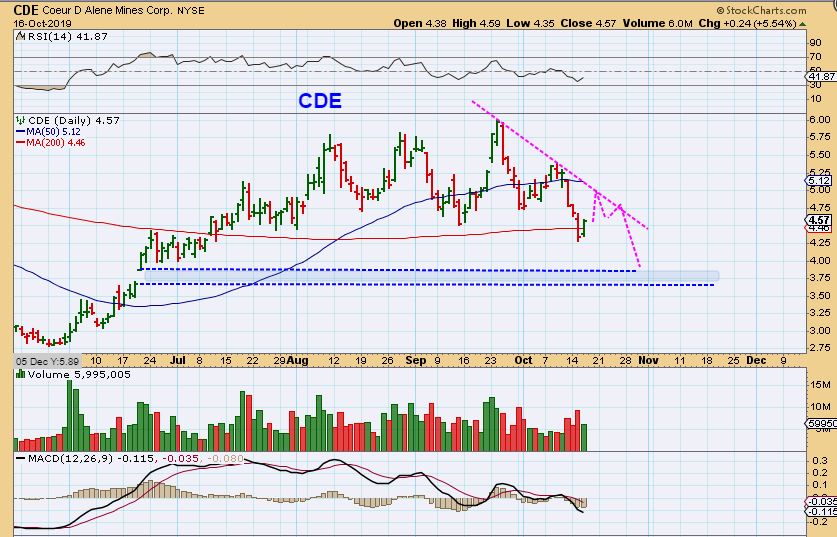
CDE – CDE lost the 200 sma and recovered too. Normally I would buy this too, since it is very oversold, but I still think that the ICL is ahead. Actually, CDE could have been bought at $4.50 & sold at $5 if it bounces there. That’s a good 50 cent/ share trade, but I didn’t buy it, and…
,
CDE – Though the reversal is bullish, this CAN still happen, a drop to the gap. I am personally being patient in this area.
.
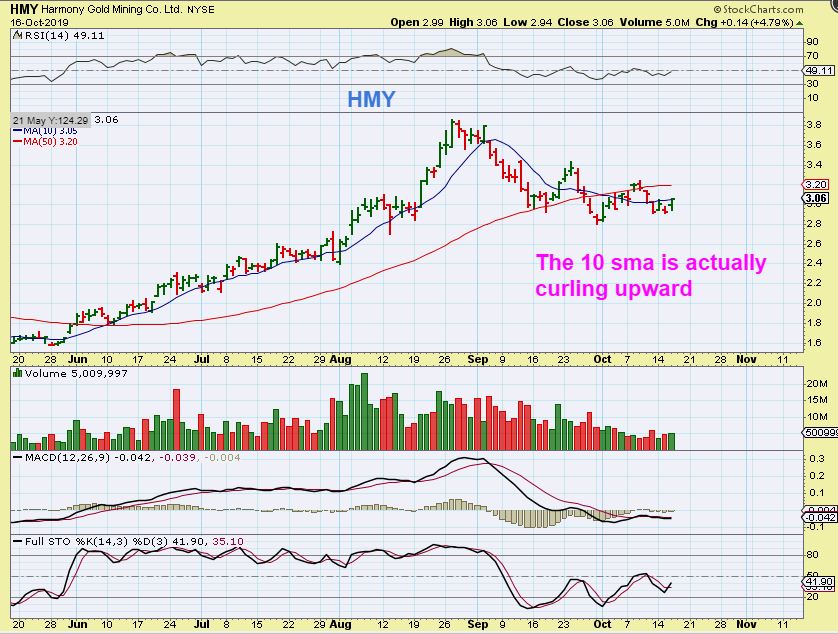
HMY – This is also bullish looking with a 10 sma curling higher, but again, I want to be patient for now. I do want to re-buy HMY. It ran steady for me on the last run.
BARRICK GOLD – Many Miners are tagging their Bollinger Bands & bouncing, but that is normal too. Look at the sell off in March to the may ICL. There were many reversals and bounces, but the trend was still down.
.
.
– The General Markets are still climbing up out of their DCL, but as a reminder, this is the 3rd daily cycle & it could form as left translated, so we’ll just need to Stay Frosty & use stops ( trailing stops).
– Oil & Energy remains choppy at the lows, I’m not invested there.
– It looks like we are going to get a bounce in Gold, Silver, and the Miners, but price should remain ‘heavy’ until the lows are in place. We have overhead parameters to keep an eye on, and it has been choppy & sideways during this daily cycle. The 10 sma, 50 sma, and trend lines remain overhead.
.
I’ll discuss a few trades below, many trades are actually playing out bullishly. Enjoy your Thursday trading!
.
~ALEX
.
FIT – Fit was mentioned as a buy if it finds support at and reverses at the 200 sma.
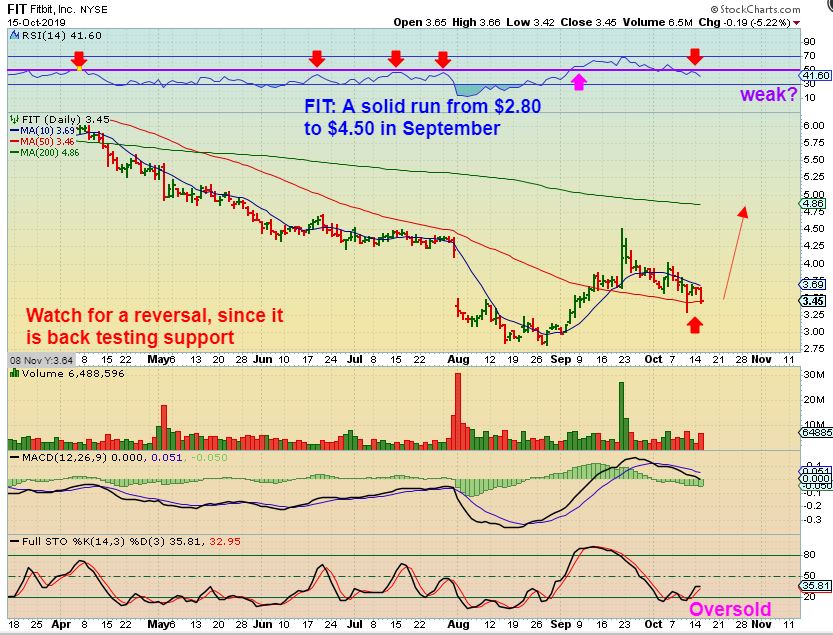
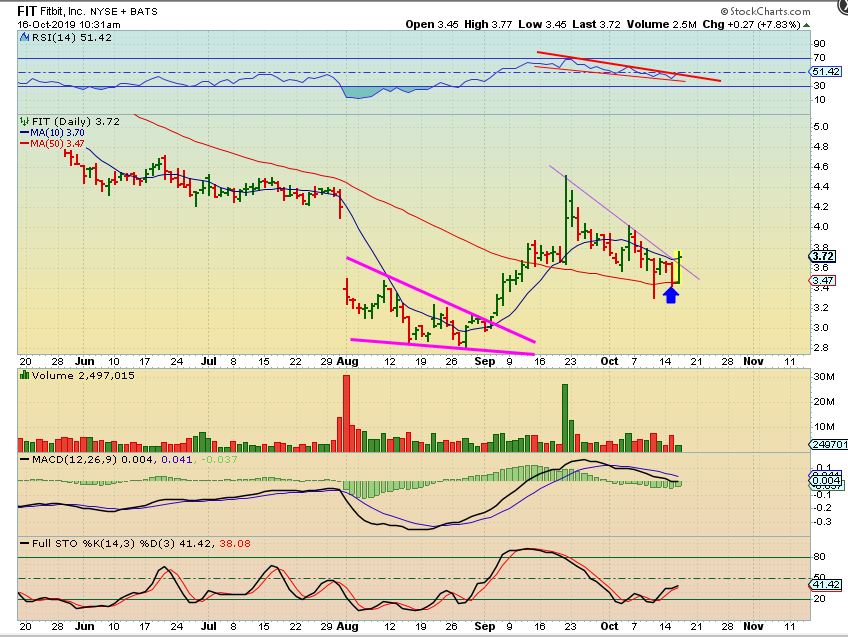
FIT – It reversed, broke higher, and broke the down trend from the open on Wednesday. I posted this in the live area after the 1st hr of trading. I own it and I think that it is still a buy.
,
.
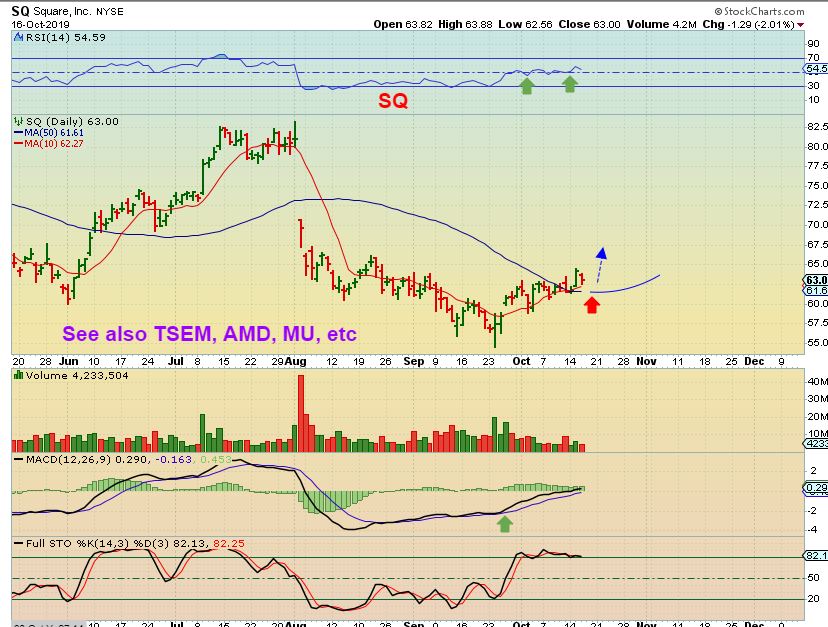
SQ – Several Tech stocks paused, but remain bullishly aligned above that 10 sma.
.
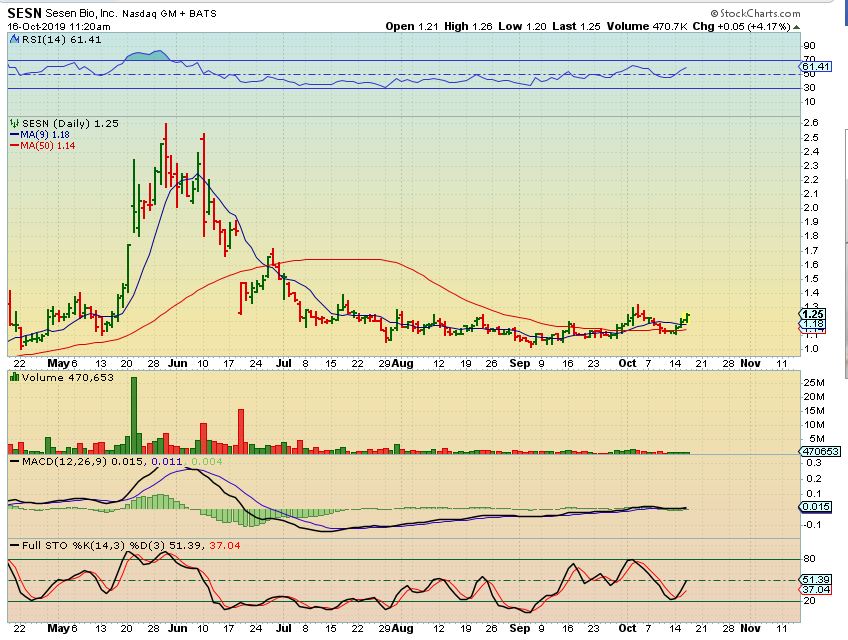
SESN – Many beaten down Biotech Stocks have formed nice bases. SESN broke above the 50sma, back tested it, and might break & run from a long base.
,
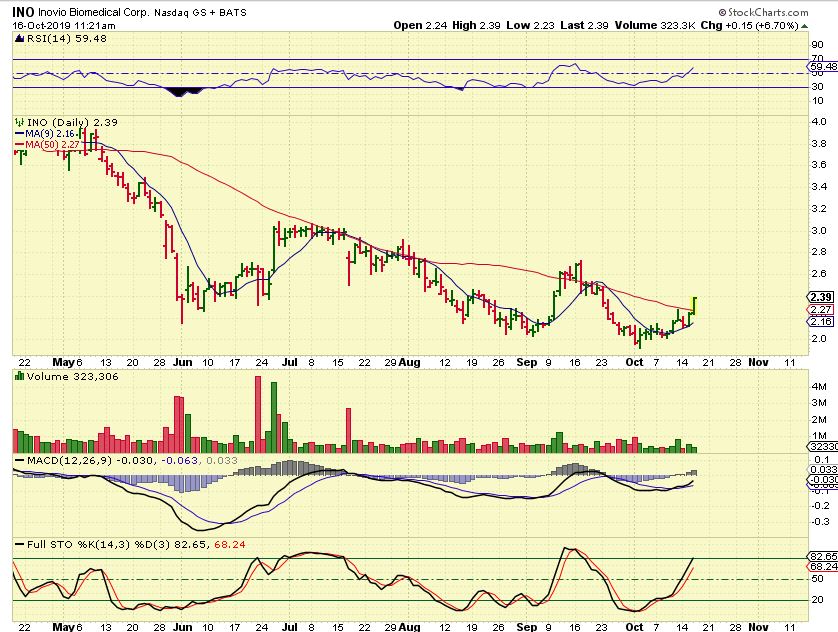
INO – I captured this at 11:30 as it broke out. It kept running & closed up 12%, but if it forms a bull flag or tags that 50sma later, it would be a buy opportunity.
,
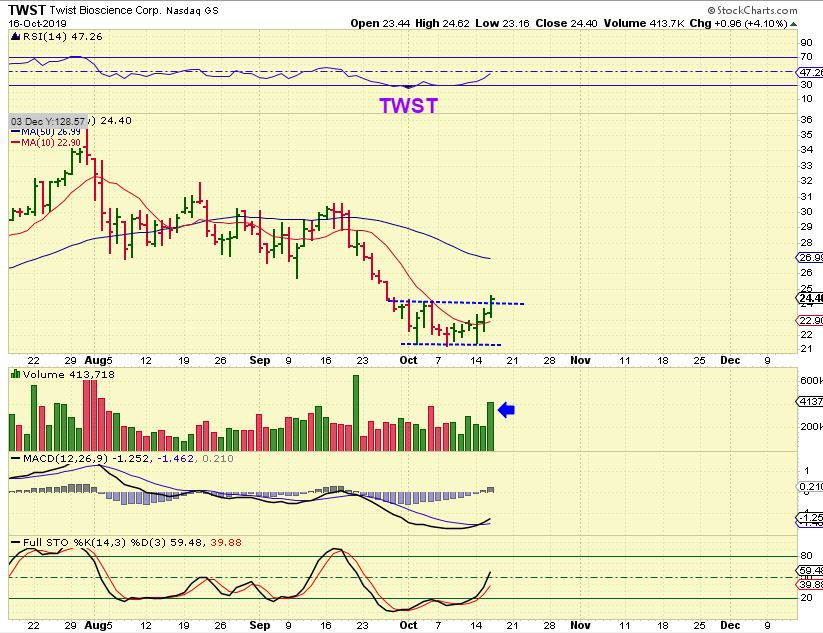
TWST – TWST is trying to recover too.
NM – In Yesterdays report – I mentioned to watch for a bull flag or flat top wedge to possibly form. It could be followed by the next leg up.
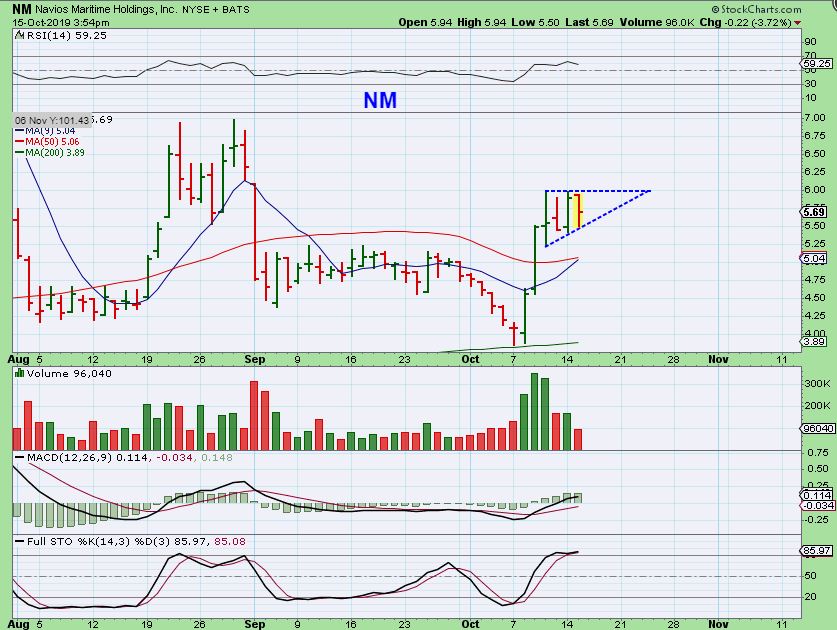
NM – So far, it looks to be forming. A break from here could run to $8.

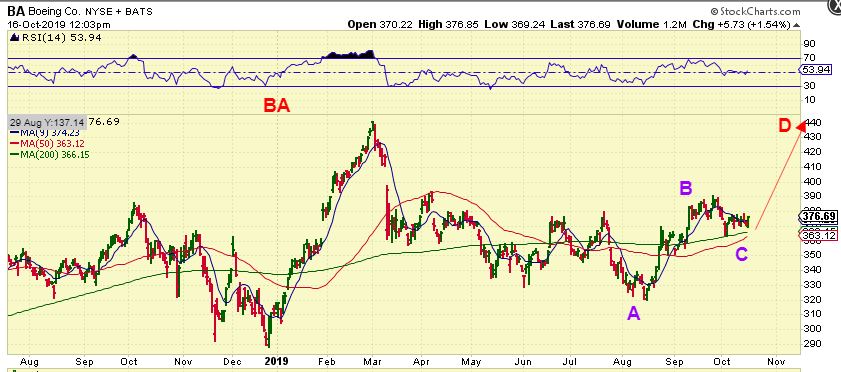
BA – Boeing rallied from August to September, consolidated those gains and found support above the 50 & 200sma. There is a good chance that if it breaks higher, it can reach $440 ( prior highs).
,
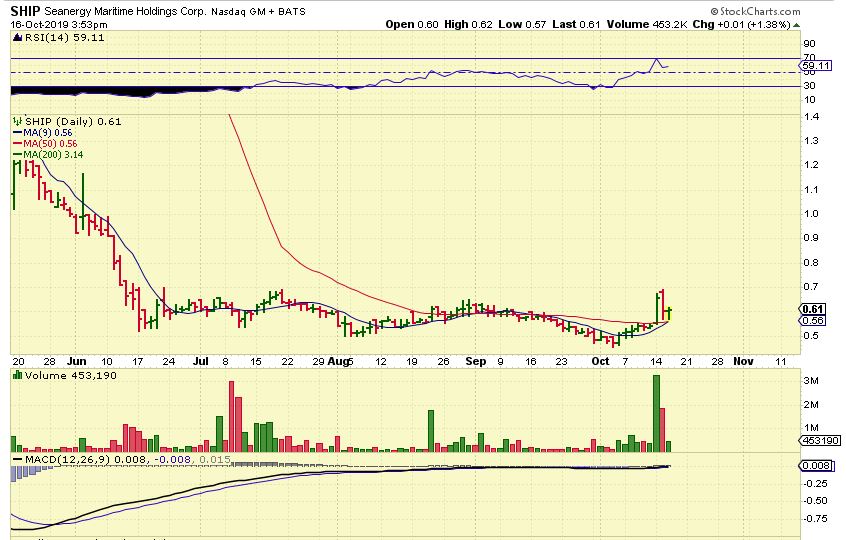
SHIP – Ship actually Popped, dropped and reversed again on the base /200sma/ 9 sma. What I wanted to show you is that when I am riding a FAST MOVING STOCK like these Shippers, I also watch it intra-days for clues as to whether I should hold or sell. This POP, Drop, and reversal looked like this …
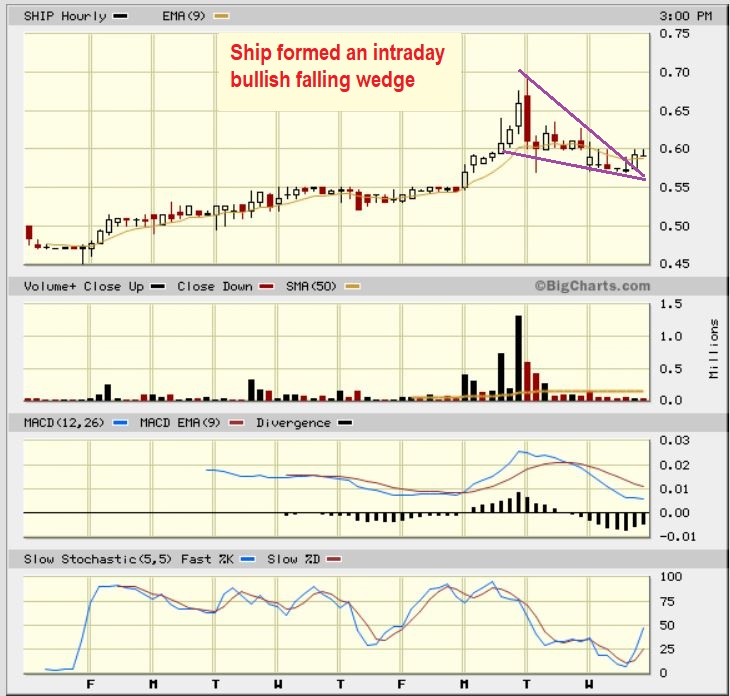
SHIP Intraday- When you break it down to an intraday chart, we had a run, a drop, and then a consolidation wedge formed. It broke the wedge at the close yesterday under 60 cents and could now run higher again,
,
,
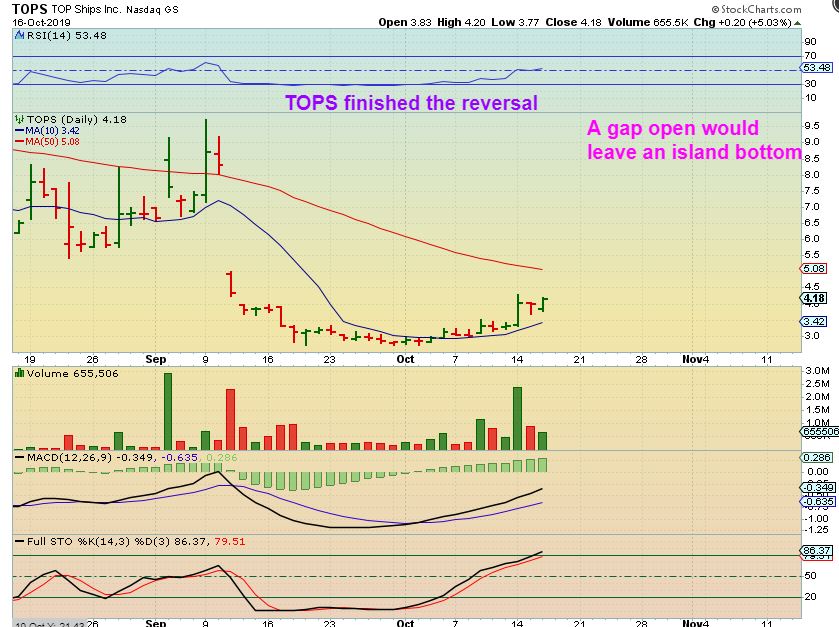
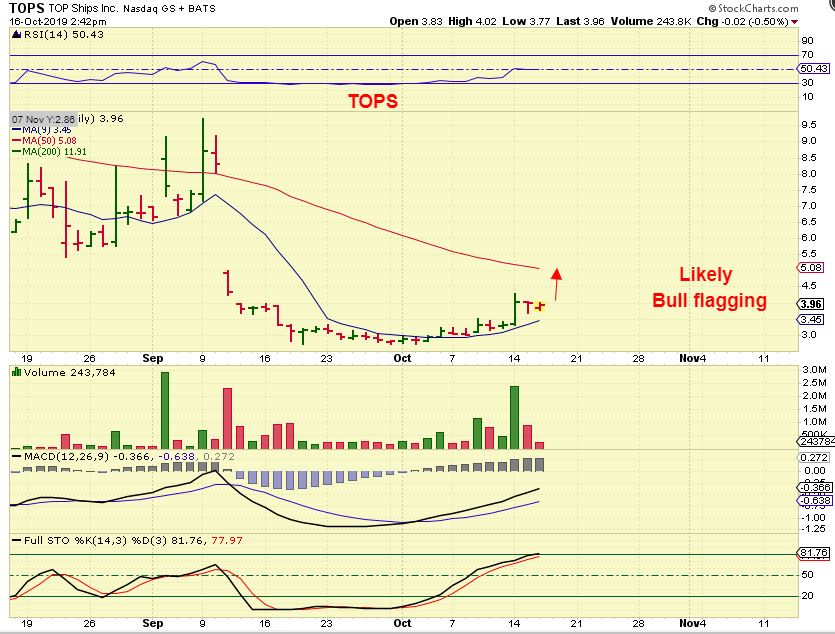
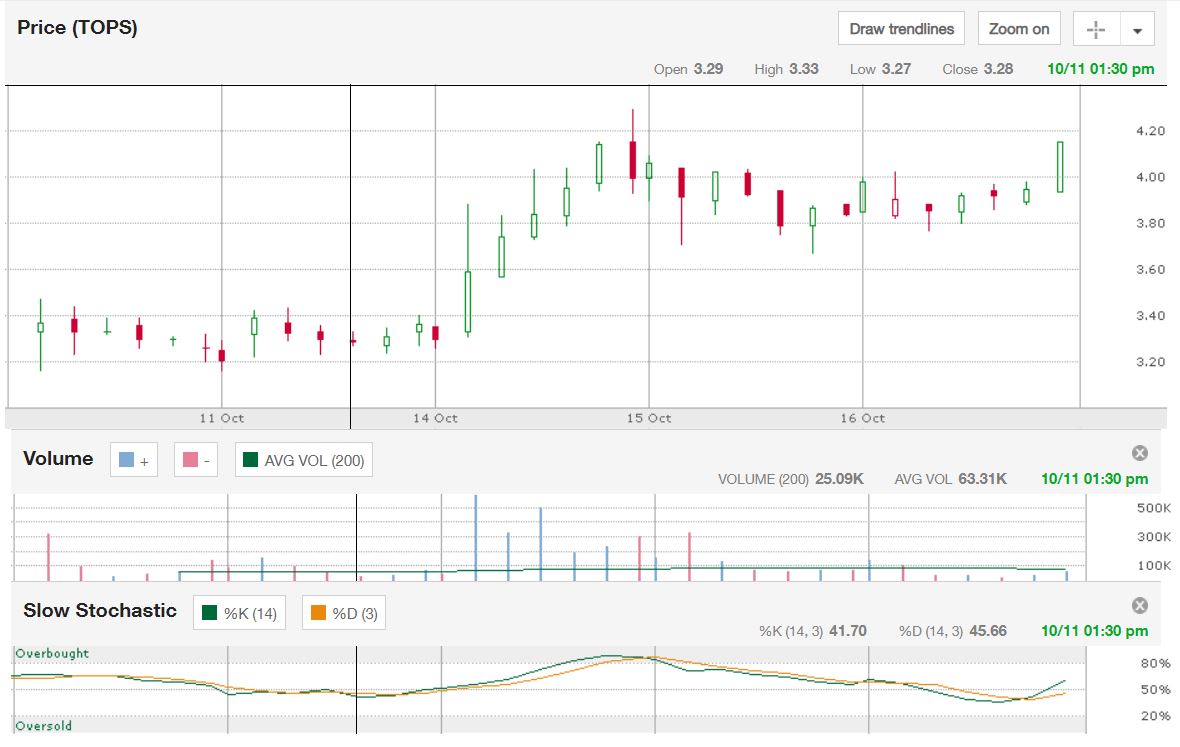
TOPS – I posted this possible bull flag in the live area, saying that I’d add if it broke higher. It was under $4. I’ve also been watching an intra-day chart for TOPS and …
,
TOPS INTRA-DAY – That sideways flag was forming a cup. Suddenly it started to break higher above $4 and on this scale, it looks like a bullish Cup.
,
TOPS – From that POP on the intraday chart, TOPS then closed up 5% and I actually saw it in after hours up to $4.60 at one point. A gap open would be an Island bottom on this daily chart if the gap doesn’t close. If it doesn’t gap, it can still run to the 50sma as a first target. This was a nice move out of the base.