Thursday October 3rd – Looking For A Swing
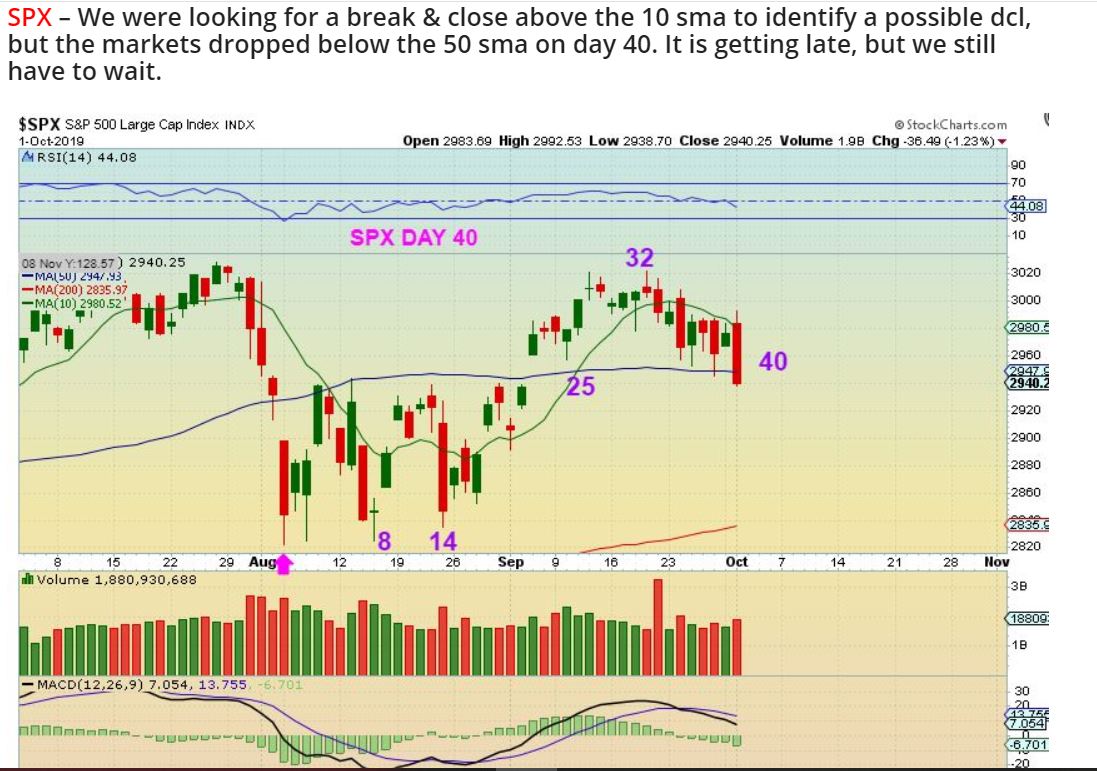
SPX – This was in yesterdays report … It was getting late cycle-wise, but we still need to wait for that Swing Low. I wrote…
.
.
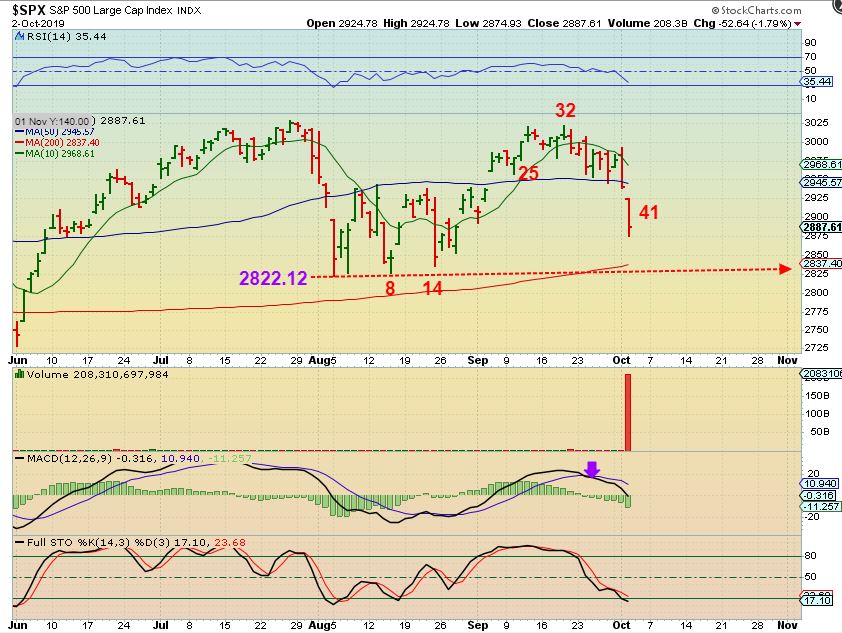
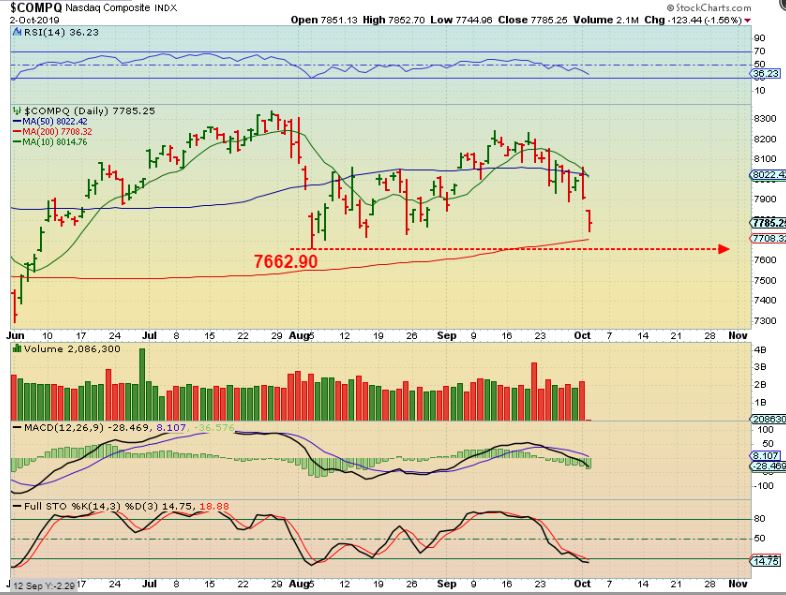
SPX – Day 41 is late, but we are still waiting for a reversal and a swing low. The 2822.12 is very important here. That is the last DCL Number.
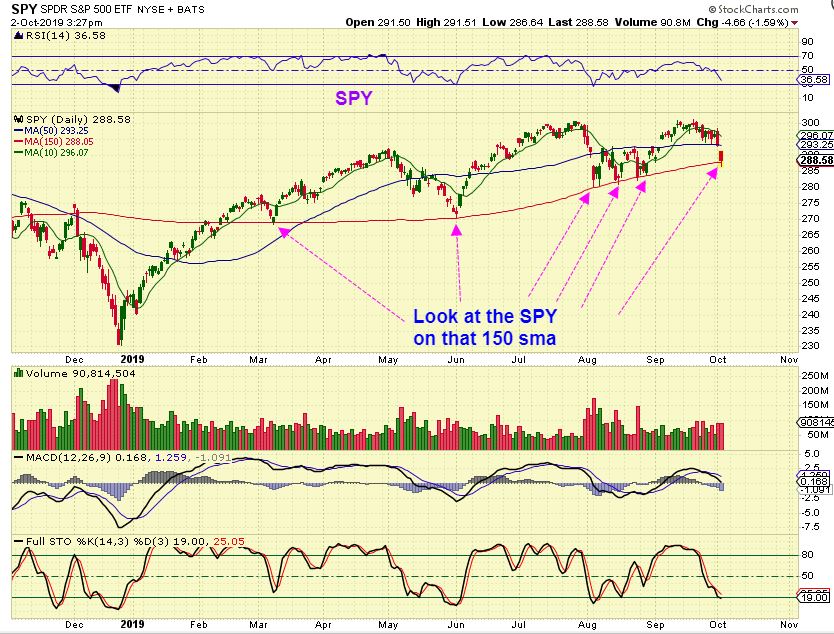
SPY – I was watching the markets midday for a reversal and drew up this interesting long term chart. I didn’t post it in the live area, simply because I didn’t want to cause people to view it as me ‘giving a buy signal’, but this COULD be a good place to look for a reversal to buy, since it worked in the past. On day 41- we definitely could be at a dcl.
NASDAQ – The NASDAQs last DCL was 7662.90. It is possibly dropping to the 200sma for a reversal.
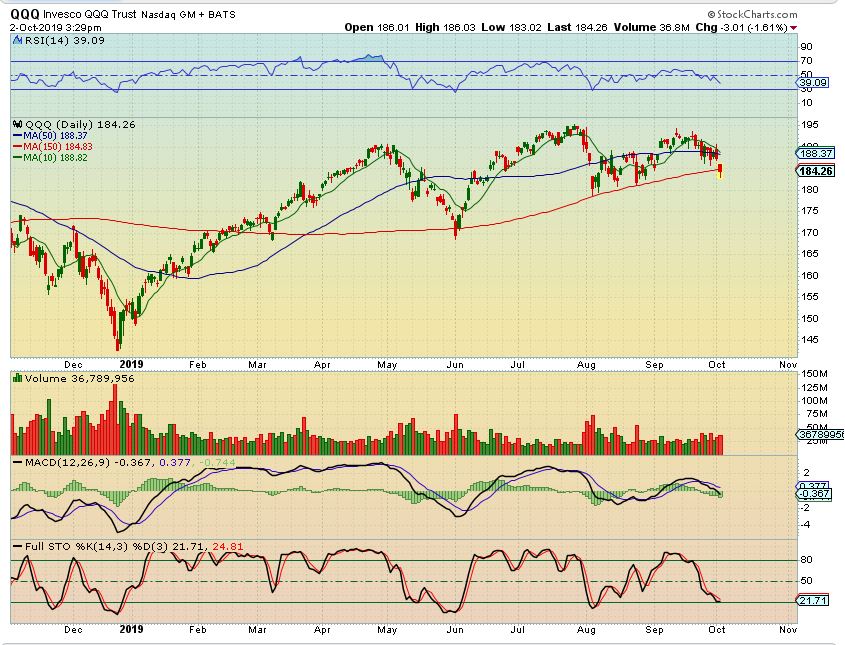
QQQ – the Q’s also are at an area that has previously acted as support. We are looking for a swing to go long if you want to be long the General Markets. ( TQQQ, SOXL, UPRO, etc are leveraged etfs and could be traded short term.
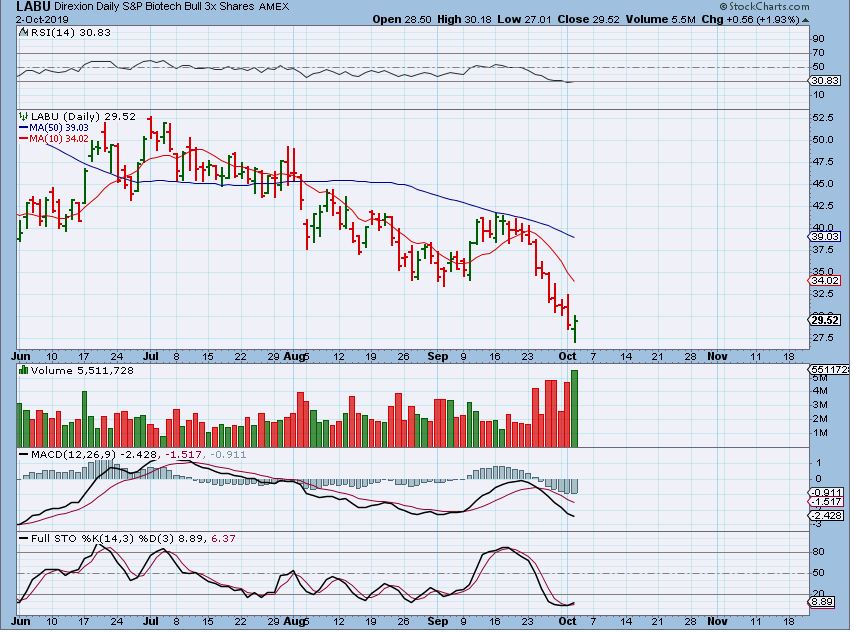
LABU or BIOTECH looks to possibly be reversing here too. This is a buy in technical analysis, with a stop under the lows. it CAN fail, but usually when accompanied by that strong volume, it is capitulation of sellers.
.
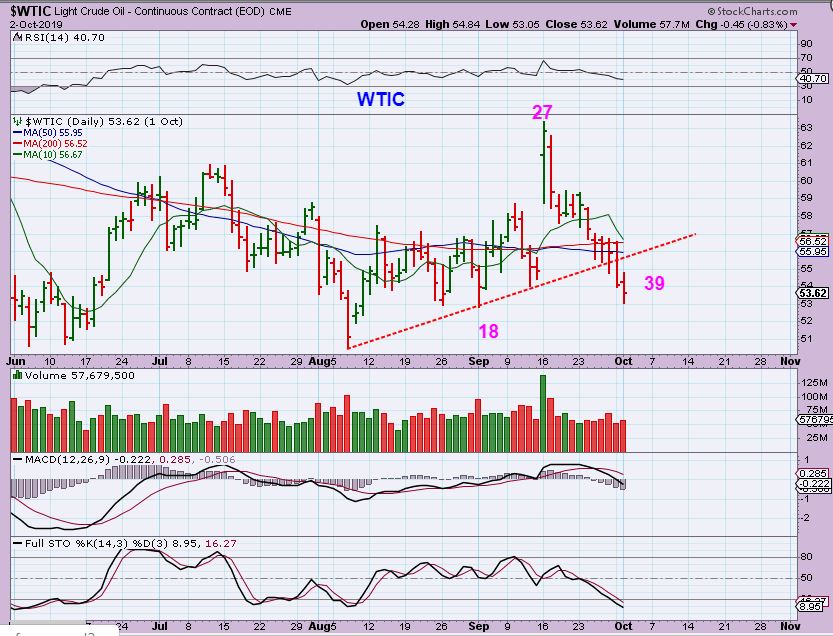
WTIC – Oil dropped further on Wednesday and Wed was the release of the Oil Inventory Report. Day 39 is getting late in its daily cycle too, but Oil does extend at times even to 50 days, so we are waiting for a swing here too.
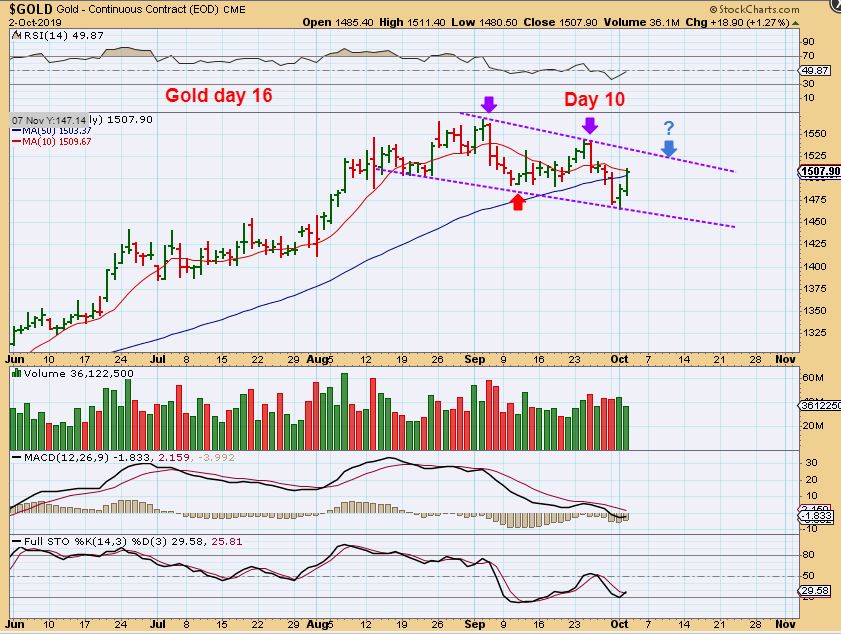
GOLD – Gold has a swing low, but this is day 16 and it seems early for a daily cycle low and also it did not close over the 10 sma . Not only that, The Miners did not seem to believe Golds 2 day push higher…
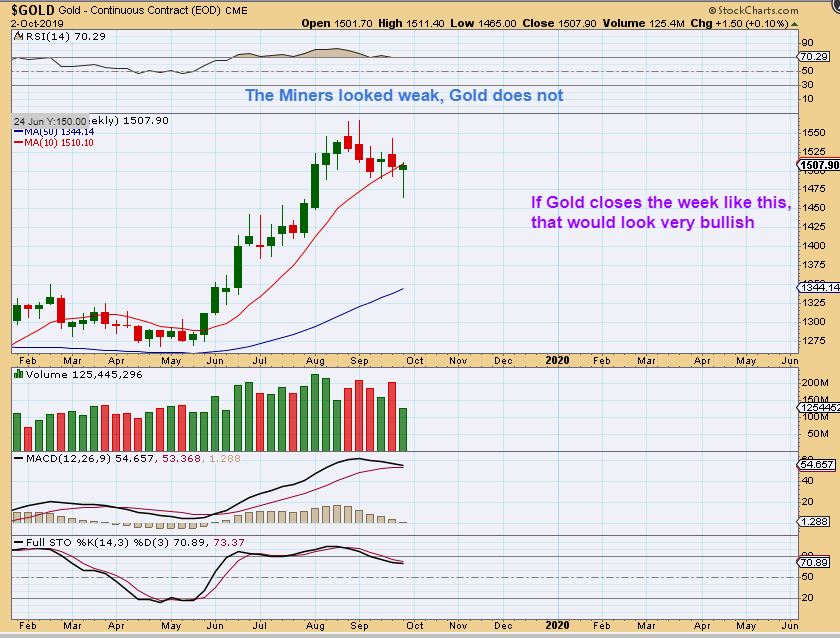
GOLD WEEKLY – I have to say- This is confusing. If Gold rises further into the weeks close, this weekly chart looks like a very bullish reversal, but Miners look weak. So I am watching the next few days closely.
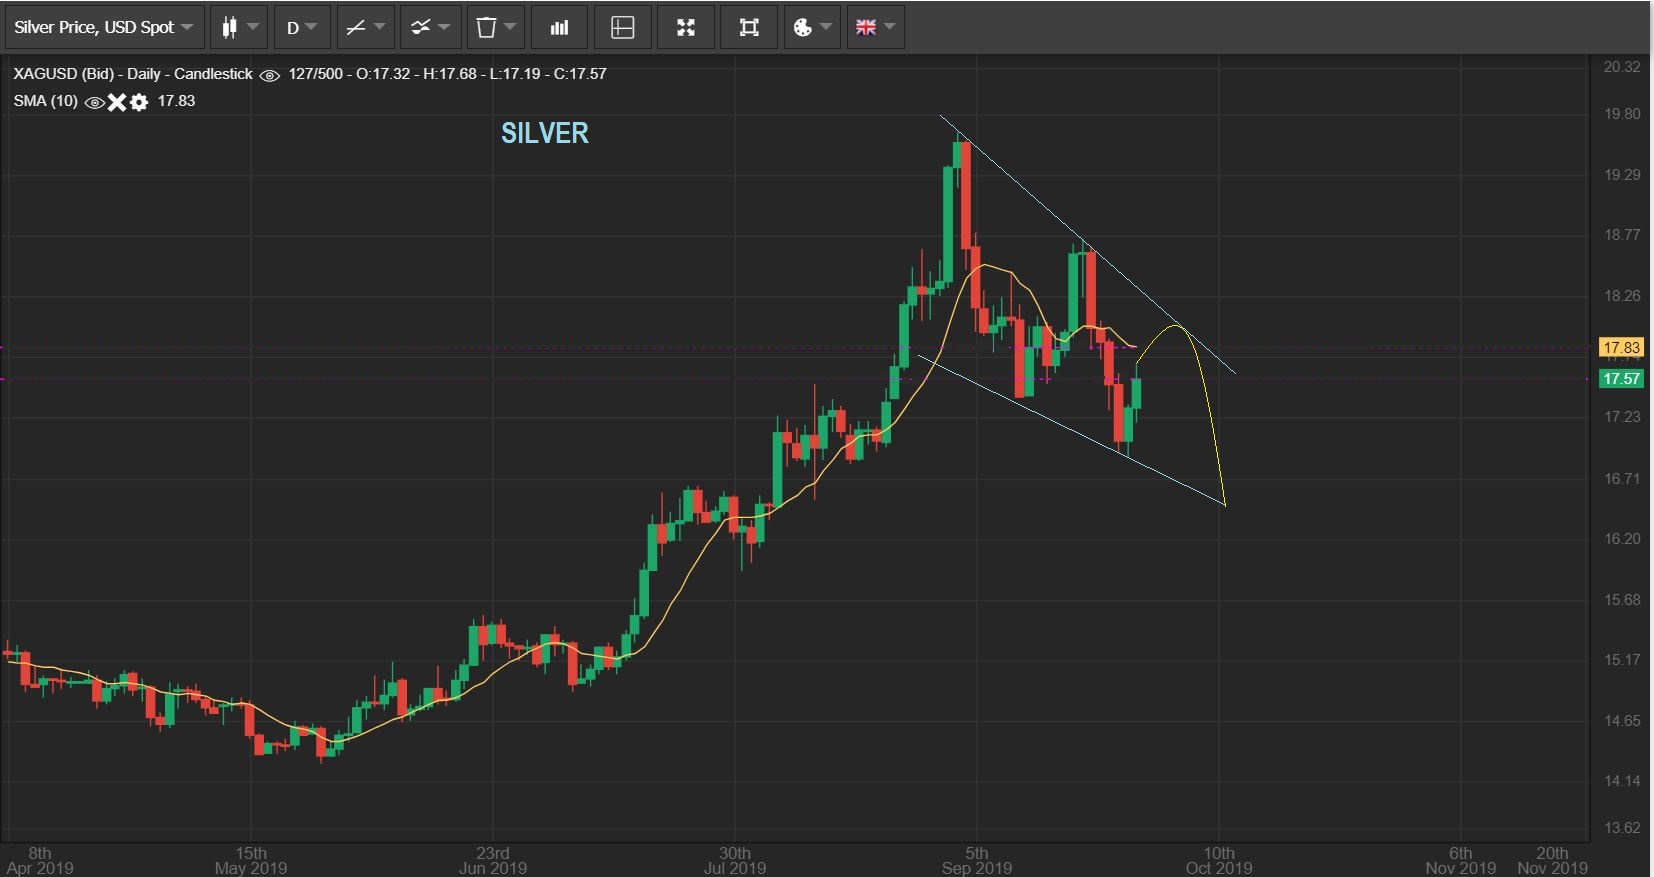
SILVER – Silver has a nice 2 day move in place, but I have drawn what we could see going forward, because again it seems to early for a dcl to be in place. This move will draw in the Bulls, but it may be to the slaughter.
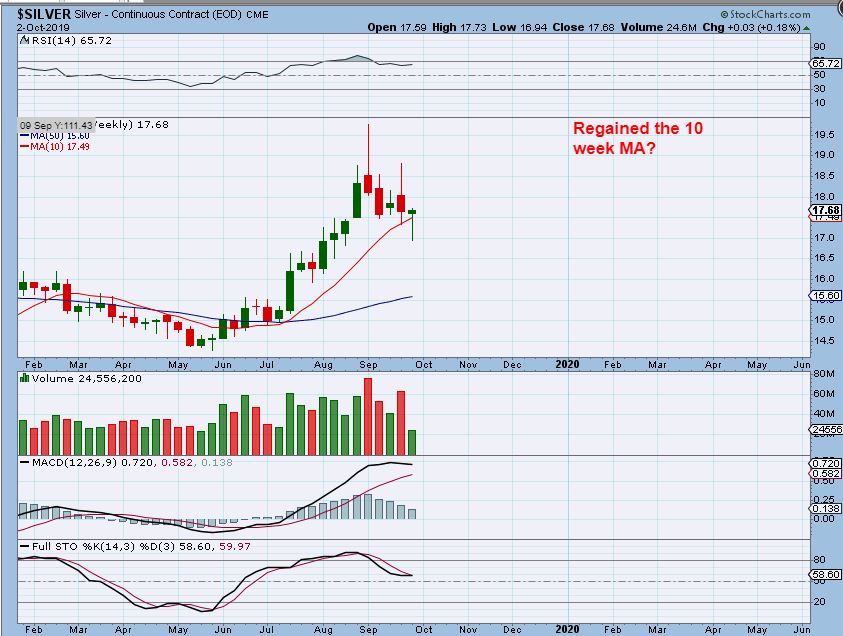
I do have the same problem with Silvers weekly chart- It looks like a rock solid bullish reversal, because it regained the 10 weekly ma & RSI started to turn up again. The chart for the weekly GDX & GDXJ does NOT look bullish, so we need more time.
.
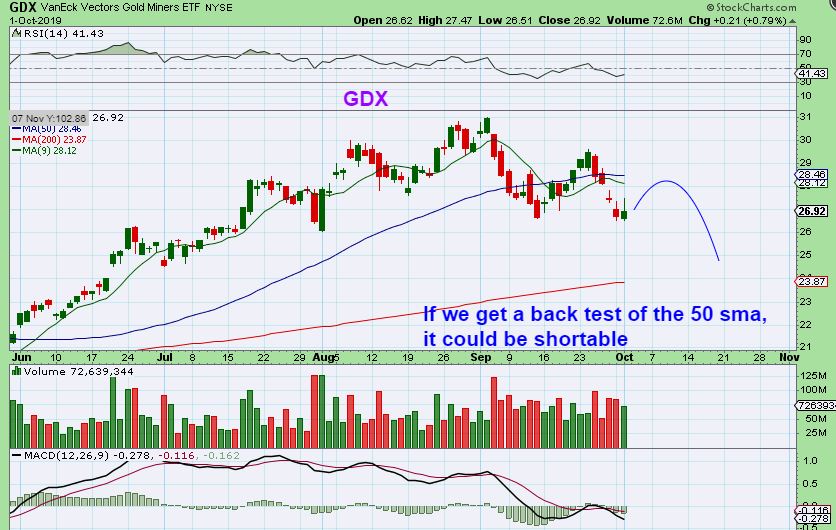
GDX FROM OCT 1 – It was possible to get a little bounce here…
.
GDX – We are getting a little bounce. I drew this at Midday, just to show that Miners do not look as good as Gold or Silver. I’d expect it to possibly back test the 50 sma or 10 sma and eventually begin to finish this drop.
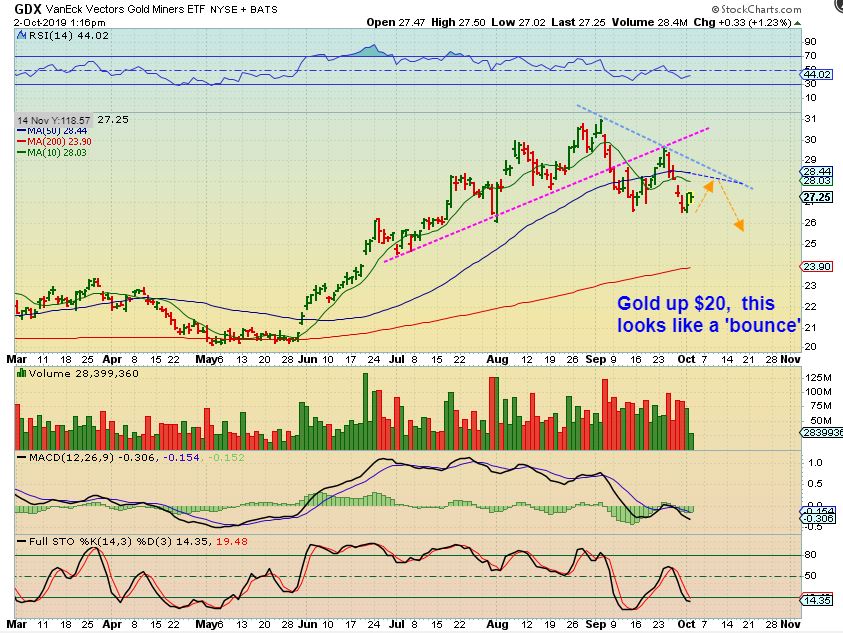
NOTE: IF GOLD & SILVER TOOK OFF HIGHER WITH THAT WEEKLY REVERSAL CANDLE, AND GDX BROKE ABOVE THE 10 & 50 SMA- WE WOULD NEED TO VIEW THAT AS BULLISH. I’m watching the blue dotted trend line, the 10 & 50sma. Miners often lead, so I am seeing that as least likely, but we do have a mixed picture here for now.
,
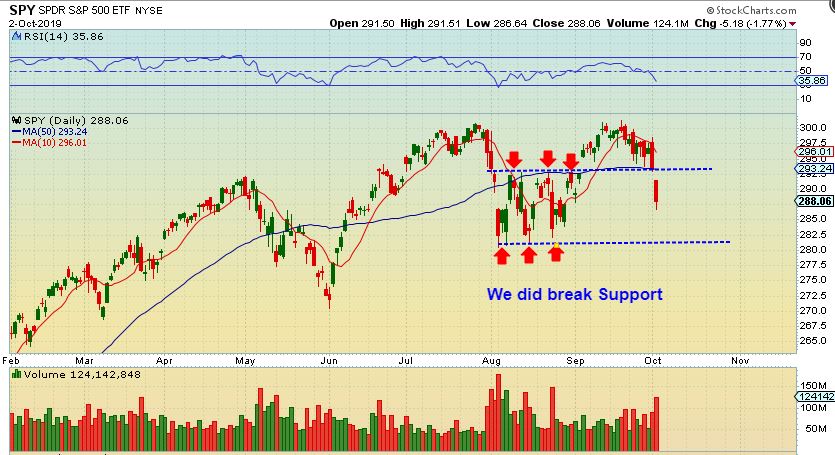
– It looks like we are close to getting a reversal and a DCL in the General Markets. It can be bought as a short term trade, and we’ll monitor as it moves higher, but the bigger picture looks to be weakening steadily. This may be a L.T. Daily Cycle that rolls over sooner than later. I’ll save that for the weekend report, but we have also broken support on a simple pull back, as seen here.
.
– Oil is also possibly close to reversing as it nears day 40, but it just keeps dropping, so waiting for a reversal and swing above the 10sma is advised.
.
– Precious Metals appear to be just putting in a bounce, but the charts are a bit mixed. I think that the bounce from Gold & Silver does ‘look’ real, so many bulls may start buying again, but I do NOT think that it is a real move, since the Miners do not look as though this is anything more than a bounce. A DCL and even an ICL should still be ahead and that should be a GREAT buying opportunity! Similar to our run from the May lows into August/ September Highs, there could be some great %-gains ahead after that low is in place. 🙂
.
We are waiting for a reversal and a swing in other sectors, so I don’t really have any low risk trade set ups for today, but the MJ Sector has started to look ‘Interesting’, so I will discuss that below for the shorter term TRADERS in our group or others that may be interested.
.
Enjoy your Thursday trading and thanks for being here at Chartfreak.
,
~ALEX
.
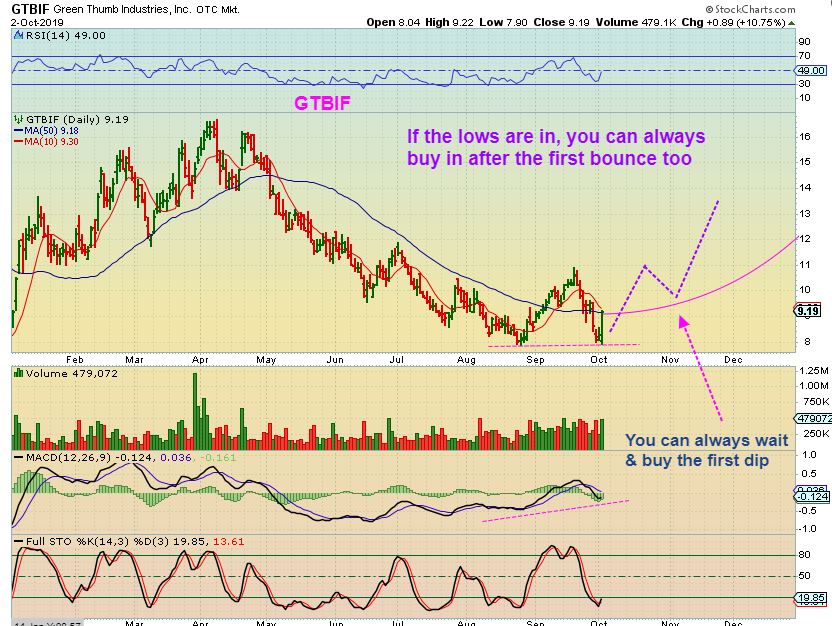
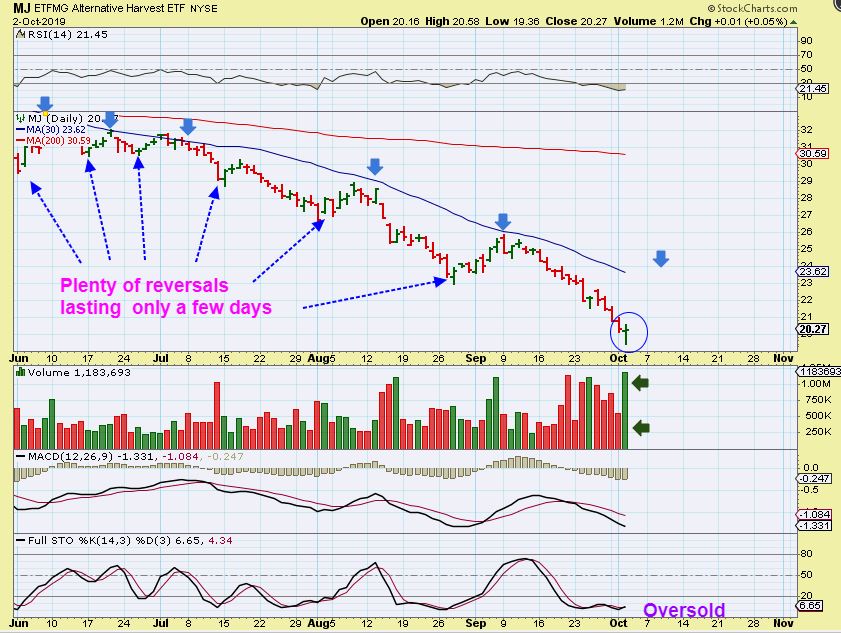
The MJ Sector and MJ Stocks are now pretty much hated. Actually, I’d say it is a combination of hated and feared after this long term sell off. Those that have tried to buy these dips have been stopped out repeatedly, but ONE of these reversals is going to be THE LOW. A bounce can be traded short term or even with a buy & hold approach to see if this is the low that will last for more than a few days, so I will discuss that…
.
MJ ETF – The MJ ETF put in a high volume reversal after a relentless sell off. The last low / bounce ran from $23 to $26, so it may be worth a trade, with a stop at the lows. Some of the individual stocks could really make big gains. Read the chart.
OWCP – I was watching this sector today and saw a few big moves start, so I captured OWCP up 23%, and then…
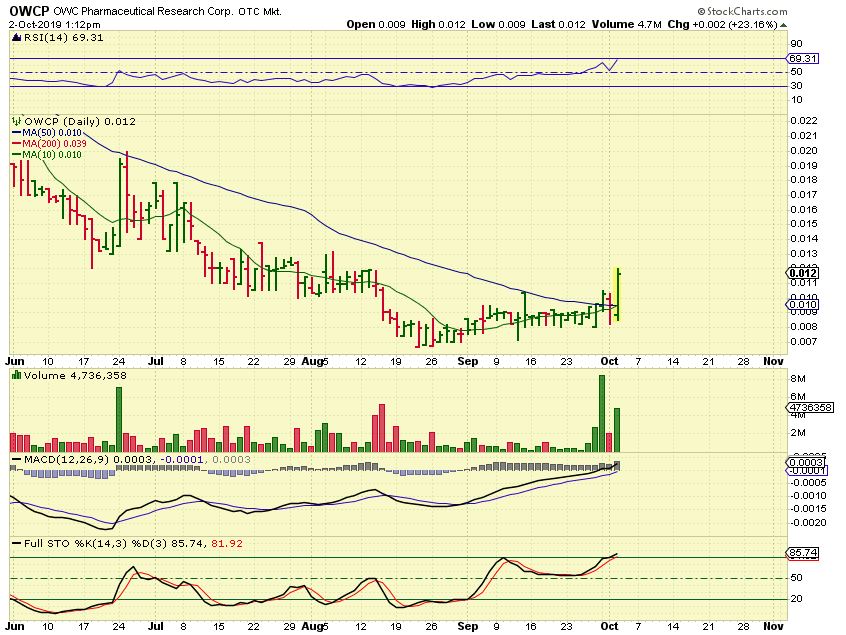
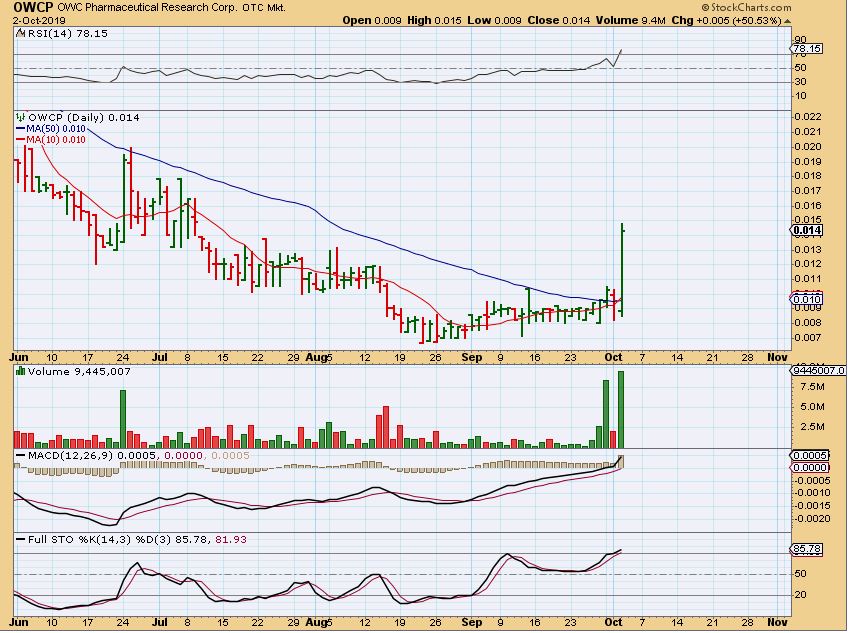
OWCP – It closed up 50%! Its a penny stock, but I wanted to look at the entire sector and see what is taking place.
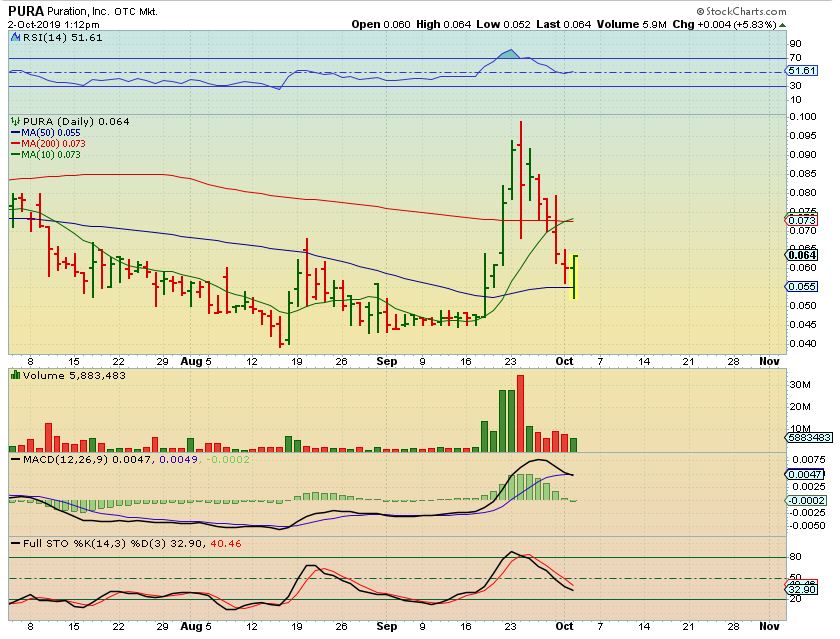
PURA – Pura went from RED to Green, here it was up 5%. Then…
PURA – Then it continued higher and closed up 16%. 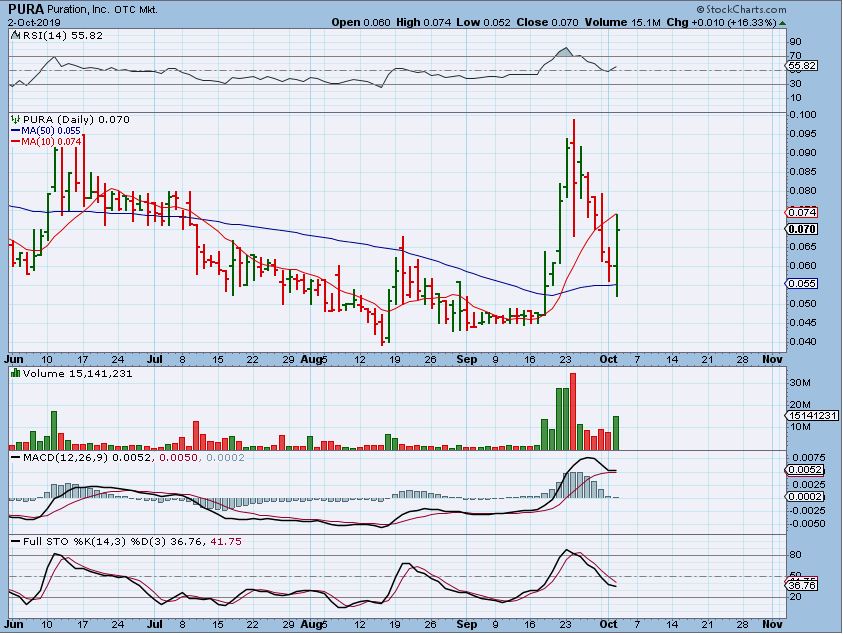
.
So is this sector about to come alive? It is very possible, let’s take a quick look and then during Thursdays trading you can check your watchlist for progress…
.
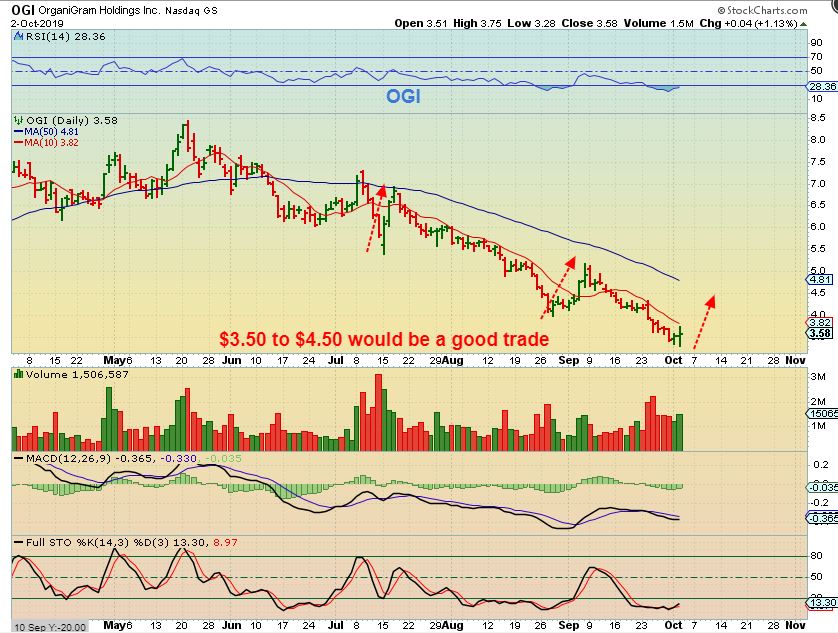
OGI – This would be a big bounce if it made it to the 50 sma. The past few reversals lasted for a few days. $3.50 to $4.50 is a good trade* I did buy this for a quick trade (maybe more).
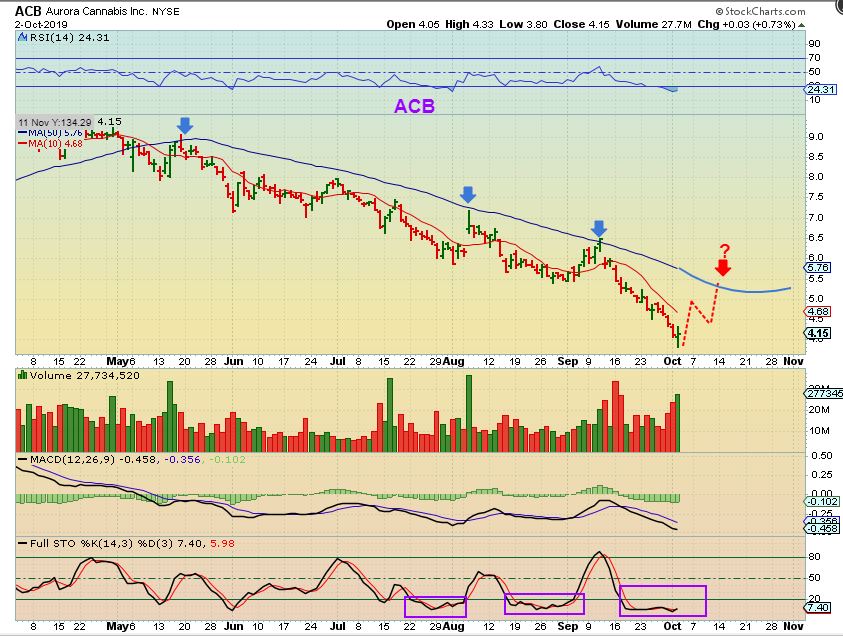
ACB – ACB also has a reversal candle and this could make a quick move higher too. I IMAGINE THAT THESE ARE BEING SHORTED , so a small short cover rally could also add to potential gains. $4 to $5+ is a good trade*
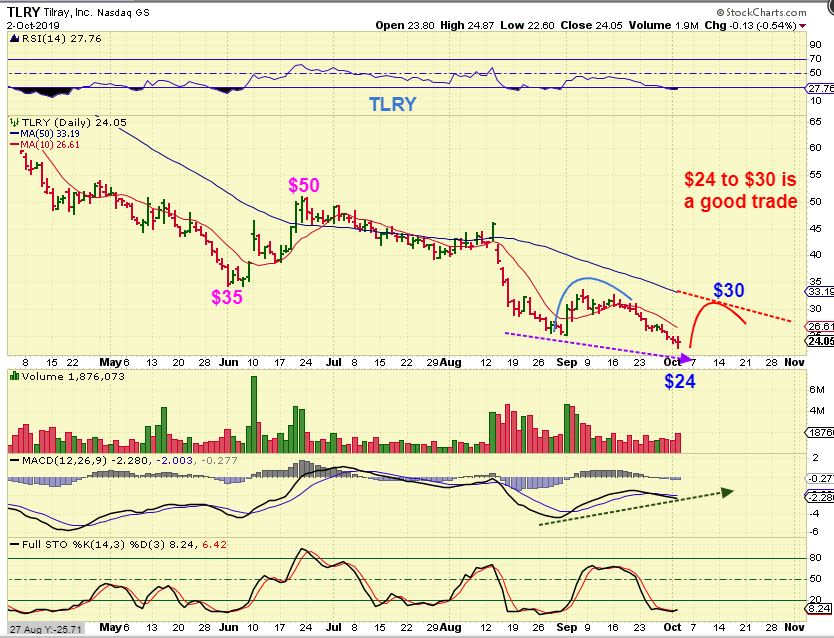
TLRY – $35 to $50 on the June bounce was a good trade… $24 to $30 would be a great trade*
When discussing OGI or ACB and I say that $4 to $5+ is a good trade*, picture it this way… You have a stop below the reversal to protect funds. If you buy 1000 shares of a $4 stock like OGI or ACB and it goes up $1 – you gain $1000. Close the trade & walk away. If you buy 2000 shares and it rises $1, and you sell? You pocket $2000. What if you buy 3000, or 5000 shares? You get the point. Those stocks could easily gain $1 if the lows are in.
.
Obviously there are no guarantees in trading, but when I see reversals all across 1 sector ( MJ) and then I see some stocks in that sector leading or making gains, it adds to the probability that it is bottoming or at least ready to bounce. CVSI may be one of those MJ Stocks hinting at some follow through…
.
CVSI – $1.50 to $2.30 in 2 days (low to high). Remember, even with the Markets selling off, the MJs reversed and CVSI had follow through higher, so this MIGHT be a sector to watch or even participate in. IN FACT…
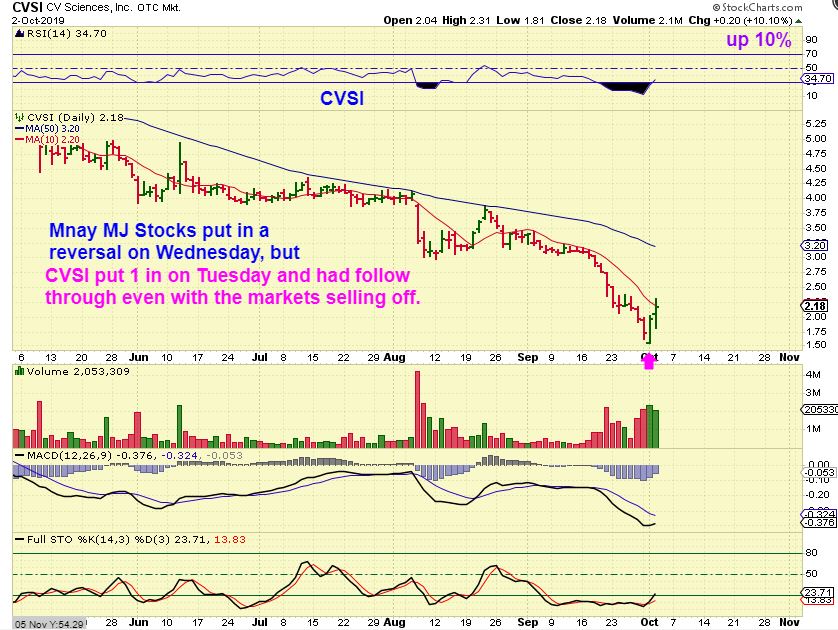
IN FACT- It may be safer to buy the next dip, but we are preparing now. These large sell offs can become Cup formations on the recovery. The potential is Big if that happens.