Thursday October 24th – Online Shopping
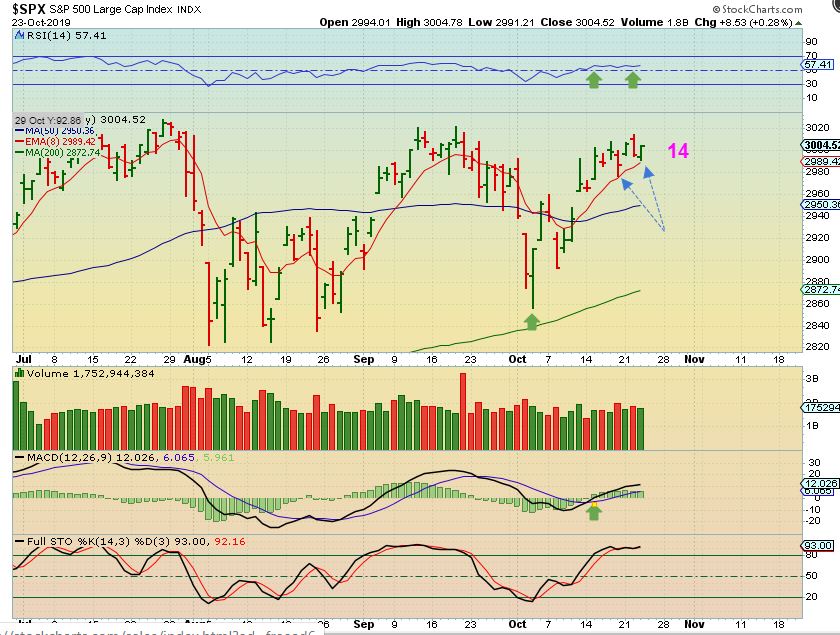
SPX – This is day 14 and The SPX ( And the NASDAQ & DJIA) held the 10 sma and moved higher again on Wednesday.
.
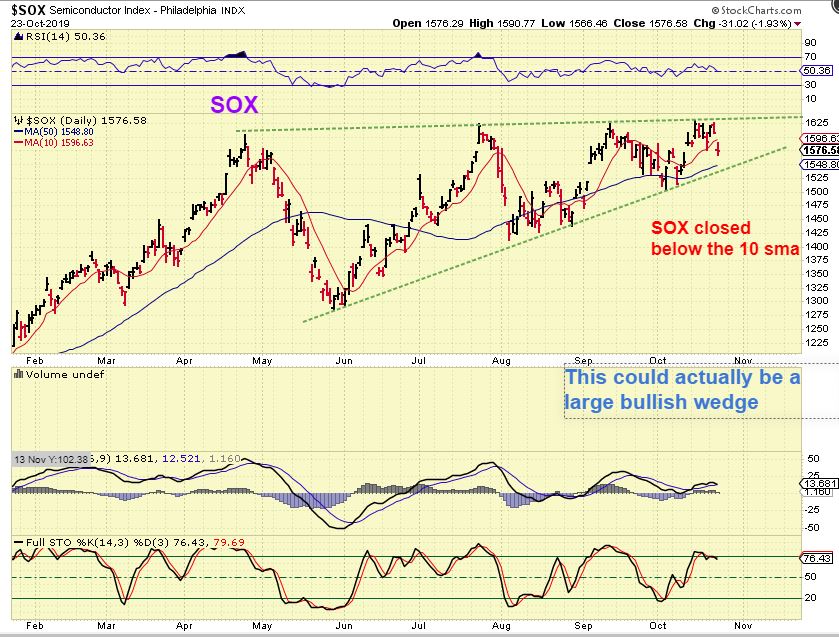
SOX – The SOX did not hold the 10sma. It is still possible that this is just forming a giant bullish wedge, so I’d watch the 50 sma & lower trend line if it gets down that far.
.
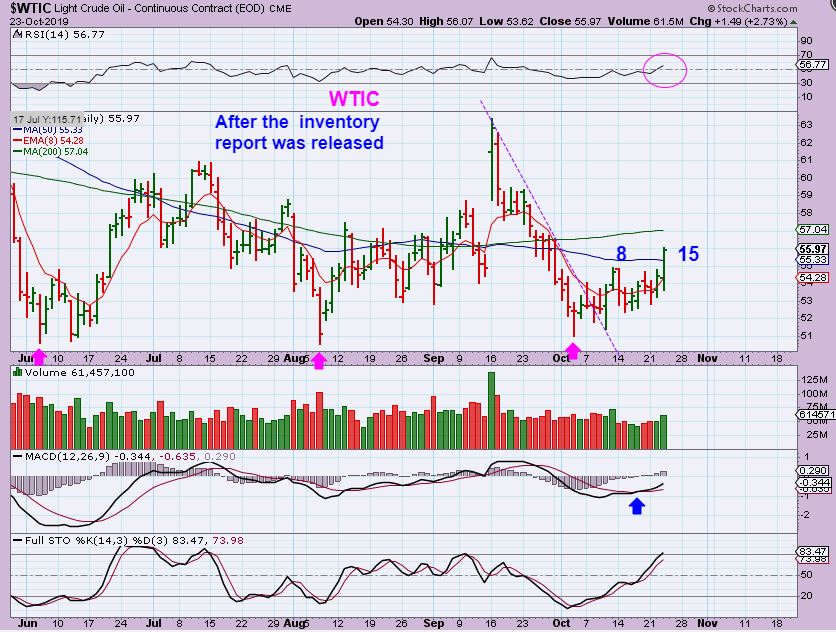
WTIC – After Oils inventory report was released, OIL really started to make some gains. On day 15 it has now broken above the 50 sma. Oil has been very choppy, so any trades in this area may just be short term, unless it can break out & finally run.
.
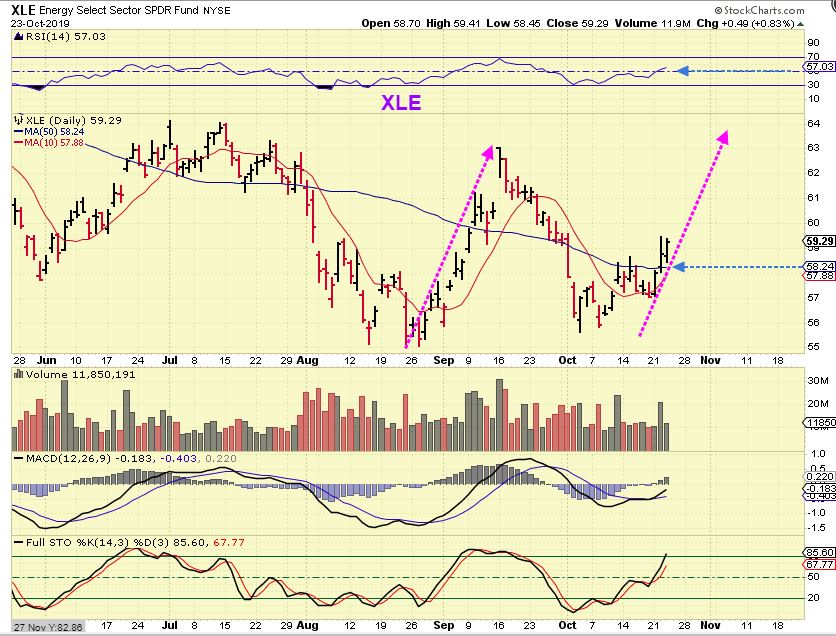
XLE – The XLE already broke above the 50 sma and it should climb higher, so Energy may have some trades setting up.
.
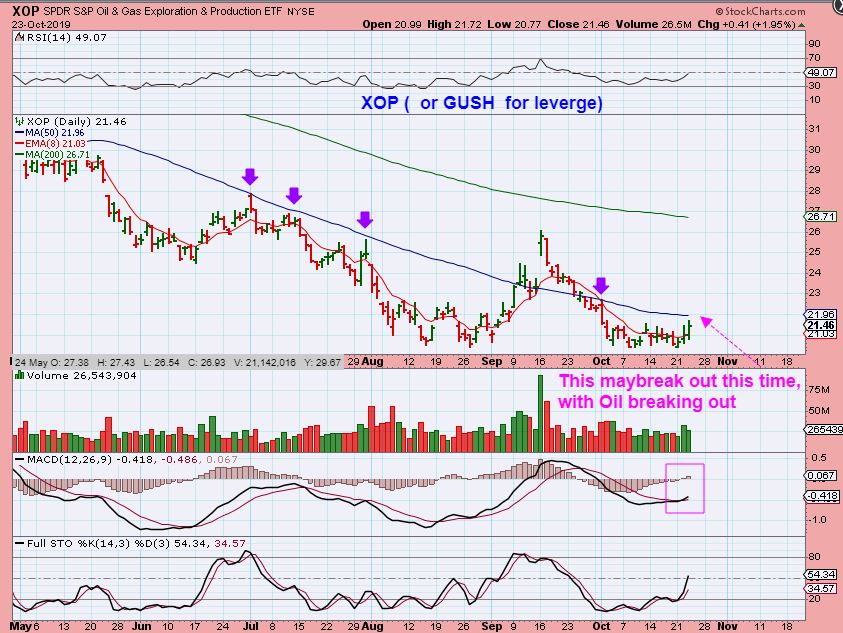
XOP – The XOP broke out in September, but gave those gains back. It looks like it may break out again ( GUSH with a stop).
.
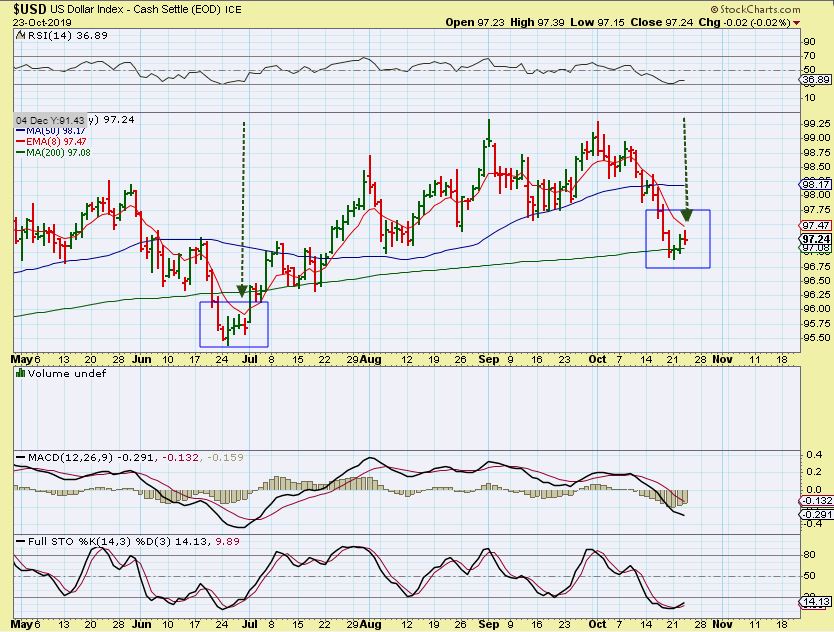
USD – The USD stalled at the 10 sma, but it did that in June too. That didn’t stop it from moving higher. This should be day 2 of a new daily cycle & I would expect it to back test the 50 sma area.
.
GOLD, SILVER, & MINERS ARE STARTING TO LOOK MORE & MORE BULLISH: WE ARE LATE IN THE DAILY COUNT, TRIANGLES HAVE FORMED, SO WE ARE WATCHING THIS CLOSELY DAY BY DAY.
.
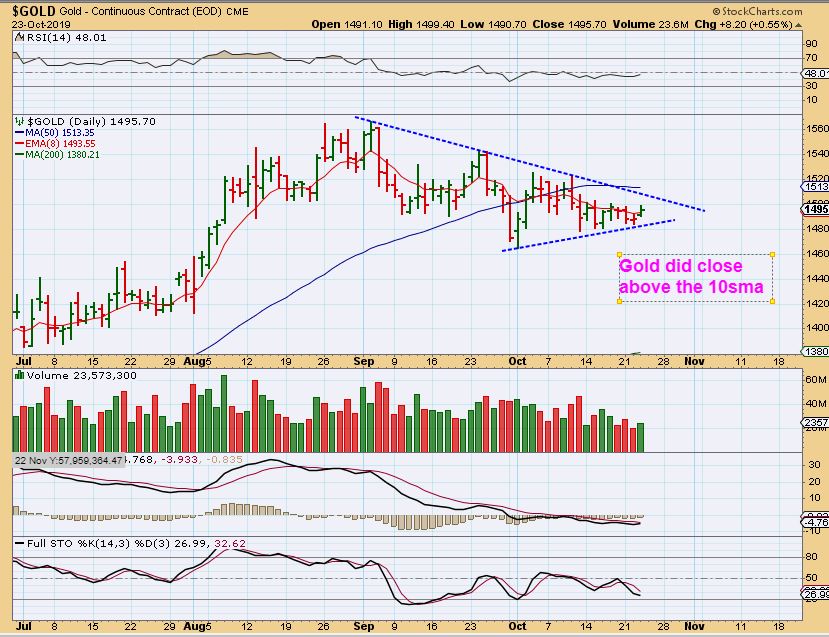
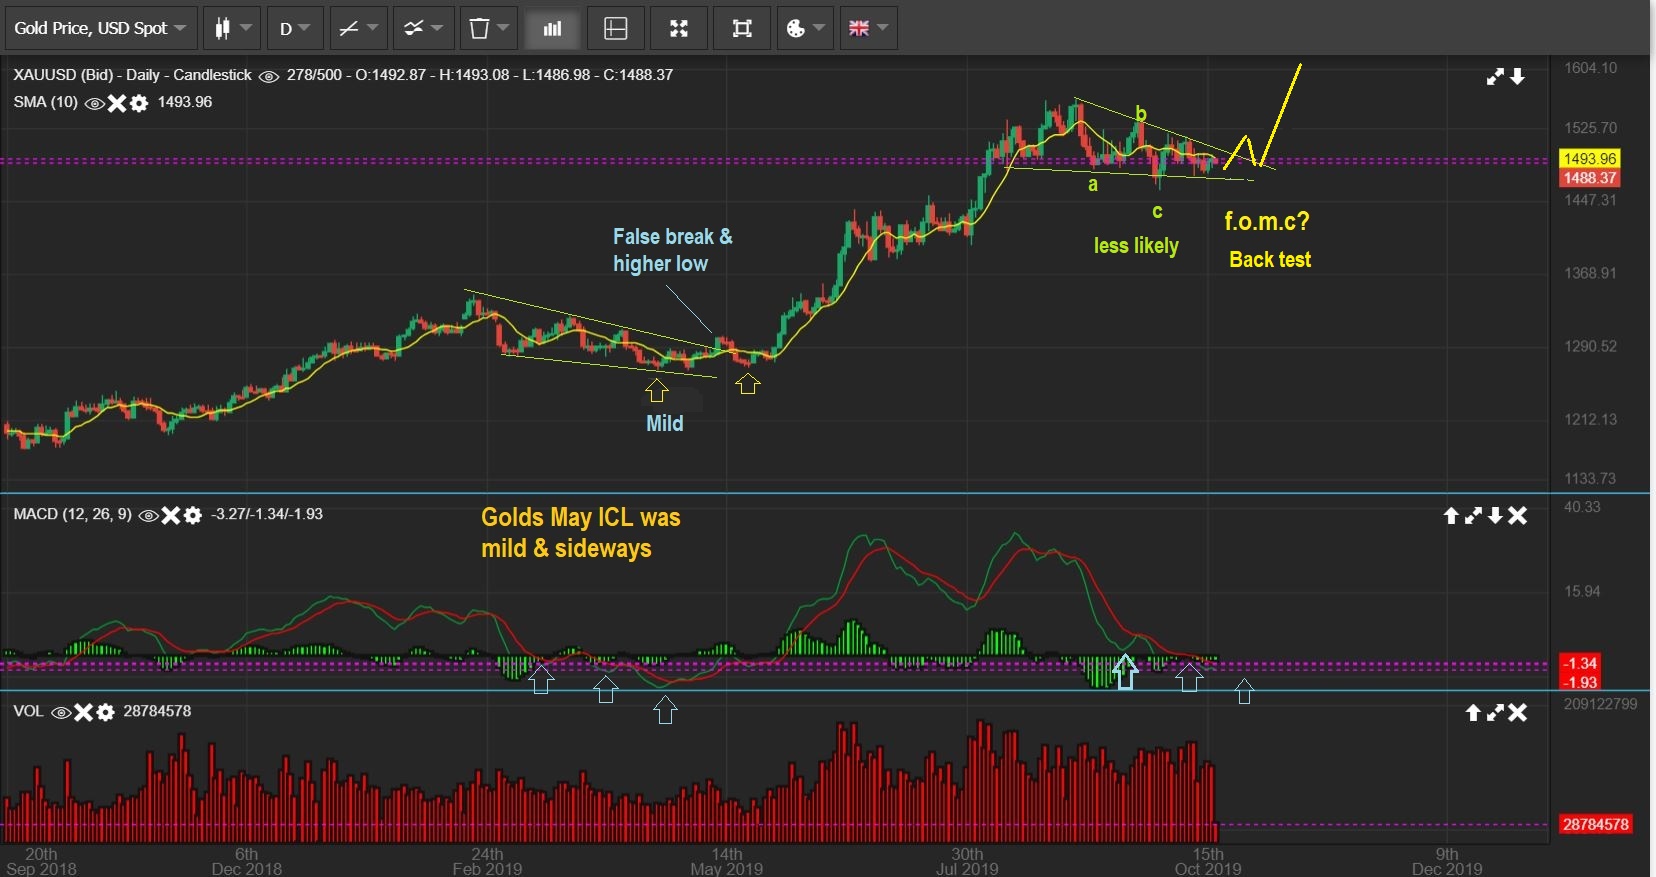
GOLD – Gold started to push higher, and it actually did close above the 10 sma. A break of the trend line would have to be considered a BUY. As mentioned in recent reports, I am starting to see Miners looking more & more bullish late in this daily cycle too. THAT is not common when we should be dropping into a deeper ICL, so I have to wonder about all of these Triangles forming. They may now be squeezing price into a break out higher, so Stay Frosty.
.
GOLD LAST WEEK – I had drawn this as a least likely scenario over a week ago. Now as time goes on, we should see ‘weak’ action, but we aren’t. This break higher does still seems possible.
,
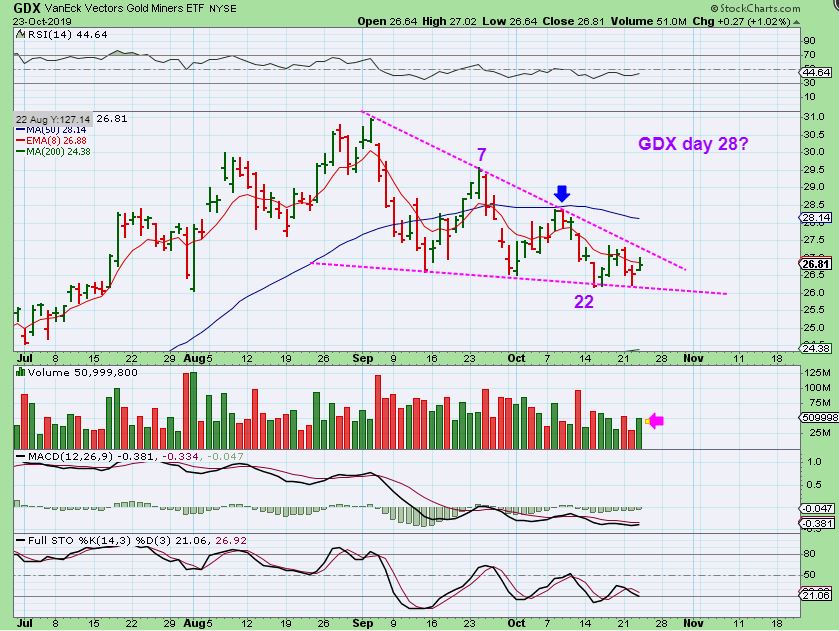
GDX – Miners also have a triangle formation, and this could be a bullish falling wedge. So far it still has a day 22 low, and this should be day 28 with a drop ahead. Let’s take a look at some miners again…
.
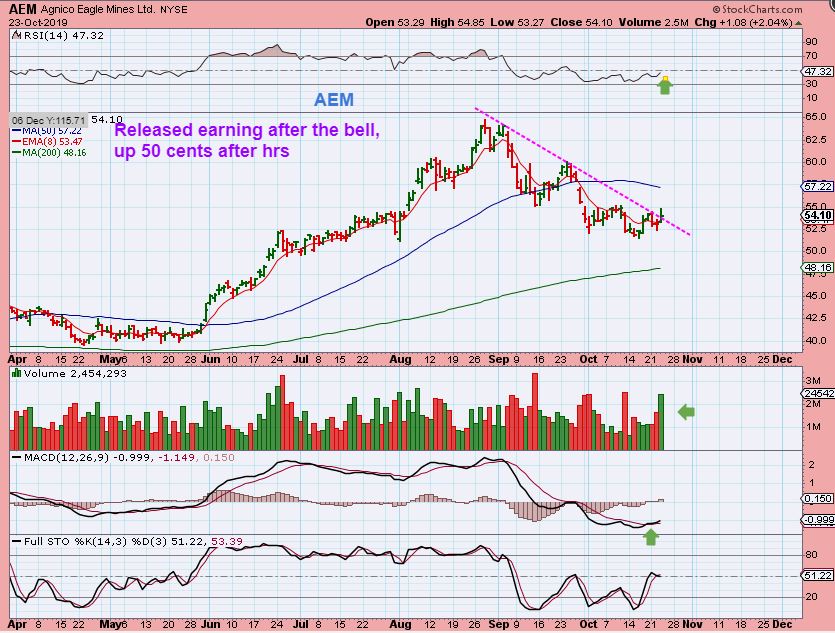
AEM – AEM released earnings yesterday, and it moved up another 50 cents. With increasing volume, it is breaking through the down trend line. This looks like it may be finished selling, and the MACD just turned higher. That was a big sell off, but I expected a tag of the 200sma.
.
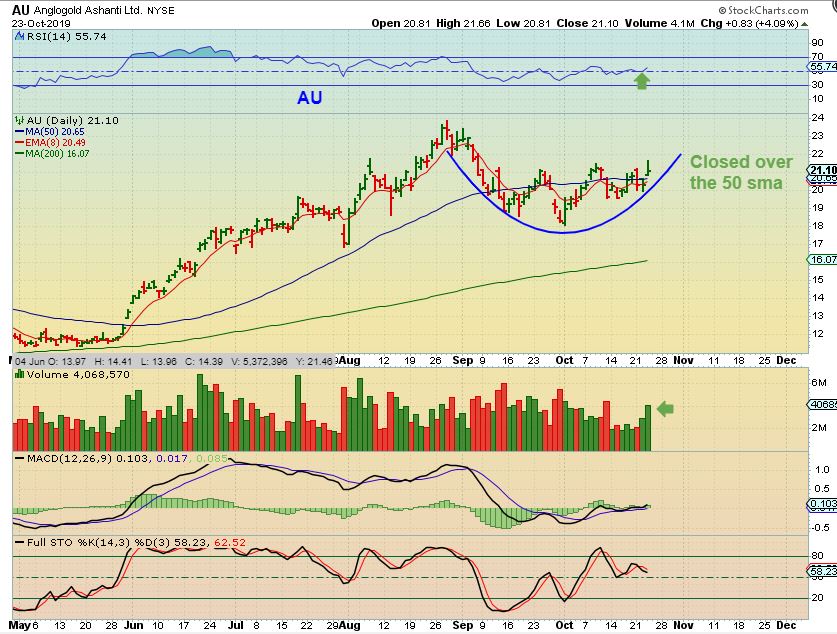
AU – AU is already slowly forming a cup. It closed above the 50 sma Wednesday and the chart looks more bullish than bearish to me. .
.
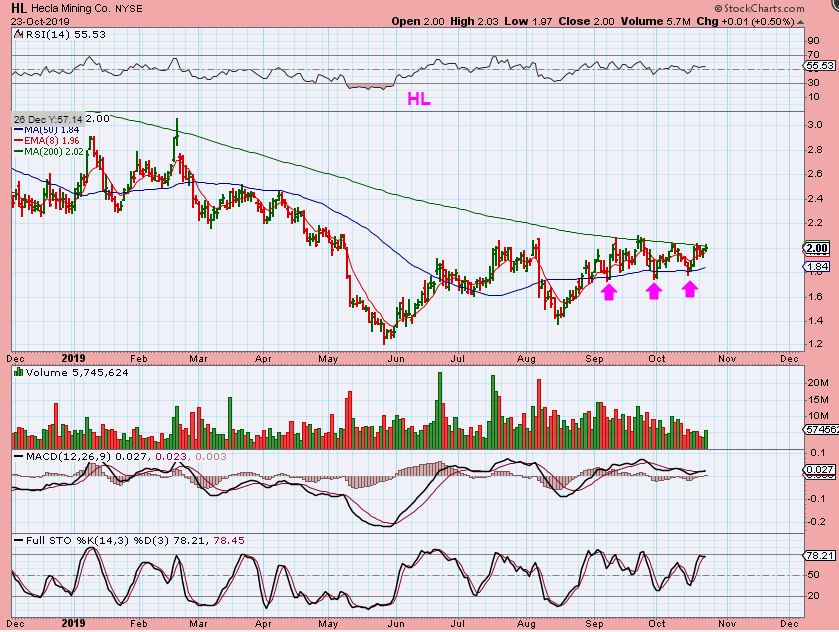
HL – HL is still pinched between the 50 sma & 200sma. I have been saying that I want to buy the break out because this long consolidation can lead to nice gains.
.
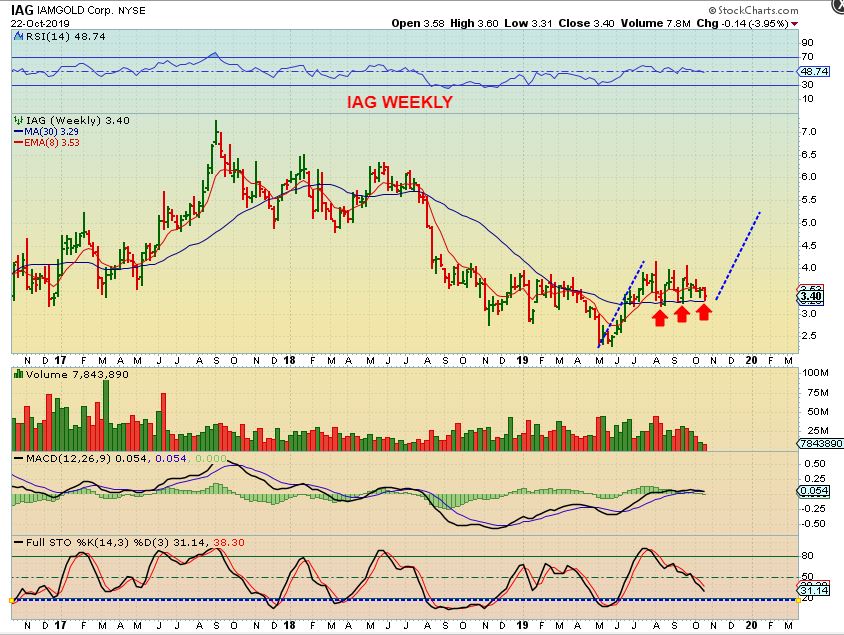
IAG WEEKLY – I have been looking at the weekly charts too, and this is an inverse H&S and price is holding that 30 week ma perfectly on each bounce. The weekly stochastics does look like it could sell off or chop a little bit longer though.
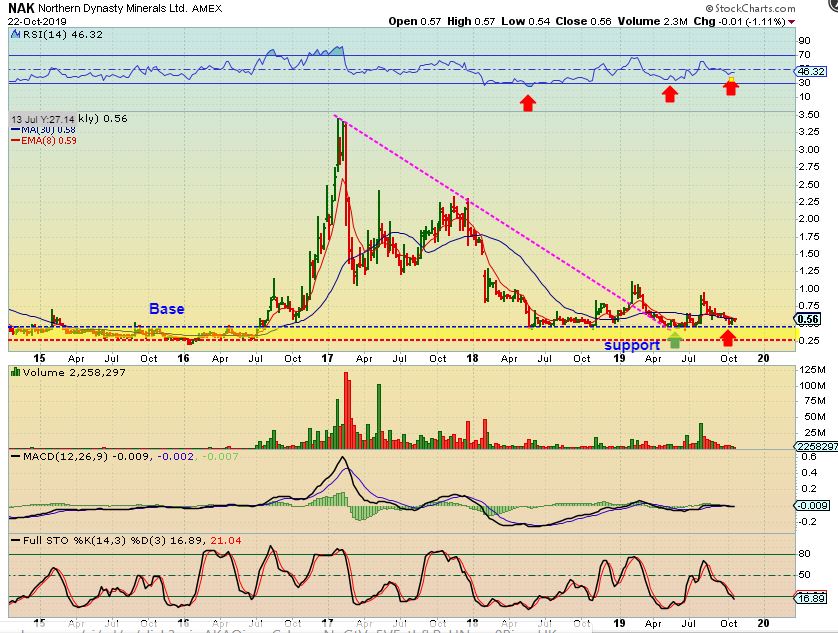
NAK – Even NAK is sitting pretty on support above a Base built in 2015&2016. We bought NAK in 2016 at $0.43 cents and rode it up to the $3 area ( I sold some on the way, re-bought on dips, etc., and it was an excellent run!).
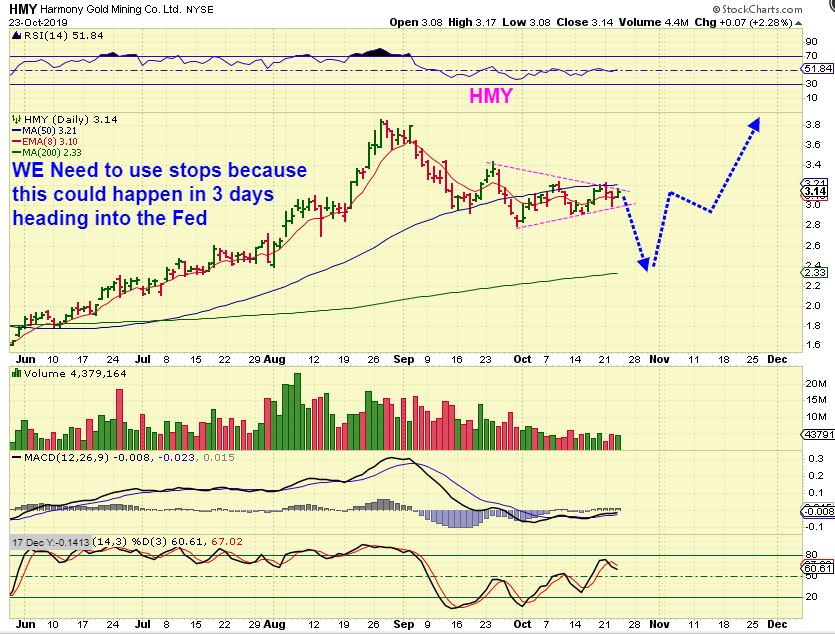
HMY – I’ve been watching HMY since I sold it. It dropped from $3.80 to $2.80, so it lost 25%, but that MACD has now turned up and this is starting to also look more & more Bullish. WHAT ABOUT THE BEARISH DROP THEORY?
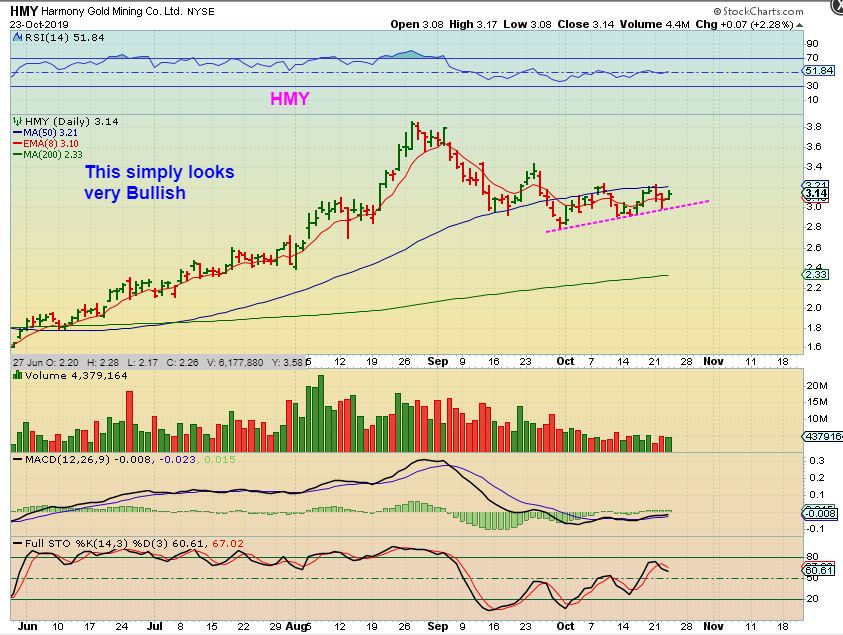
HMY – Yes, that drop CAN still happen going into the FOMC Mtg. , so I have been trying to be patient.
.
So with the Gold, Silver, & The Miners, it is a sideways chop that is really frustrating both the Bulls and Bears. Think about this: Every 5 days on this chart is a week of trading. How would it feel if you bought GDX or GDXJ 4 or even 5 weeks ago. It would be worse than waiting to buy, as you watch gains come & go over & over again in the chop to new lows.
We are getting closer to a dcl now. This should be day 29 on Thursday, but a break out Higher or lower would help to clear things up. You could actually think about a small starter position if you like one or 2 of the miners that are bullishly set up, IF YOU CAN MENTALLY TAKE A DROP over the next week, knowing that it should recover after that drop.
.
I still think that waiting all this time has been mentally healthier, and we will be going long soon enough. Just be ready to buy between now and the FOMC MTG, especially if you see a break of that downtrend line. Then we’ll raise our stops once the move gains traction. For now?
.
Enjoy your Thursday trading!
.
~ALEX
.
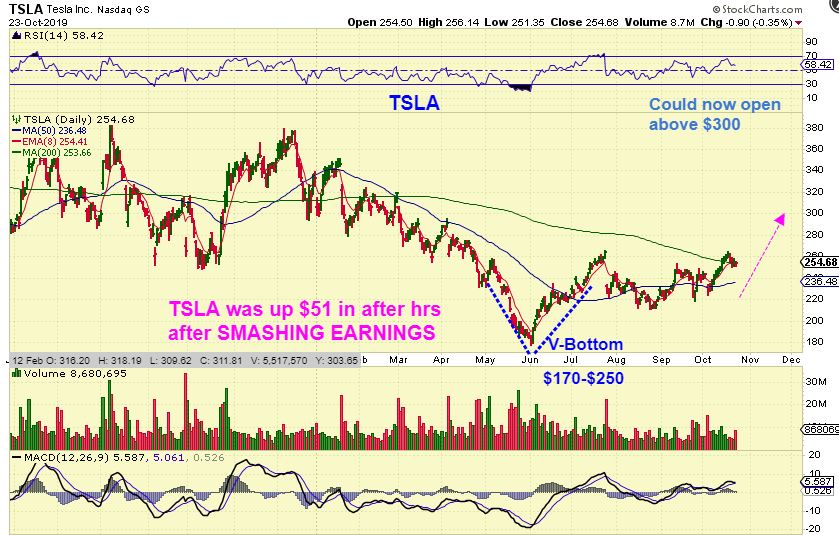
TSLA – TSLA blew away the earnings and rose $51 in after hrs. Anyone that shorted TSLA before earnings is about to get a very unpleasant awakening, since it is trading above $300 now. Tesla on Wednesday posted a cash balance increase to $5.3 billion (£4.11 billion) and reported a profit of $1.86 per share, while analysts expected a loss of 42 cents per share.
.
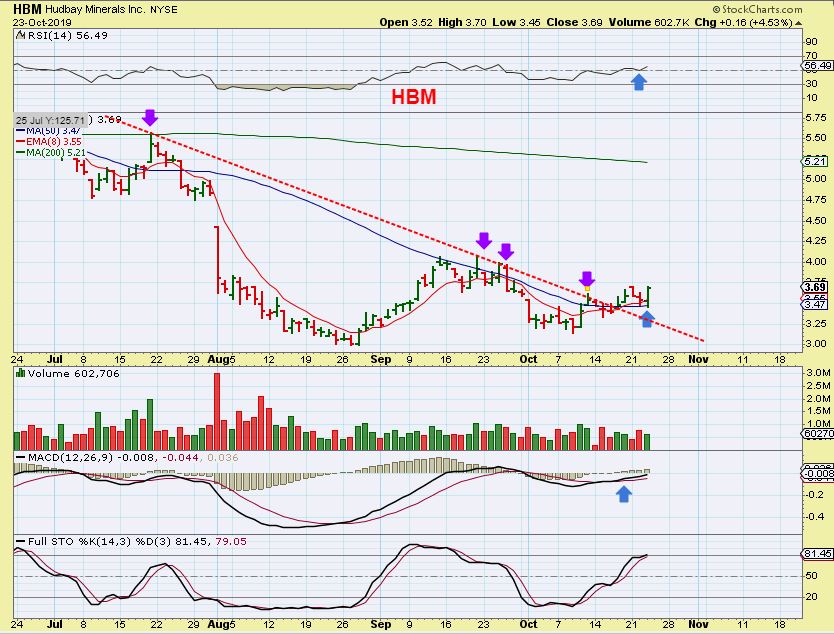
HBM – As mentioned, some of the Copper ( & Steel) Stocks are starting to improve and are a ‘buy’. I pointed out HBM recently, and it got some follow through.
.
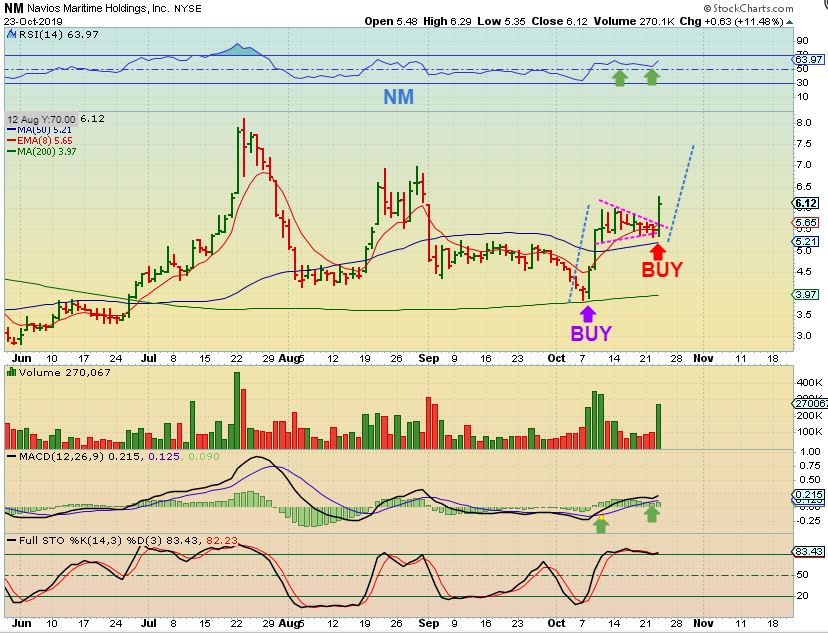
SHIPPERS – This sector started sailing higher again, but it is a tough one to ride. These move very quickly, so they really are only for the nimble trader.
,
NM – This was a buy at the 200 sma, and I have been pointing it out as a sideways bull flag type consolidation. It started to break out yesterday. That is a buy too. It can run to prior highs as an a -b = c- d kind of move.
,
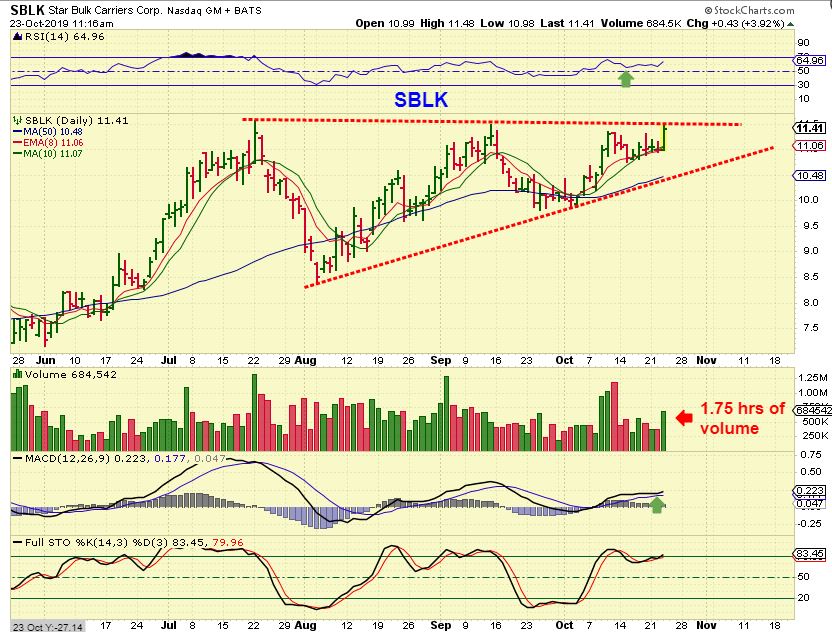
SBLK – I have also pointed out SBLK as a Bullish flat topped wedge, and it started to break out yesterday. I posted this in the early part of the day. It is still a buy and can run to at least $15.
.
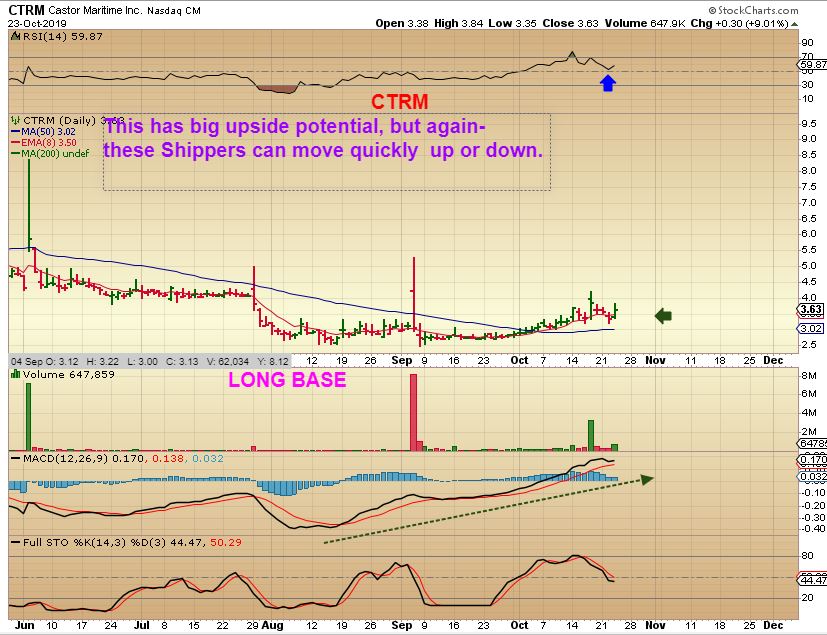
CTRM – This was a buy breaking through the 50sma in early October, and looks ready to continue higher. Guess what? I stopped myself out on the drop Tuesday, thinking that it would back test the 50sma & take my gains away. After the whole sector started breaking out yesterday, I jumped back in higher than Tuesdays sell price, because really, this has been a nice steady climb, and …
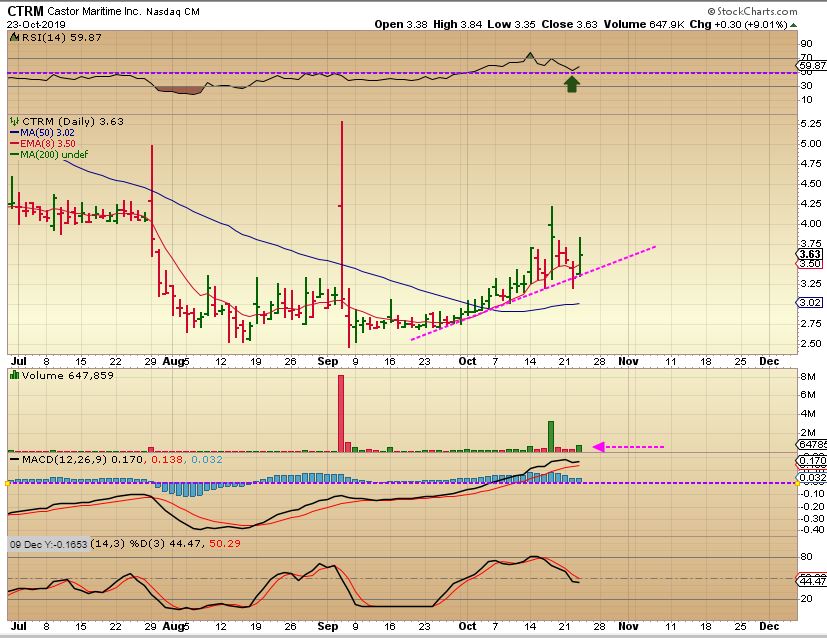
CTRM – Big picture potential shows this as a large base with good upside potential, so I am back in it, at least as long as these Shippers continue to move higher.
.
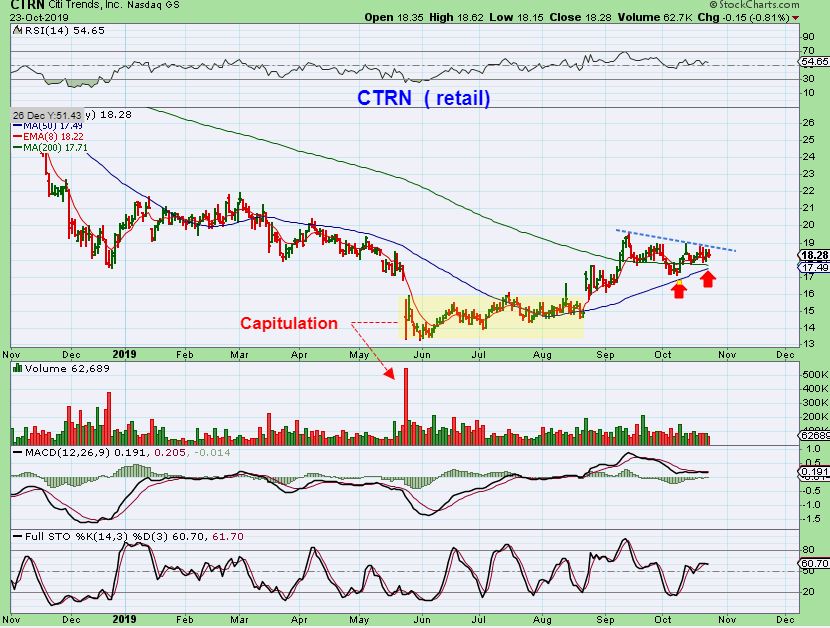
CTRN – While looking up CTRM, I accidentally put CTRN in and saw a Bullish set up, so I looked into it.
1. We have a capitulation low in May, and
2. Then earnings in August gapped it open ( island bottom base). They are retail and had a favorable earnings release that gapped up in August.
3. This is now back above the 50sma & 200sma, with the 50 about to cross the 200. It is a bullish set up for a watch list or Buy with a stop. You can also wait & just Buy the break out.
.
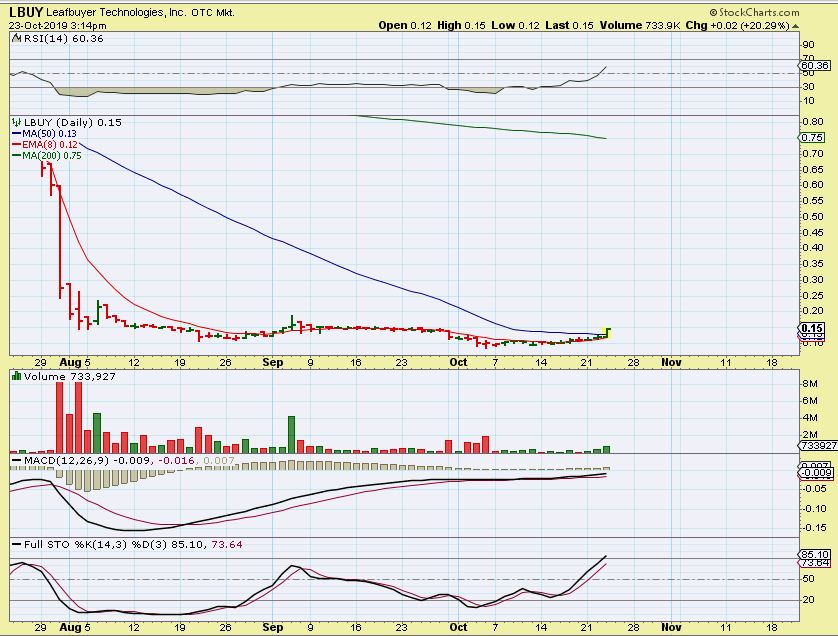
LBUY – LBUY is an MJ Stock that announced a big increase in their cash sales, and after forming a long base, it Popped 15% so I posted this chart, and by then it was up 20%. It closed up 32%. I’m showing this chart for 2 reasons.
1. These LONG bases can run in a big way, so if it back tests you may want to buy the dip. Note: It is OTC, so maybe you do not want to, but…
2. I’m just showing that this sector is beaten down and some bases are forming, so we may eventually see a strong rally in this MJ Sector. I have made money faster than by buying Miners in this sector, when it gets going.
.
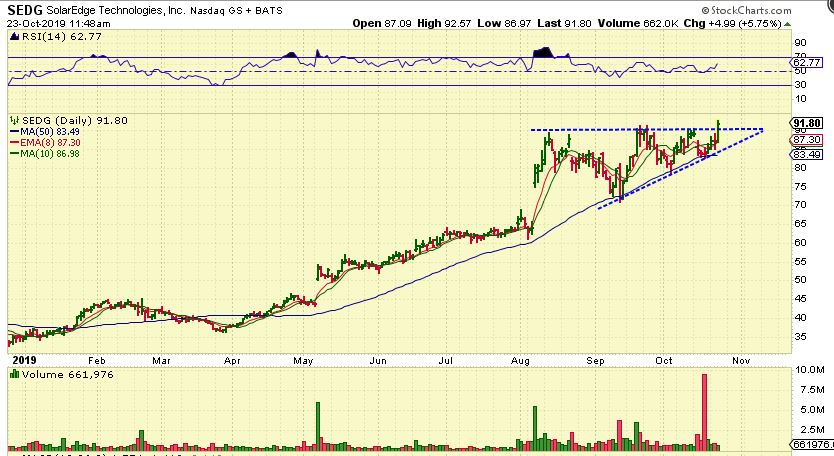
SEDG – This is a solar stock that has been bullish for all of 2019, but recently formed a Flat Topped Bull Wedge. It is breaking out and can be bought with a stop under the Apex.
.
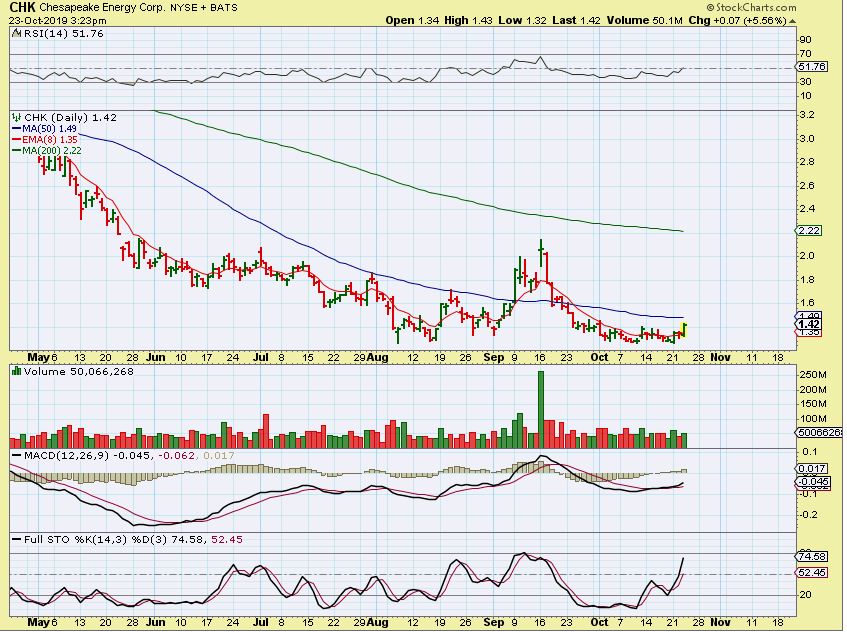
CHK – I was asked about CHK and this actually could be considered a Buy a it pushes from this base. It does have that 50 sma as resistance, but it pushed right through in September, so it could do that again.