
Thursday – Little Changes / Challenges
SPX – There is a good chance that day 42 was the DCL, but we need a close above that 10 sma for further confirmation. I grabbed this chart before the close, and by the time the close came, the markets sold off a bit, but so far this looks like day 4.
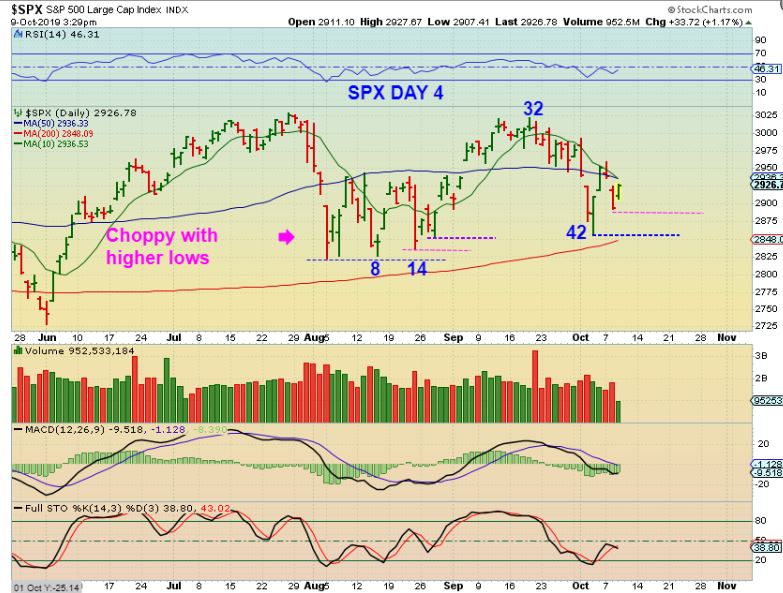
SPX Same chart – I just want to point out that after the August dcl, we went sideways for over a month. Look at day 8 & day 14. We saw choppiness and slightly higher lows out of the last dcl, so this could play out in a similar manner, but hopefully it just moves higher & confirms the dcl soon.
.
.
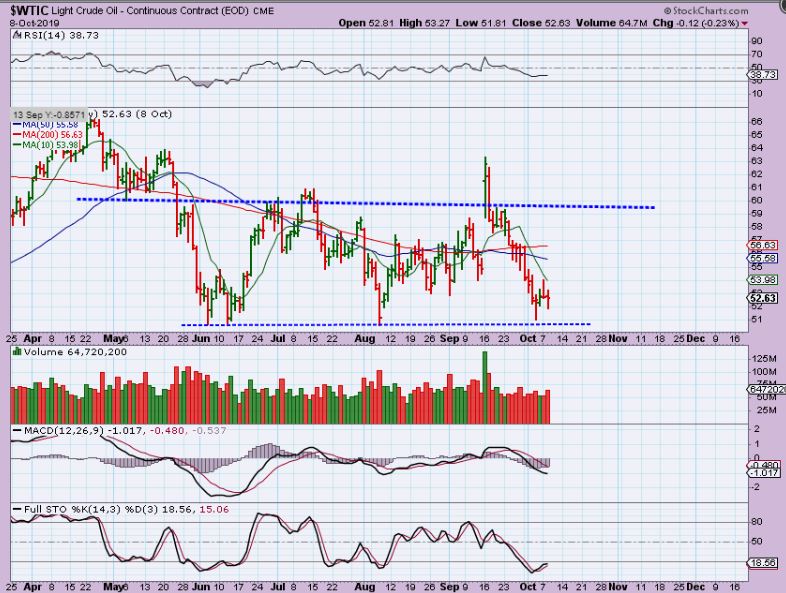
WTIC – Oil made no progress.
NOTE: I had a UGAZ position with a stop at the recent lows, but I raised my stop & got stopped out while I was away yesterday. NATGAS did not break the lows, so it may have a dcl in place.
.
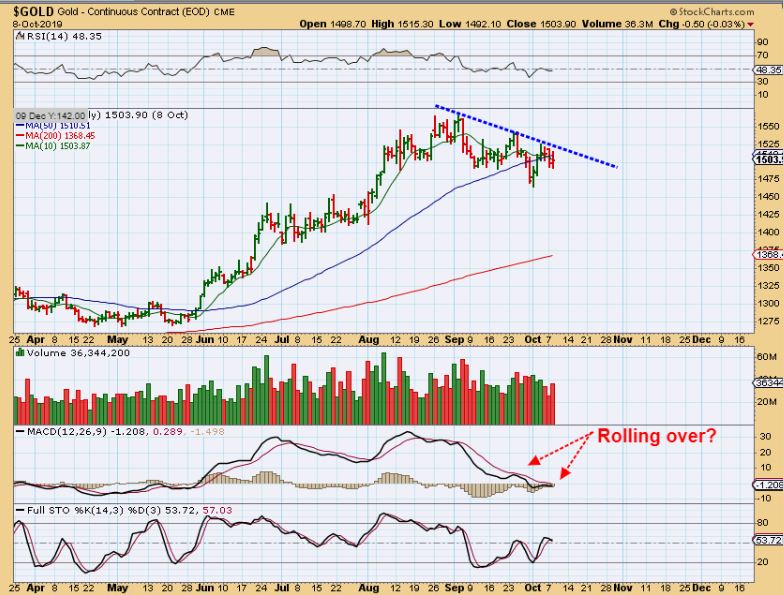
GOLD #1 – Gold chopped around a bit during the day, but it did not break out higher (or down) as the Fed Minutes were released.
.
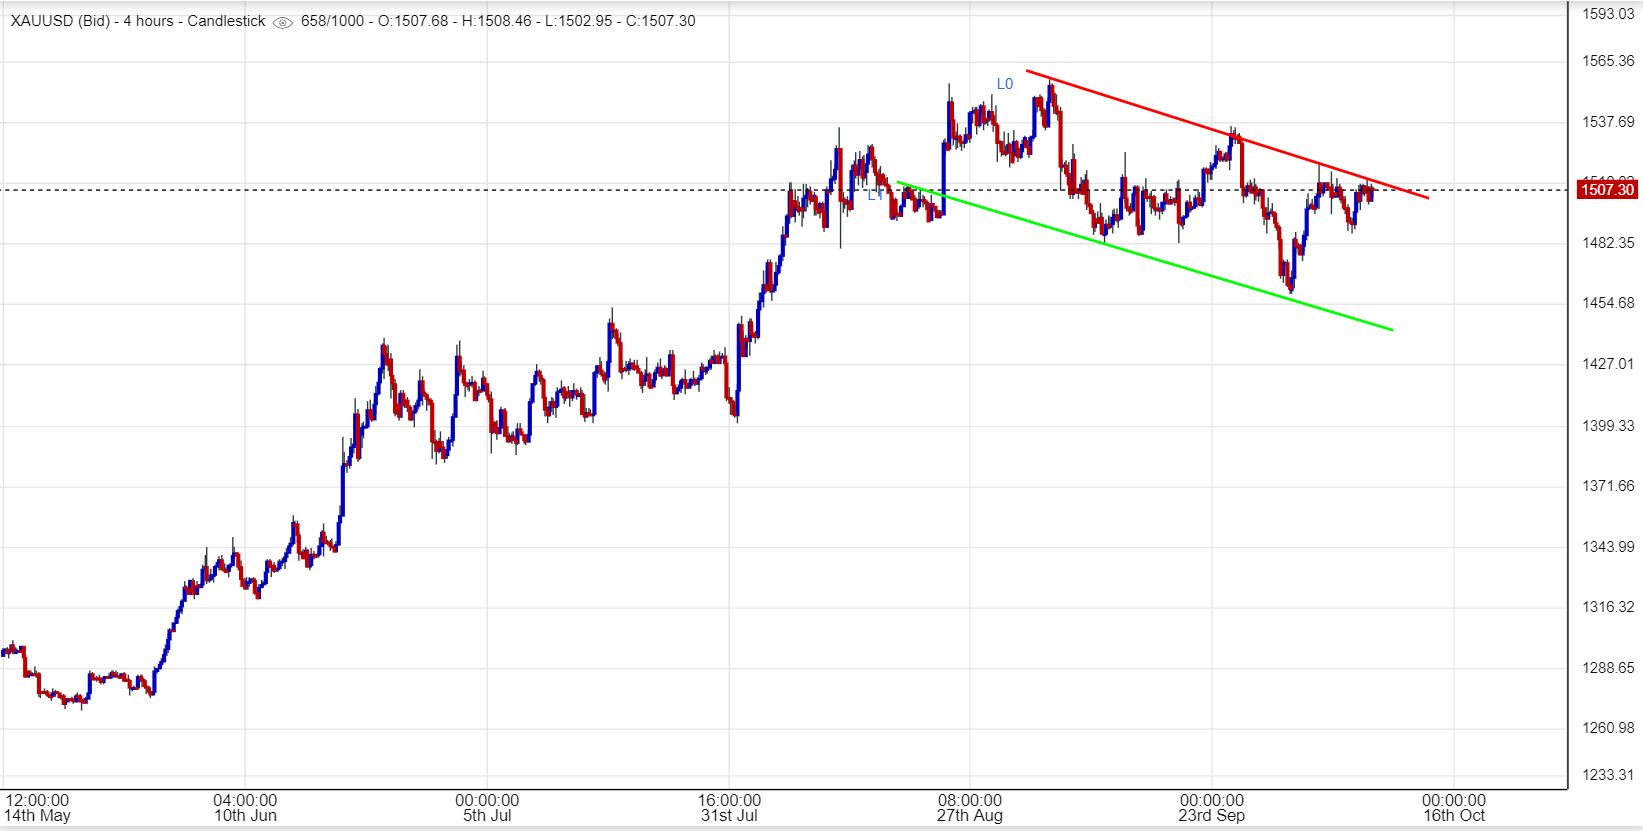
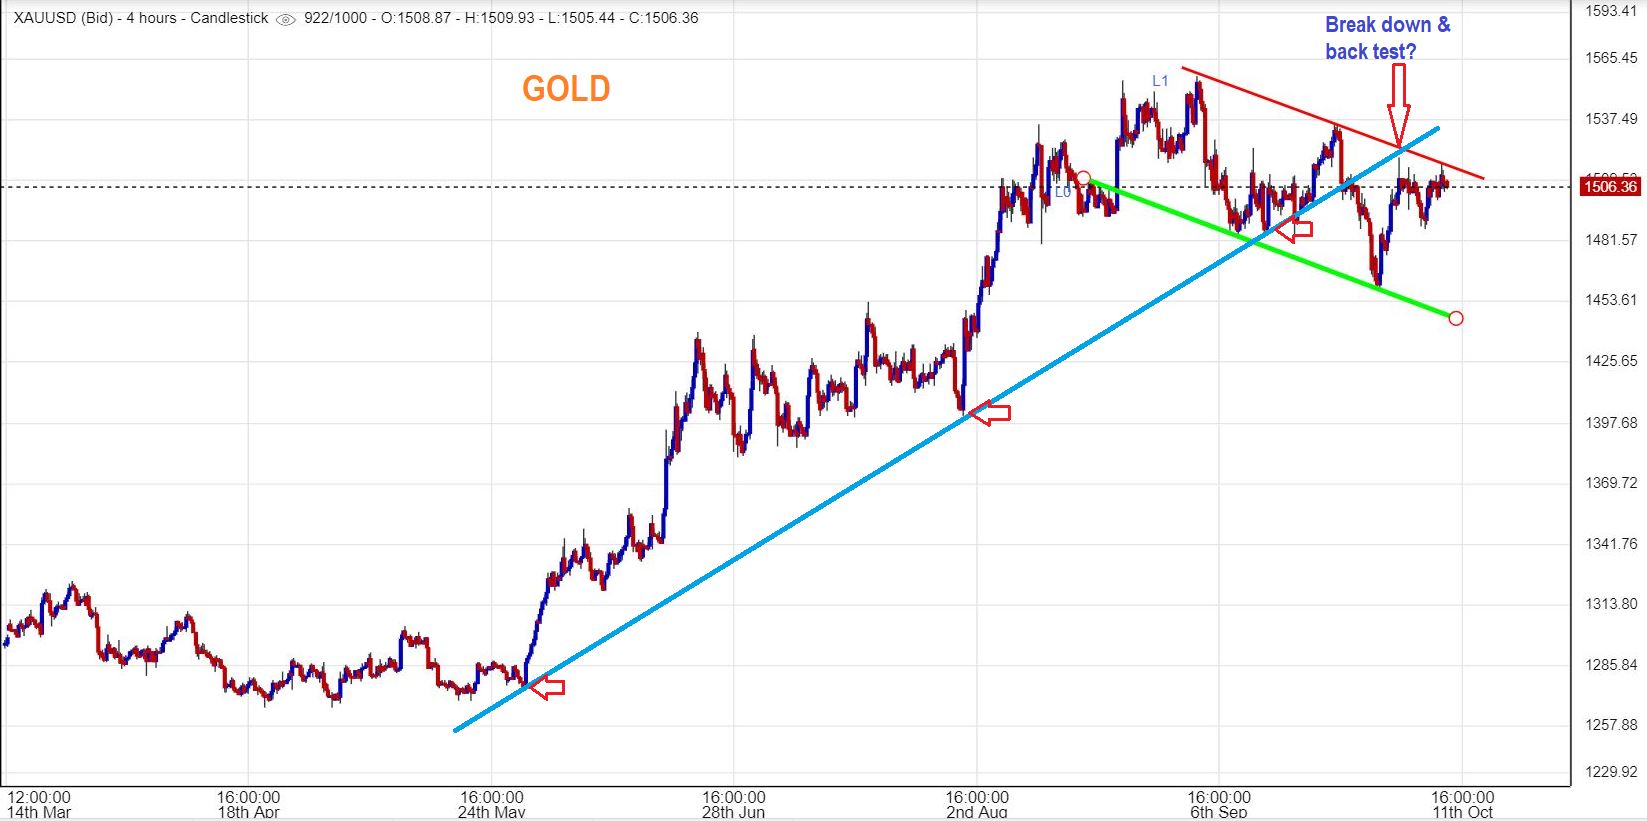
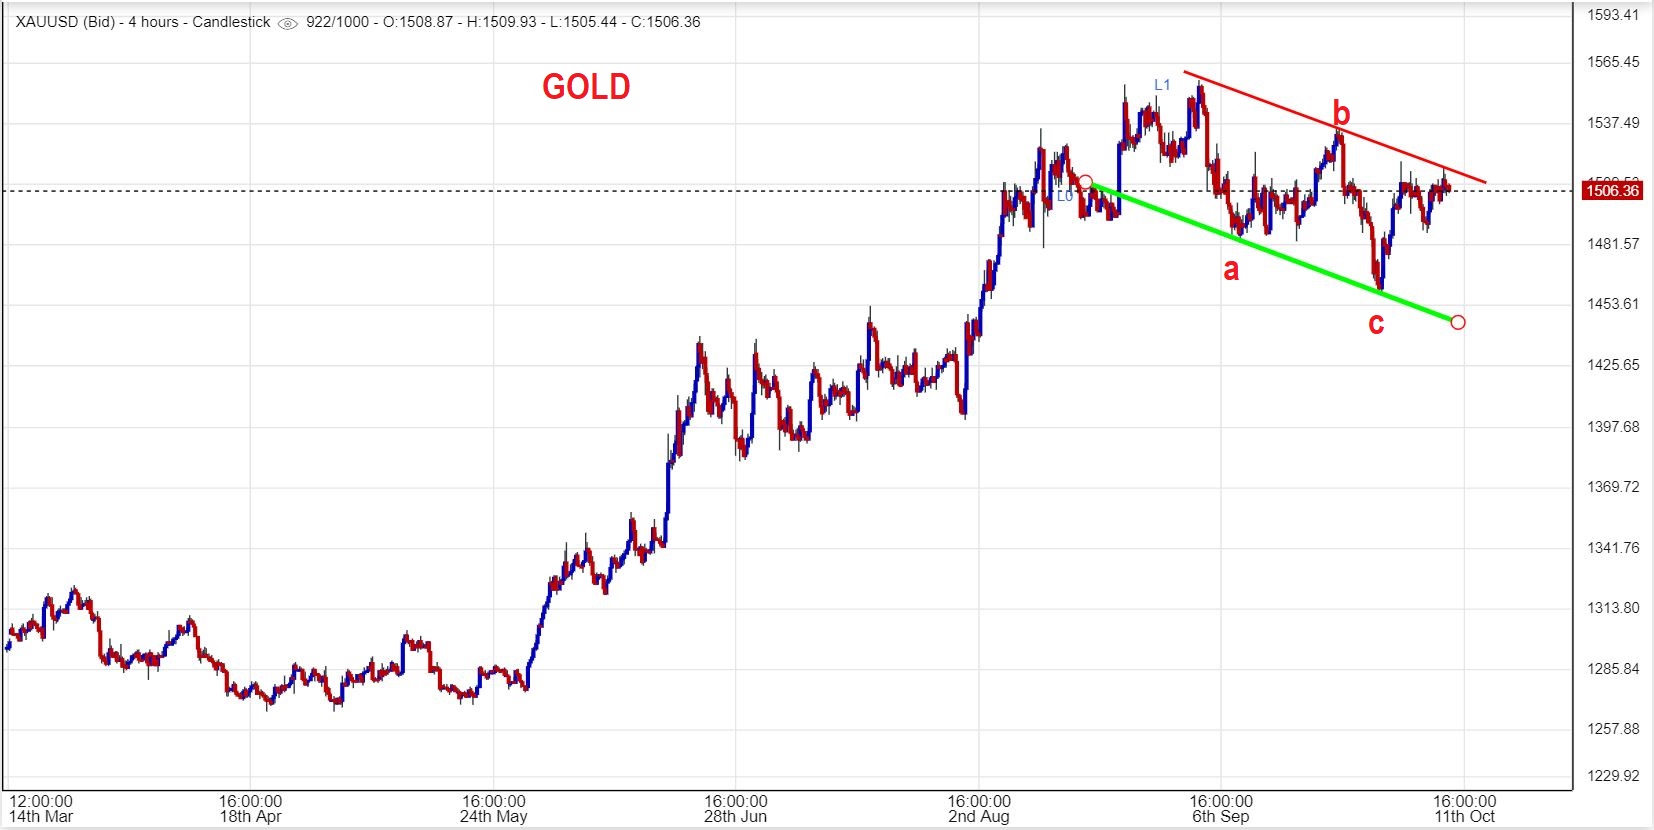
GOLD #2 – So this 4 hr chart shows our trend line overhead. If Gold breaks out & runs, it will be considered bullish, but if it starts dropping, it is likely heading down into the dcl / ICL.
.
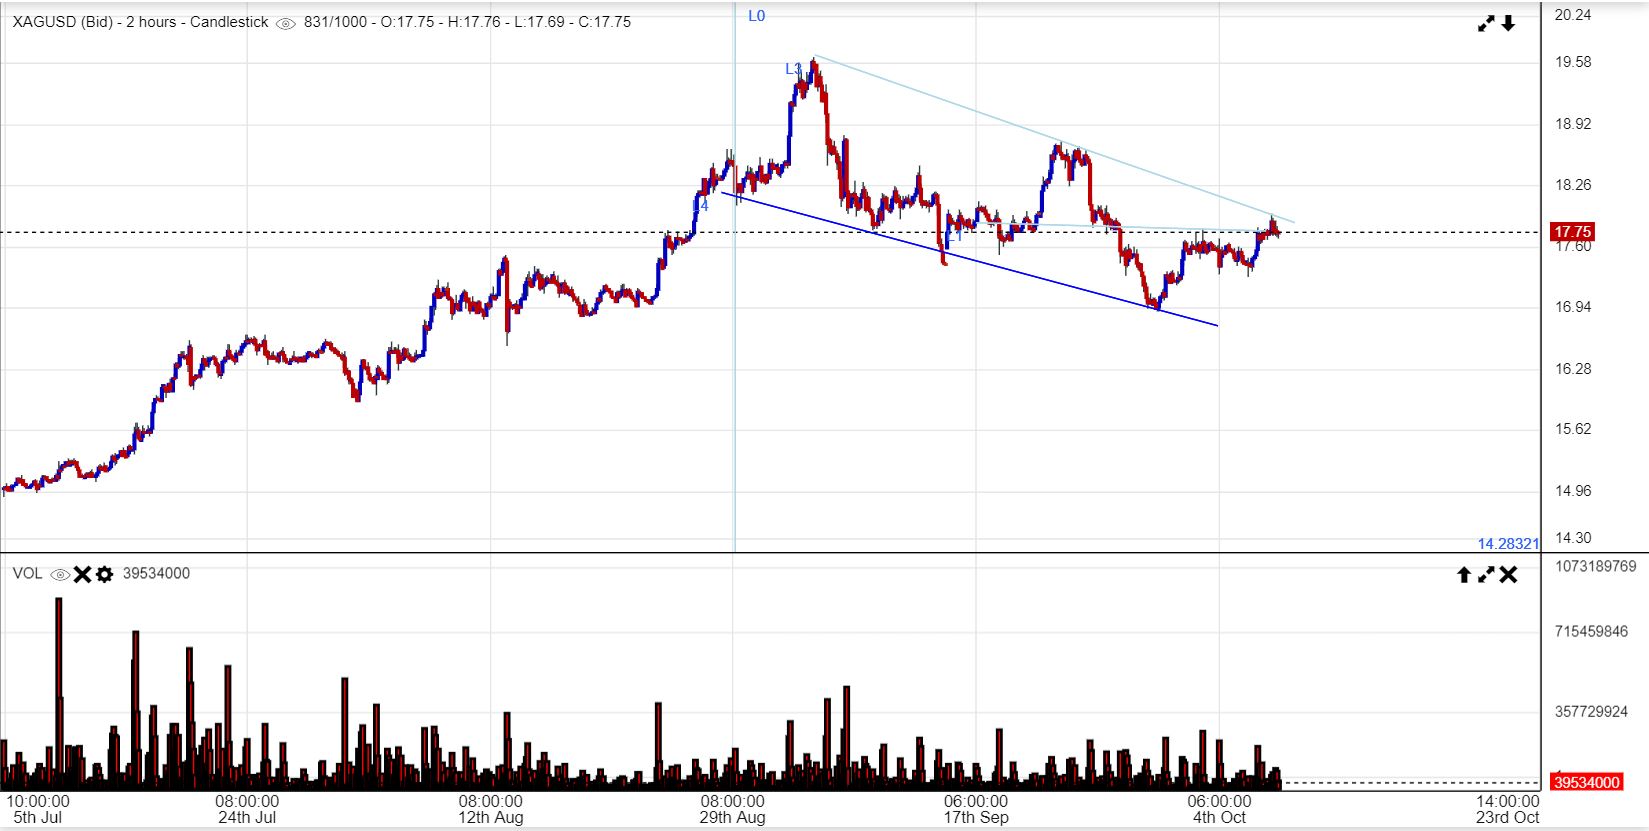
SILVER PRE-FED : Silver also tagged the upper trend line, but made no directional change .
.
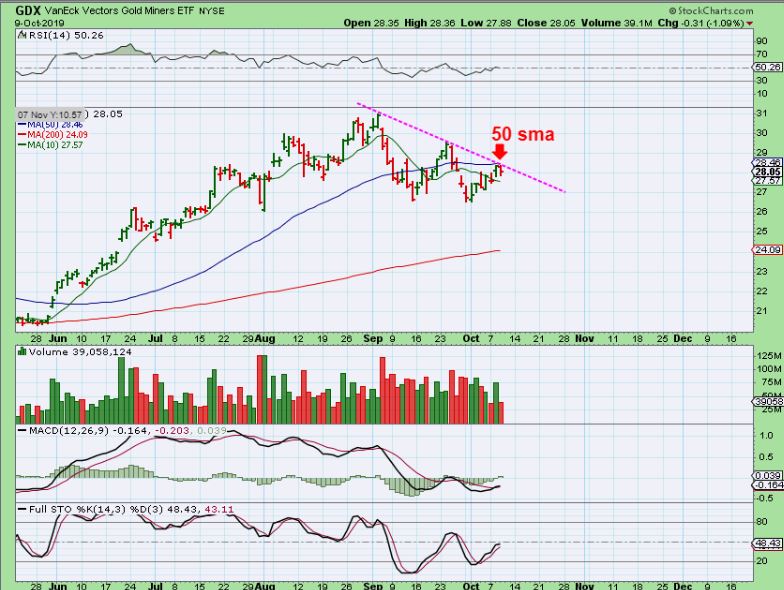
GDX – GDX was held back by the 50 sma & that down trend line, so we have little change here too. A break down from here would start a drop into a Daily Cycle Low, and a break out & close above that 50sma would be viewed Bullishly.
.
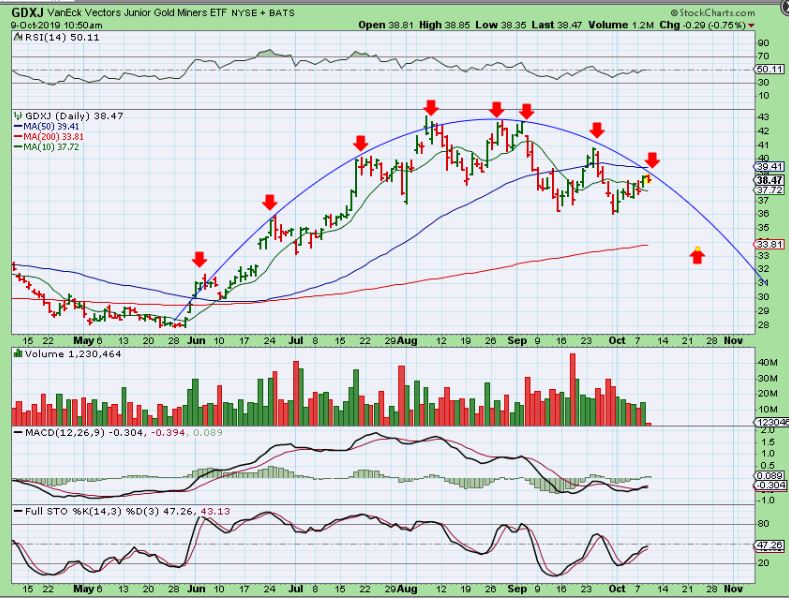
GDXJ – I posted these in the live area, showing a bearish look if these do not break higher.

,
GDXJ – This is a Dome pattern that often leads to lower highs and lower lows on the right side.
.
We really haven’t seen a lot changes since yesterdays report, so we are still waiting for conformation in some DCLs for the General Markets. When it comes to the Precious Metals, we need them to pick a direction, now that they’ve reached upside resistance targets. It would be normal to see a drop into a dcl from here, and that would offer a nice buying opportunity as the dcl develops, but it would be a great opportunity if it turns out to be an ICL. For now, we continue to watch for a little more change.
.
Enjoy your Thursday trading.
.
~ALEX
.
2 charts of GOLD – The following 2 charts of gold show 2 very different views of Gold using technical analysis. A Bullish & a Bearish view, which is why we need the next move to identify the next direction…
.
GOLD #1 – This would be a more short term bearish view of Gold currently. This shows that Gold broke below the uptrend line and then did a back test of that blue line. After a rise to back test, it is usually followed by a sell off ( leads us to our ICL). THIS IS STILL A POSSIBILITY. It could drop 50% of the entire move.
GOLD #2 – This would be a more Bullish View where Gold has completed a-b-c drop , and from here Gold can break above the downtrend line & continue the prior rally. THIS IS ALSO STILL POSSIBLE-
So we need GOLD to show us what it wants to do. One way to look at the current situation is this: An ICL is simply a deeper consolidation of the prior run and it is designed to frustrate the bulls. A strong run causes Bulls to get too excited, everyone is buying every dip, the News about Gold becomes all Bullish and that needs to change. An ICL is the time that is needed to dampen sentiment and cause hesitation & doubt. IN MOST CASES it is Deep, ugly, and scares even the biggest bulls, because they rack up losses from buying the dips. The above 2 charts are 2 simplified examples of how this can play out. Now we let Gold tell us if enough is enough, or will it drop & wash out some more bullish sentiment & really cause people to doubt that the Bull has resumed. Stay tuned.
.
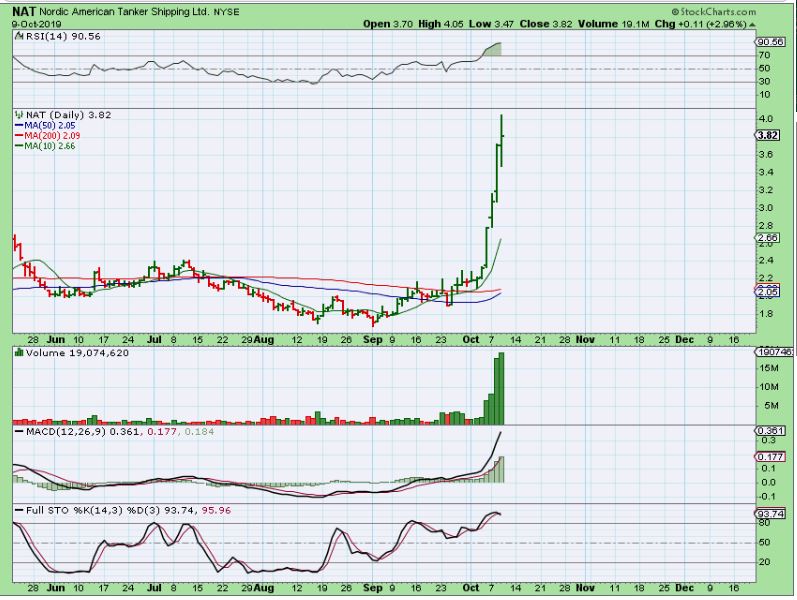
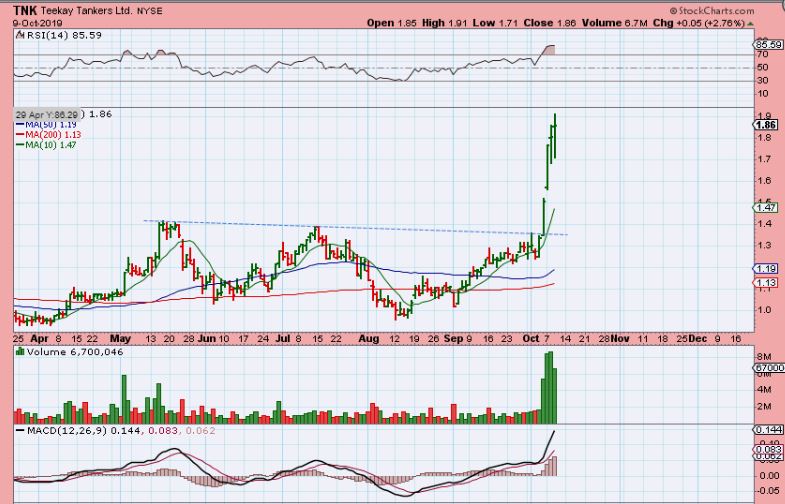
I have been talking about ‘Shippers‘ in the comments section. Some of them have been gradually trending higher ( SBLK, SALT, etc), and others are rocketing higher ( NAT, TNK, ASC, etc), and they have moved whether or not the General Markets go higher, so I was looking for a couple that may be just ready to move higher now. I wanted to point that sector out again here.
NAT – This is what NAT & TNK look like. You can see that when these run, they often make extreme moves, especially out of a base.
.
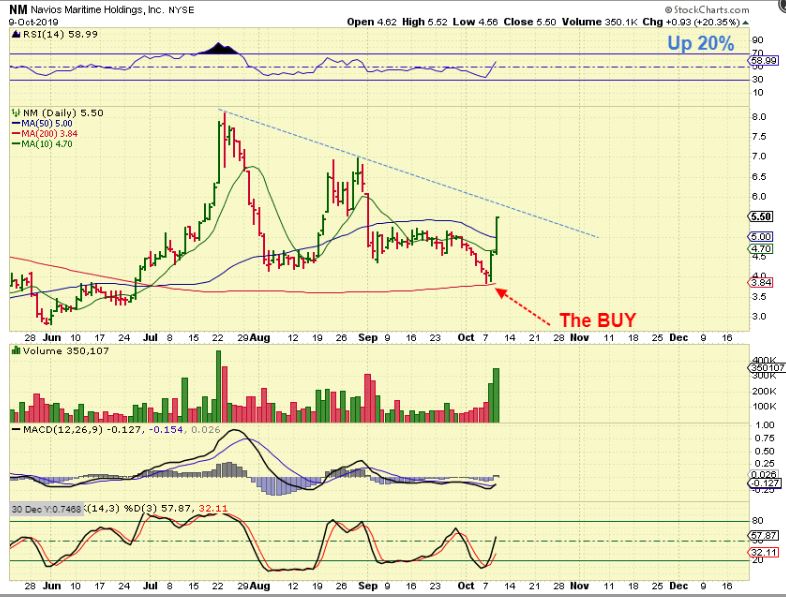
NM DAILY – So recently I pointed out NM as a BUY when it reversed on the 200 sma. I own this one after buying near that 200sma reversal.
NM DAILY – it was up another 20% Wednesday, so these are continuing to find follow through. The 50 sma did not resist price at all, but it is approaching a down trend line.
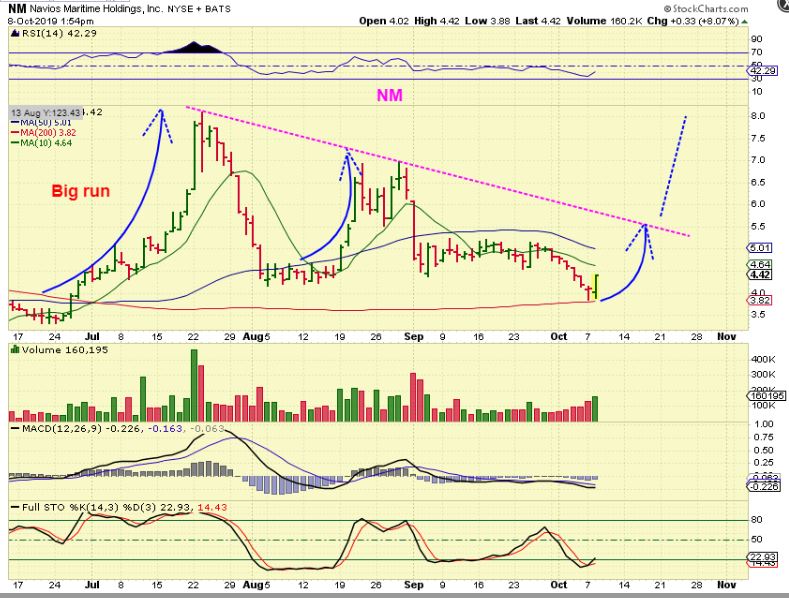
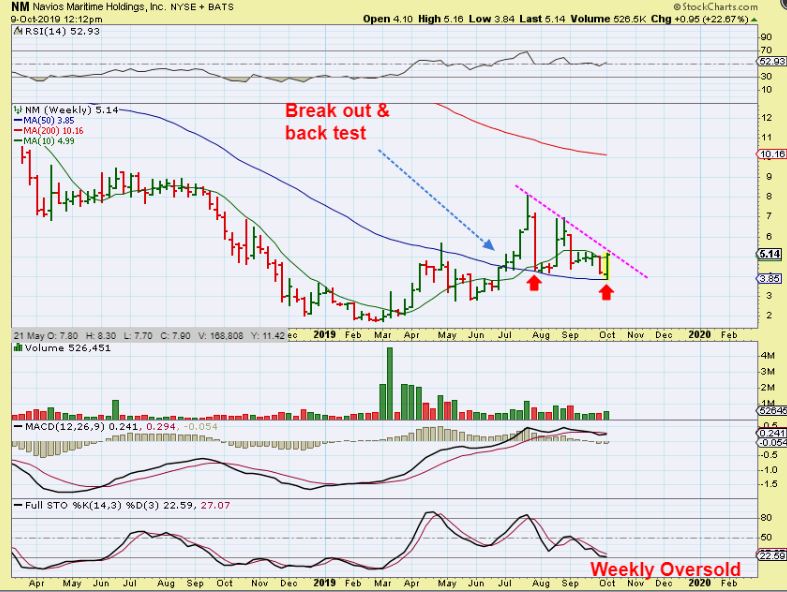
NM WEEKLY – On a larger weekly chart, NM rallied strongly in June & July, and has been back testing & forming a large wedge. It is up 23% for the week, yet remains oversold weekly. It could break out & run further, so if you bought it, you may want to hold on a bit longer.
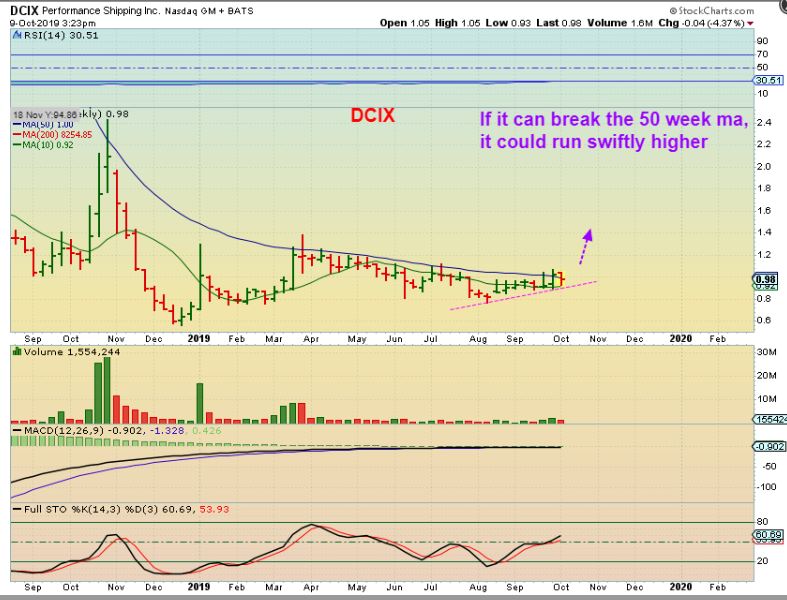
DCIX – So I was looking at DCIX and noticed a LONG base forming under the 50 week ma. This could continue sideways for weeks since it already has, but with so many Shippers taking off higher, I’m thinking that this could break out too. I bought it at $1.00, and a break & close above the 50 week MA should be considered Bullish.
.
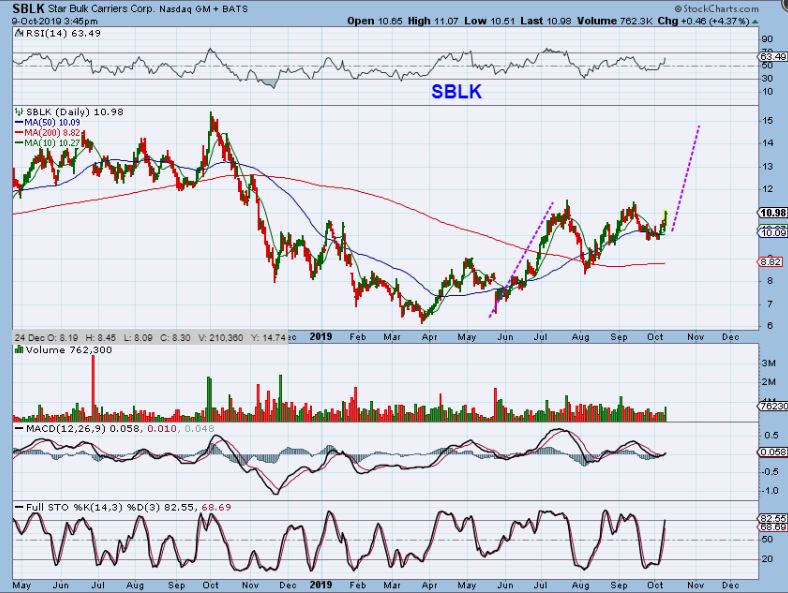
SBLK – I like the patterns for SALT & SBLK. This is SBLK and you can see that it is also climbing since May. I’m seeing an apex forming and…
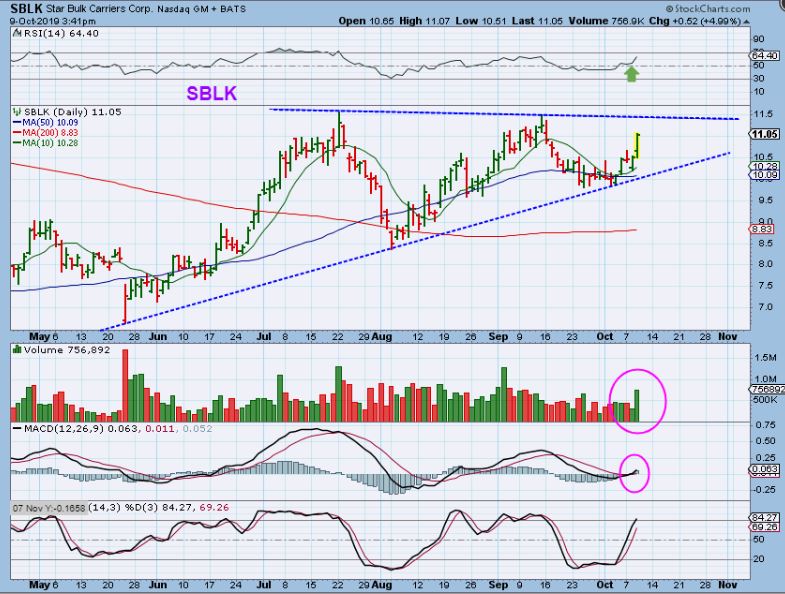
SBLK – I think that this could break out & run too. This is a large base and should finish forming a cup, and SALT is a similar big picture set up.
TOPS – Finally this is a risky one, but the selling seems to have stopped and this is forming a TIGHT BASE for the past 3+ weeks. For the past 4 days it closed above the 10sma and a run to the 50 sma would be a big move. Again, these Shippers are moving quickly, as you can also see on the next chart…

.
TNK – These shippers are moving quickly out of bases. These are NOT for everyone, the choppiness caan also be big as they can rise & fall quickly, but if you catch them low, there is a chance that you’ll grab some quick gains.
.
.
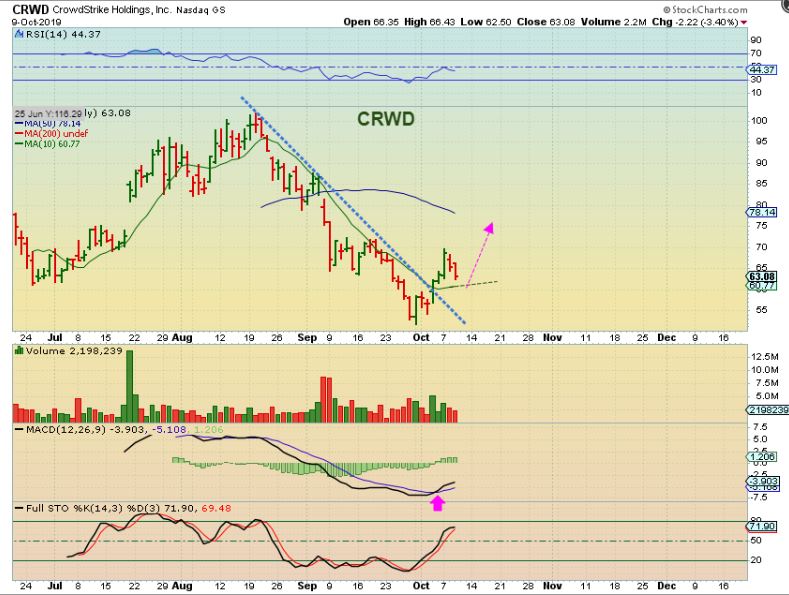
Recently I had mentioned CRWD, FIT, ROKU, AMD, etc as good set ups, an they did run higher.
Now I would Watch CRWD for a reversal, since it may be setting up to put in a higher low. The green line is the 10 sma.
.
FIT – FIT ran strongly off of the lows in September and has been pulling back now. The 50 sma may be an area for support & a place to look for a reversal.

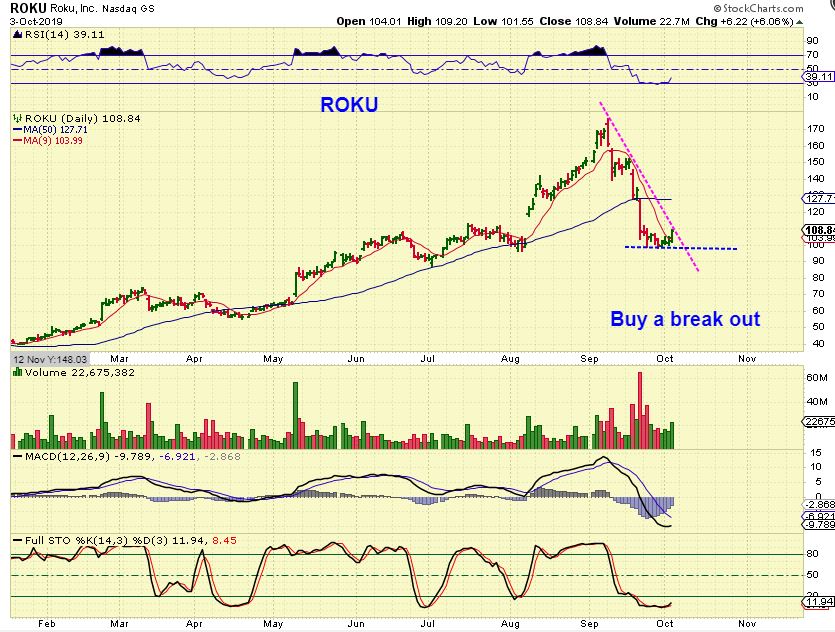
ROKU OCT 3 – I Posted this chart of ROKU- Buy a break out ( or buy here, because it just closed above the 10sma…
ROKU – It went sideways for a few days, but popped yesterday. Volume accompanied the move and the 50 sma will likely be the next resistance point, so you could sell it there as a trade ( $127) & watch it- or – see if it can just break back above.
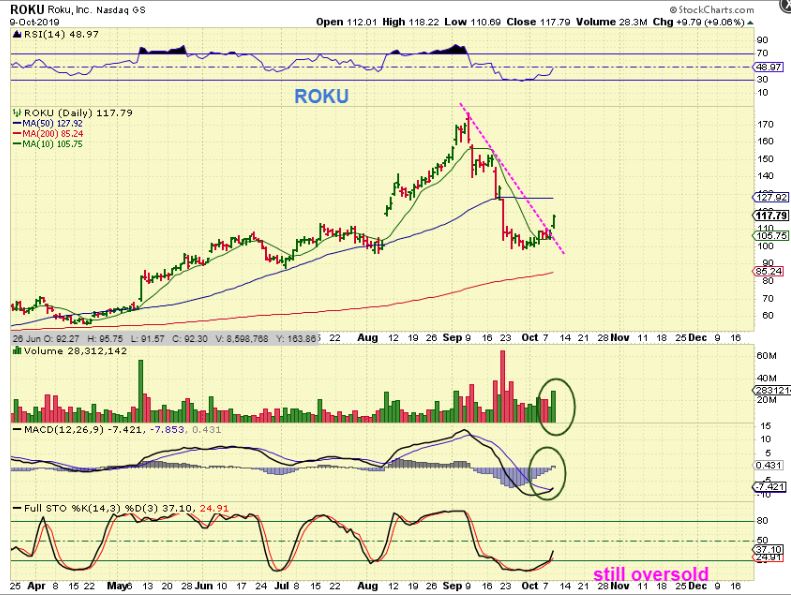
This one could be a future trade for ‘traders’.
ADXS – This is a stock that I bought recently as a trade ( Biotech) when it broke the 50 sma. It is an example of the long tight base that suddenly starts experiencing large volume pops. If that 50 sma gets back tested, I will post a reversal there as a buy, because these can have big potential in the upside move. It was 44 cents here, but closed at 41 cents yesterday, so it might be pulling back now. The 50 sma is currently at 36 cents , the 10 sma is at 32. You can see the upside potential if it bounces off of the 50 sma & runs higher.


