
October 12th Weekend Update
From Thursday The SPX DAILY:
SPX – On Thursday The SPX and NASDAQ rallied and then sold off into the close. Buyers are having a hard time taking full control, but they did close above the 10 & 50 sma. This is day 5 …
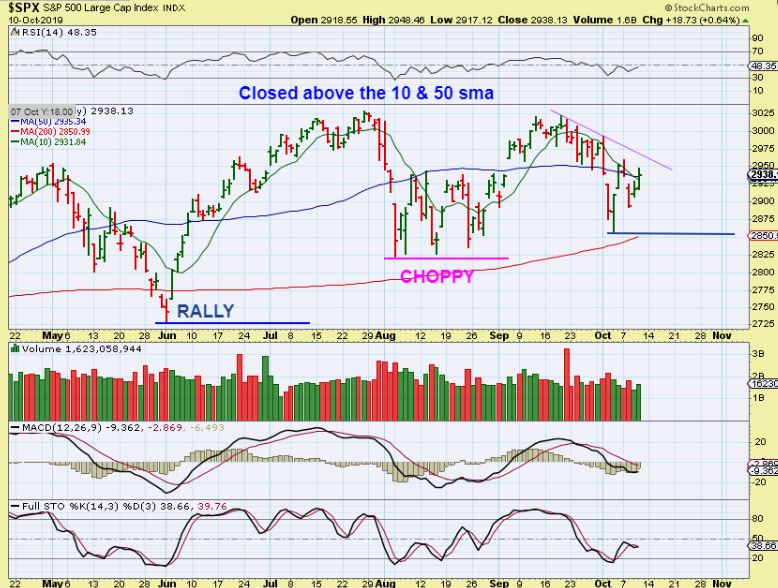
.
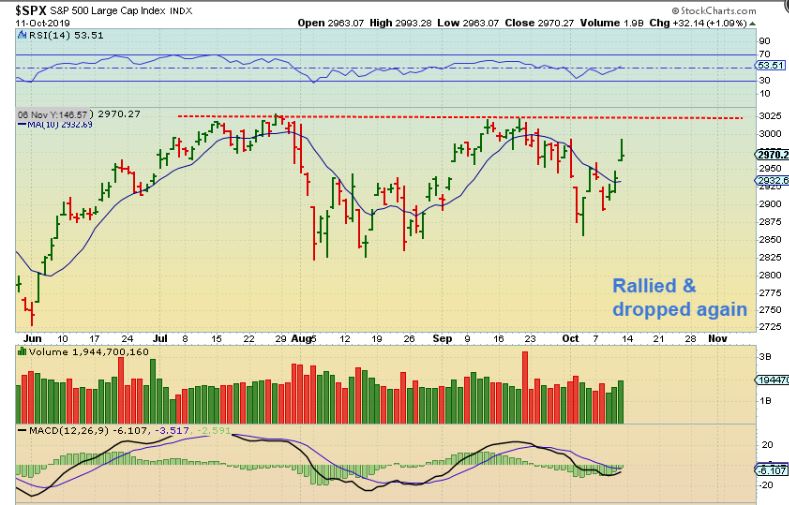
SPX FRIDAY – We saw an additional 32 points on the daily, but it really rallied strongly & then gave up part of the gains again. it feels like each day of buying is being met with selling too. Is this evidence of Distribution at the highs, where smart money sells into the rally to unload? It could be – Time will tell.
.
SPX WEEKLY – So if this is a large consolidation in a bull run, you get a break out & run that looks like this, however with each rally being sold off into the close …
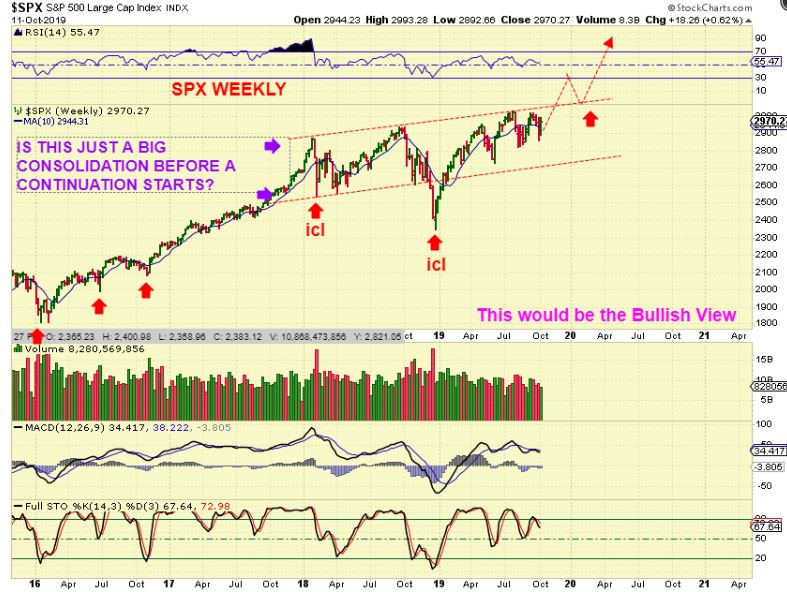
,
SPX WEEKLY – We could get a false break out & roll over into the next ICL too, continuing this long sideways movement.
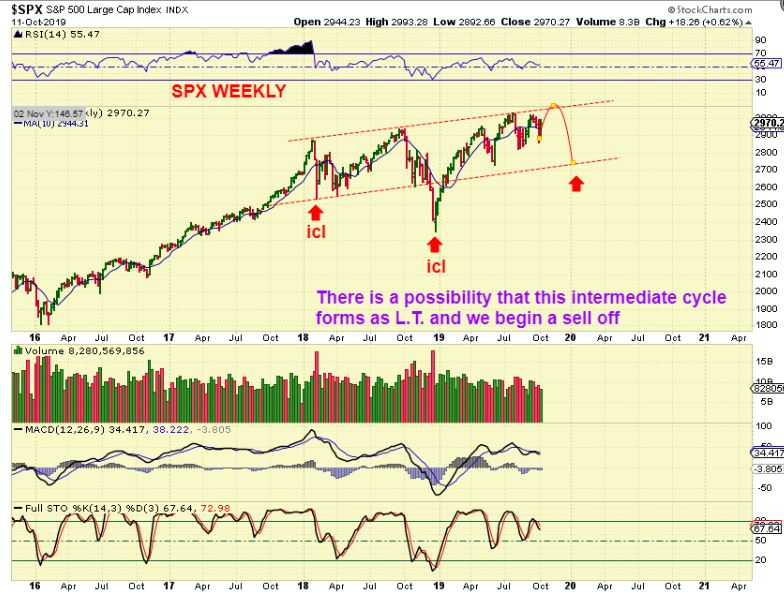
.
NASDAQ WEEKLY – With the weekly reversal the Nasdaq looks like it wants to break out. This also could do a fake break out or it could do a break out & run.

.
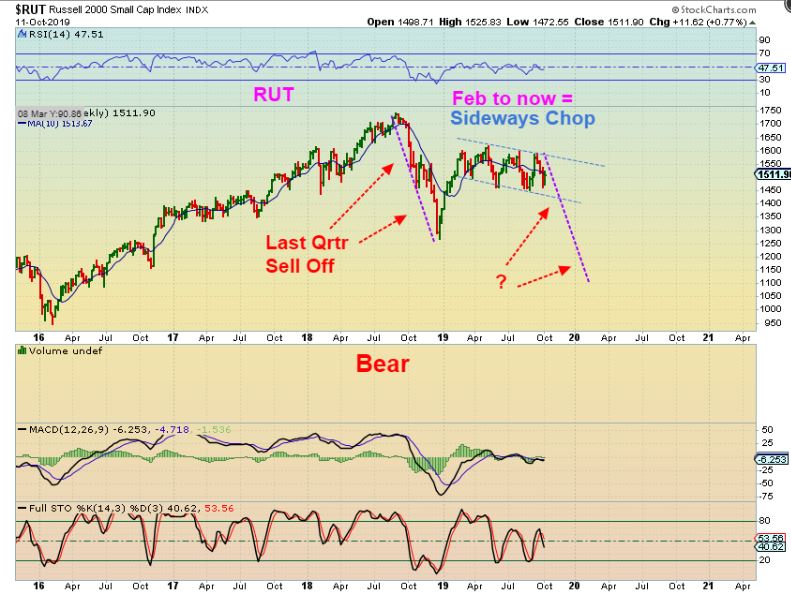
RUT WEEKLY– The Russell 2000 has been a long sideways chop all year, so it too may …

.
RUT WEEKLY– It may break higher & run, or…
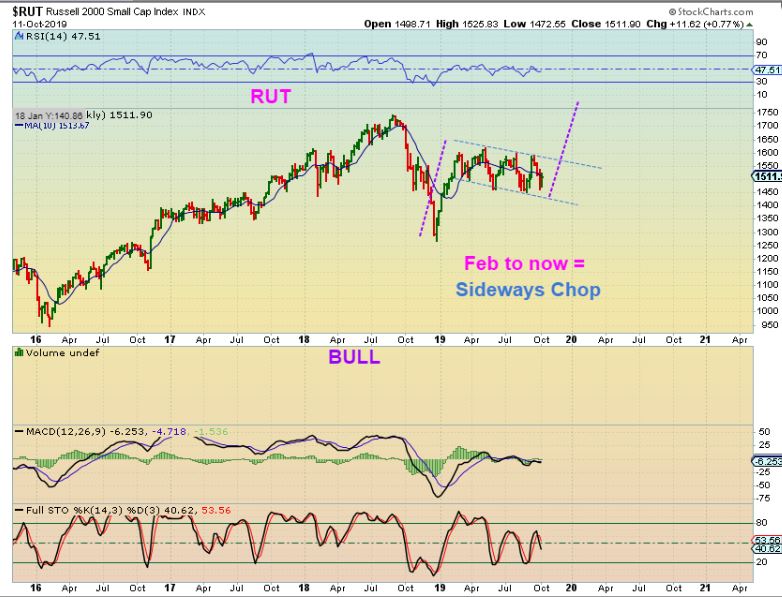
.
RUT WEEKLY– This could be a right shoulder formation and break down. Last year we sold off from October to December. Will we get another year end sell off? It is hard to say, and I’ll explain why that is…
.
Note About The General Markets: On one hand, this has been one of the longest Bull Runs in history. That is why we could be rolling over soon, as fundamentals also seem to be weakening. On the other hand, this observation comes to my mind too:
When the Fed was raising rates last year, the markets took a dive from Oct – Dec. Now they are cutting rates again, and the Markets rallied out of December lows. So can the markets remain propped up for a bit longer, with the help of the Fed? Could Fridays talks with China being viewed as a successful trade resolution Help? That is possible, and that is why the LONG TERM the direction could be the start of a strong run instead of rolling over. It will reveal itself after it either breaks out or breaks down, and that could happen on this current daily cycle. So SHORT TERM, we are on day 6 & short term direction is long. Longer Term direction remains to be revealed with a break out or Break down.
TSEM, AMD, MU, SOXL – Semis seem to be Bullish again. TSEM is one that I have been really bullish on because it didn’t sell off when the markets did recently. This was my Buy on Oct 3rd…

.
TSEM– It is still a buy set up as it now began to break out Friday. AMD & MU popped too, so we’ll see how much follow through these can put forth.

.
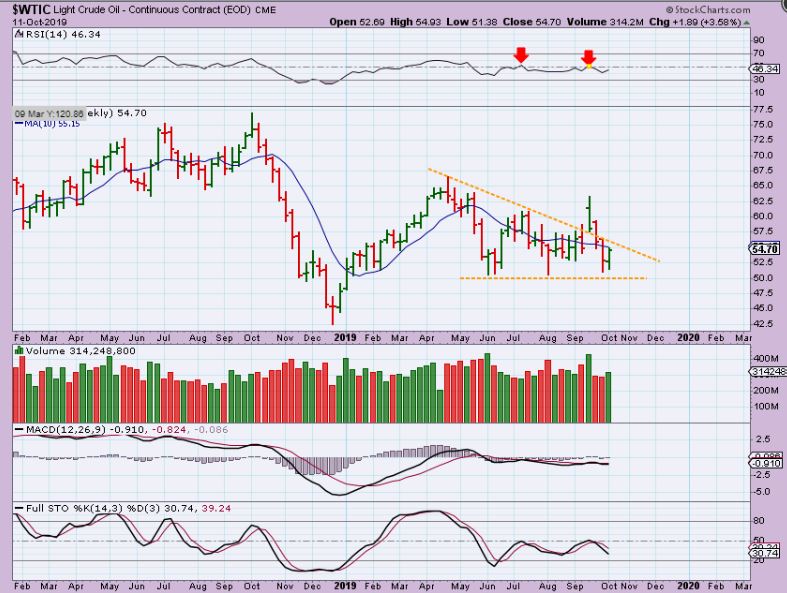
WTIC – Oil has been very choppy, but I have re-drawn that Triangle that I used in August. That break out that I bought now looks like a fake out– a throw over– a false break out. We have a reversal on a weekly basis and Oil could now be ready to try to break back out again. I was stopped out of Oil/Energy on that false break out, but trades may be developing here again.
.
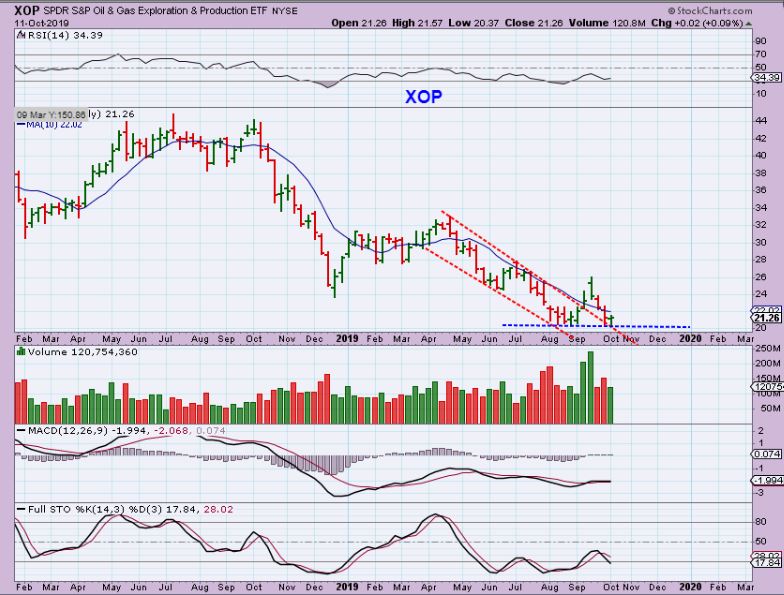
XOP – I was looking at XOP WEEKLY and was thinking that it looks like a double bottom buy reversal. These can be bought with a tight stop and I do see divergence on the weekly RSI & MACD, so another try at GUSH seems reasonable. Then I realized something else…

.
XOP – That ‘double bottom’ may also just be a ‘Back Test’ of the recent break out from a down channel. THAT reversal on the back test would be a buy too. If I saw this Friday, I may have taken a position.
.
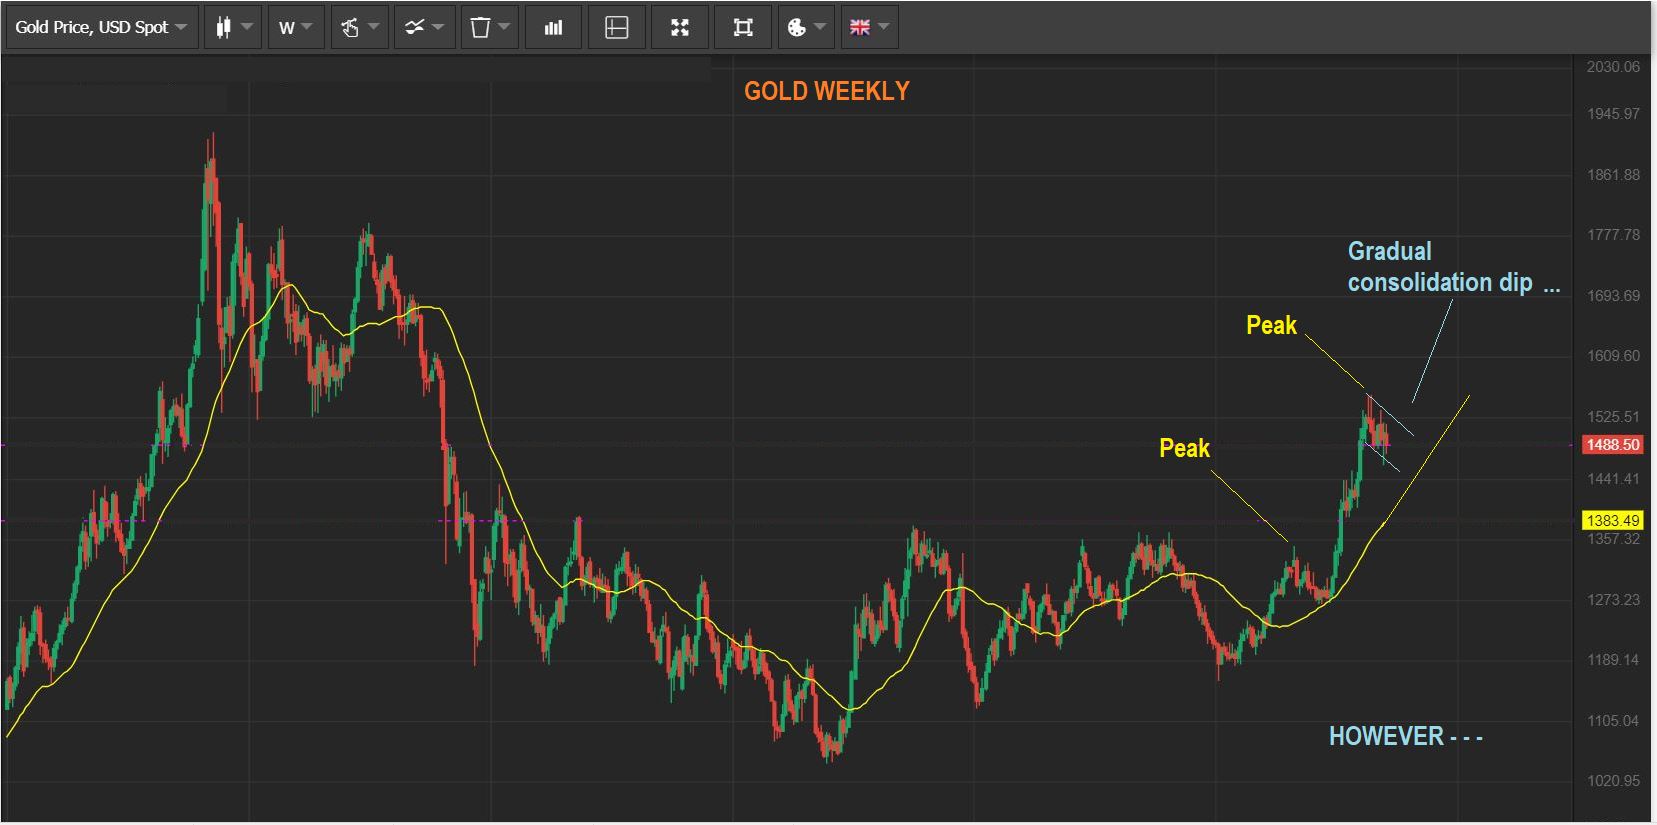
Gold sold off last week & closed below the 10 & 50 sma on a daily. The sell off into a dcl, possible ICL seems to be underway. Smart money shorts have been reduced since the ‘peak’ of this Intermediate Cycle.
.
This COT is from before Golds Thursday & Friday drop, so we may see another reduction in next weeks COT.

.
GOLD – This is a weekly chart. Click to enlarge.
Gold has had a Mild sideways chop & drop on a weekly basis, right? This looks like it wants to drop to the $1440 area…
Is it possible that Gold could even drop below $1400?
.
GOLD – I have seen these mild sideways drops suddenly just crash into the lows, so yes, Sub $1400 is still possible if we are dropping into an ICL. Read the pink writing on the chart. The Big Picture for Gold indicates more downside.

.
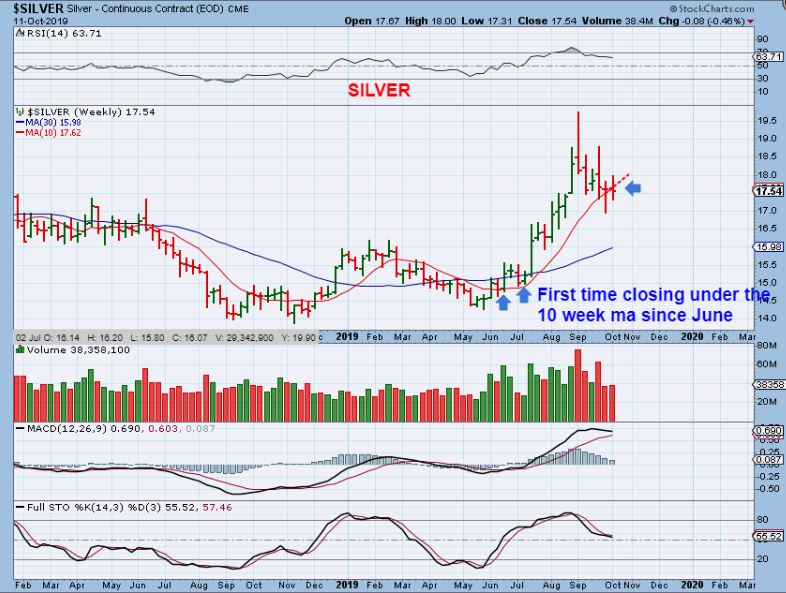
SILVER DAILY – Silver met resistance on the down trend line and started to sell off too.

.
SILVER WEEKLY – Silver closed under the weekly 10 ma for the first time in 4 months. The drop into a dcl appears to have started here too.
.
GDX – We now have a series of lower highs and lower lows. Recently, after tagging that downtrend line & 50sma, GDX was rejected. Notice how much the volume increased as the selling picked up Friday when it crossed below the 10sma. Therefore…

.
DUST / JDST – For those that like leverage (Be safe), DUST & JDST can be traded, and it broke higher on increased volume too.

.
GDX WEEKLY #1 – GDX has spent 3 weeks under the 10 week ma, chopping sideways on a daily basis, but the selling may accelerate next week. From this chart, a drop to $25 seems reasonable, but…

GDX WEEKLY #2 – I am looking at the $24.25 area to $25.50 area with Fib retracement. As this plays out I will make any necessary adjustments. Notice the stochastics.

.
We have been experiencing very choppy markets lately, and it has been in almost all sectors. After Fridays trading, it seems that the short term direction has revealed itself.
– The General Markets are on day 6 & should be heading higher ( or choppy & higher).
– Oil looks to have bottomed & reversed, and the XOP may have put in a back test of the break out , forming a double bottom. These should also be able to move higher.
– The Precious Metals sector also seems to have chosen its next direction too. After days of chop & pop & drop, the overhead resistance at the 50sma & a trend line capped price. Selling seems to be taking over with the Miners too.
-Basically, in the bigger picture that would be Long the Markets & Oil , Short Precious Metals. I do not have any long positions in Oil / Energy right now though.
.
Enjoy the rest of your weekend!
.
~ALEX
.
GOLD WEEKLY From SEPT 27 – My Big Picture expectation for Gold in September was for a possible back test. around the $1380 area. Today I briefly discussed that Gold still could get under $1400, so we’ll watch & see.

.
GOLD MONTHLY FROM SEPTEMBER END – I was looking for $1375 area, and that target area can still be reached too. Time will tell.

.
SILVER WEEKLY From SEPT 27 – Since I drew this chart, Silver has tagged $17 & bounced, it is at $17.50. I still think that it can drop to my $15.50 – $16.00 area, but it will need to drop sharply to do so.


