Weekend Review Sept 22
There was an interesting move heading into the close of trading on an Options Expiration Friday, so let’s discuss whether they affect our analysis or have our expectations remained the same…
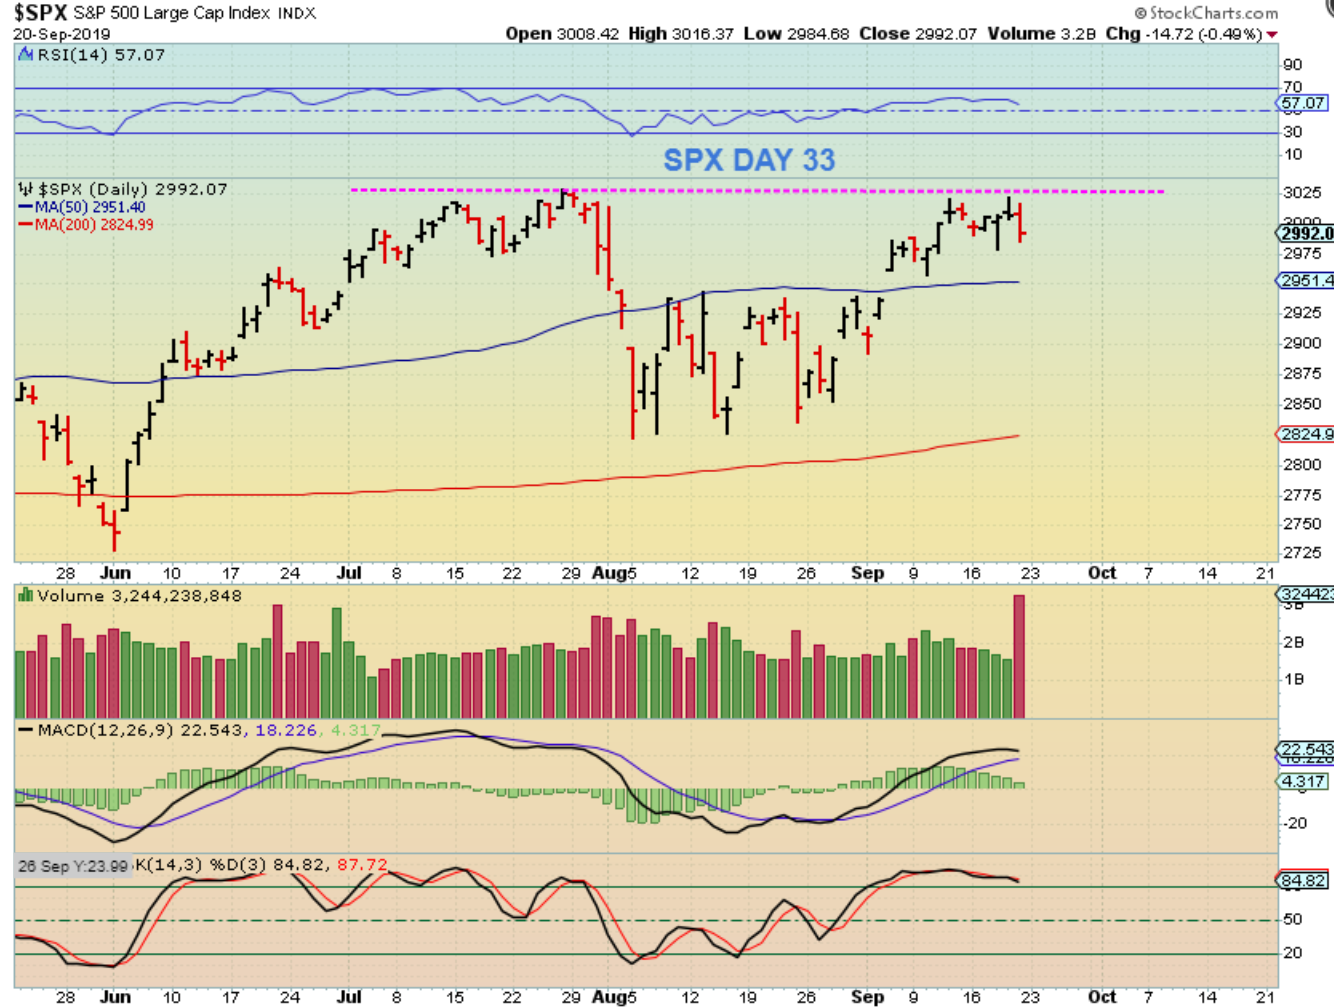
SPX – A drop for the general Markets Friday was not exactly unexpected. We are on day 33 of this daily cycle and should expect a drop into a dcl around this time.
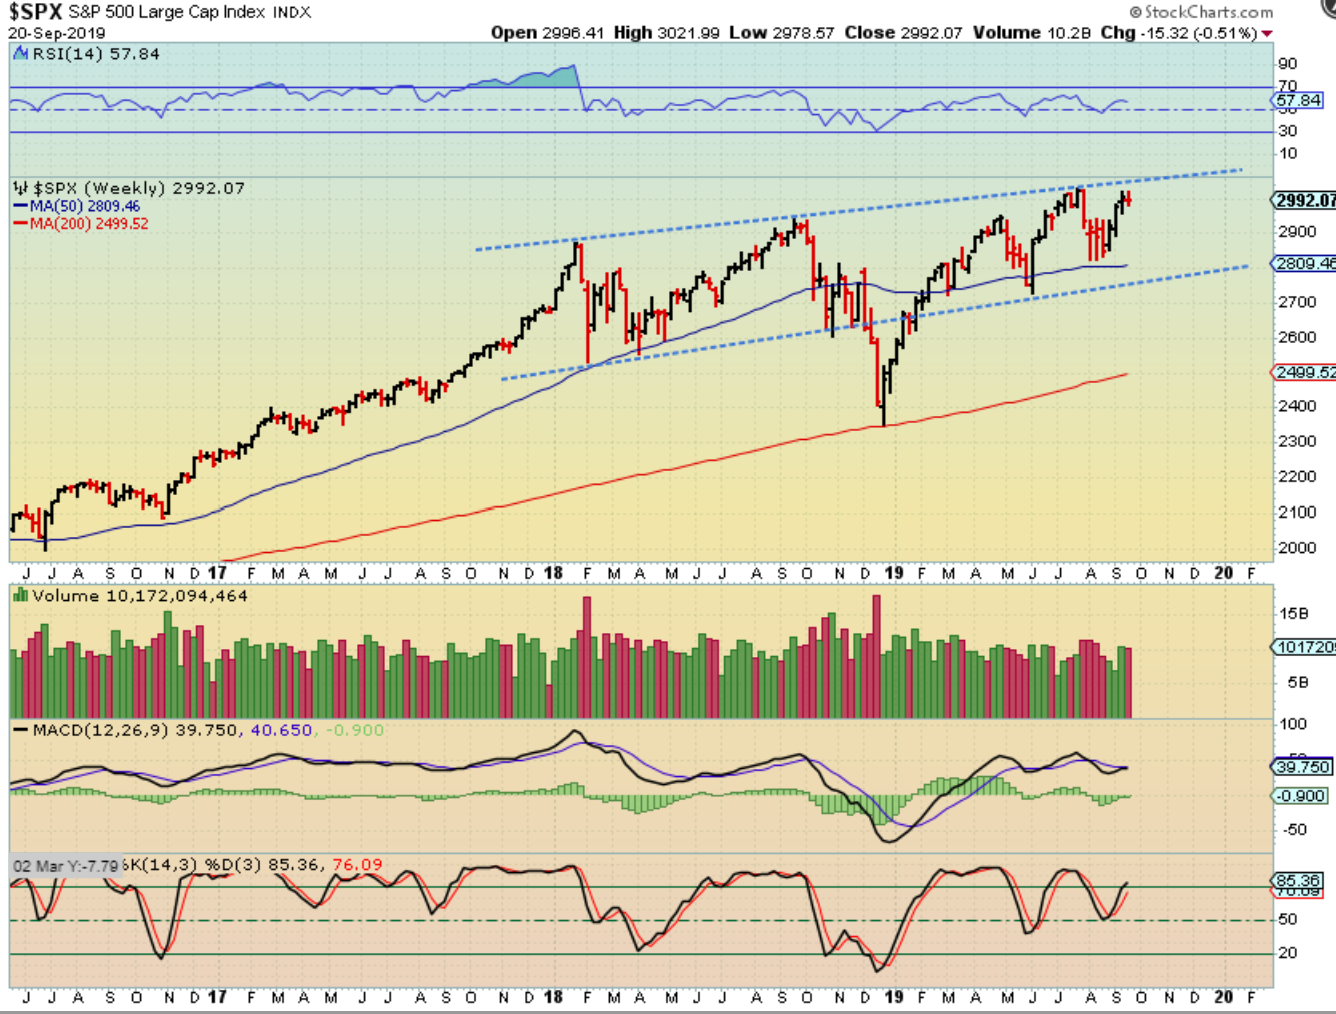
SPX WEEKLY – The Big Picture shows that we did have more room possible to the upside, so we’ll see if the dip continues immediately or does it resume a bit later.
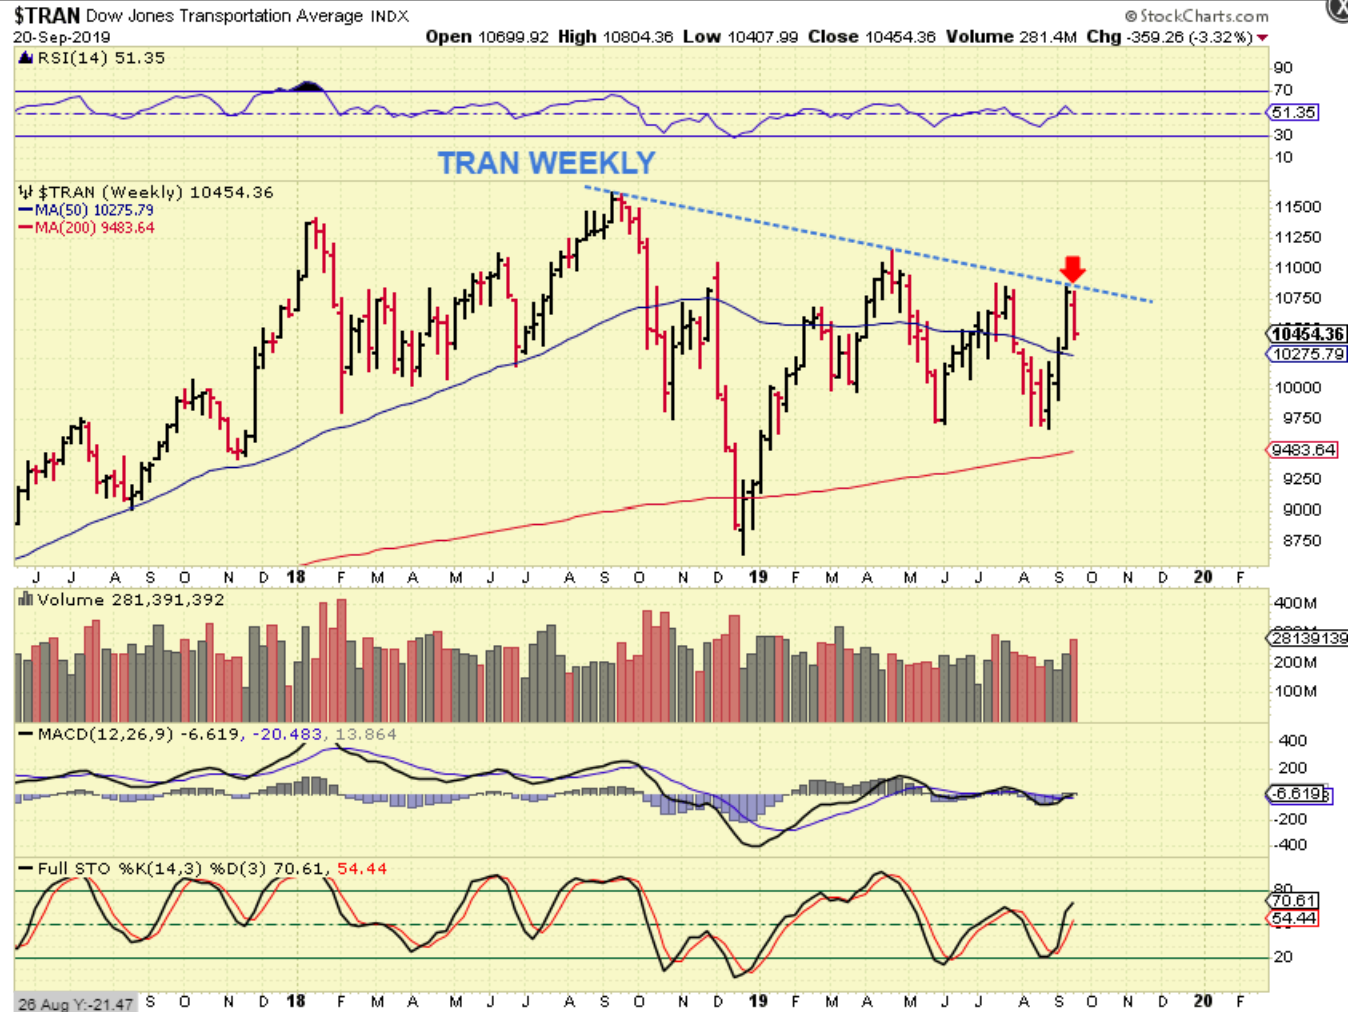
TRAN WEEKLY – The Transports drop as they hit resistance and we do have lower highs and lower lows in place, so the transports are not leading the markets higher.
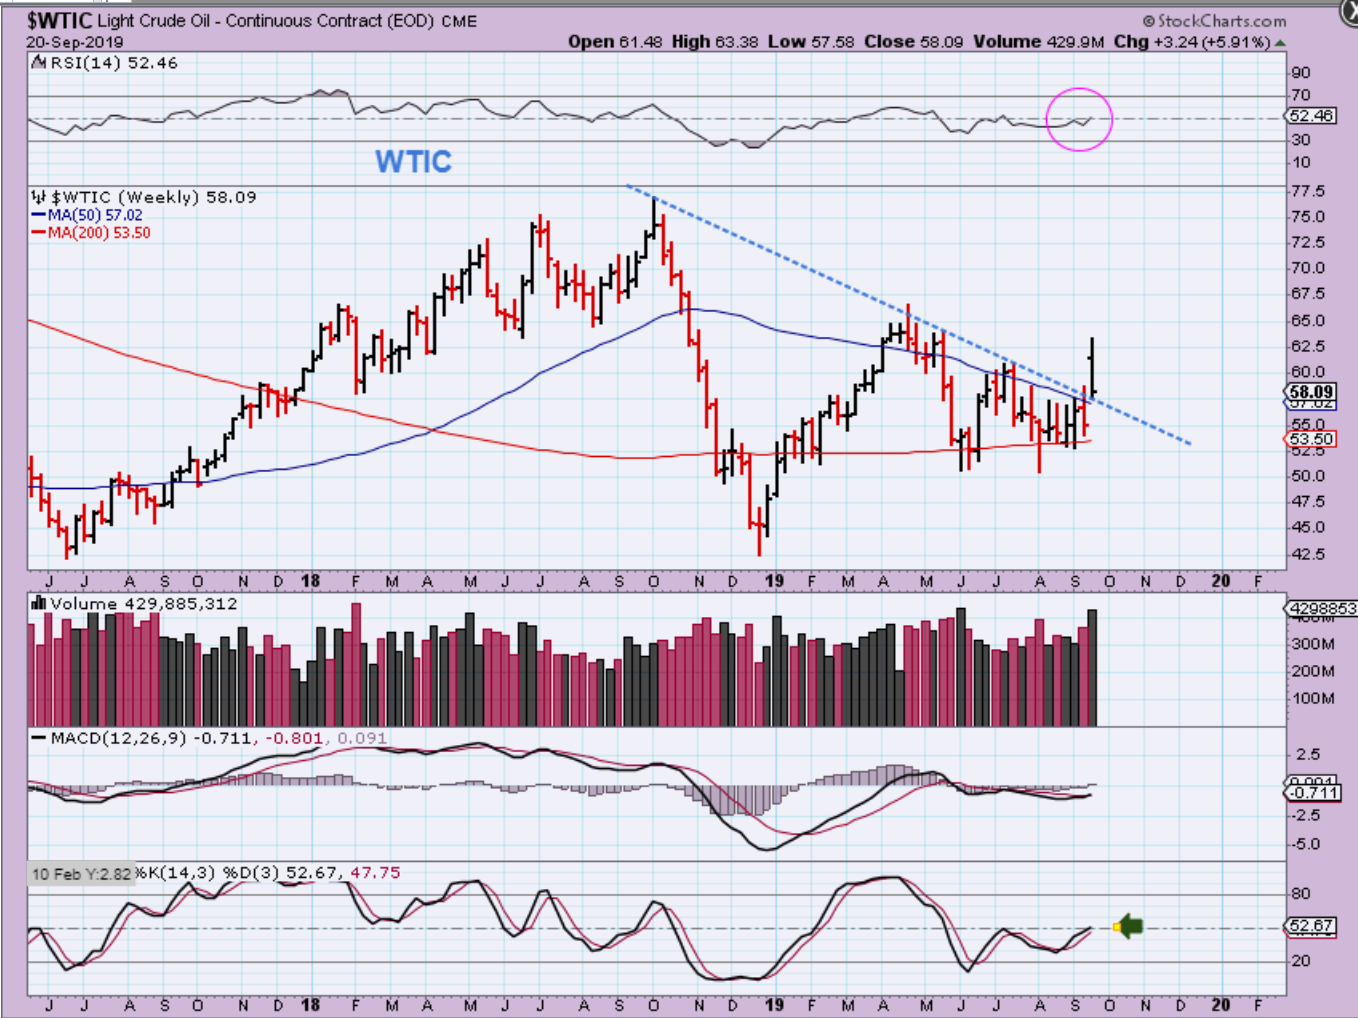
WTIC WEEKLY – With a drone strike seriously damaging a Saudi Oil Refinery, Oil broke out this week and then reversed right back down to the prior resistance. It is not overbought on a weekly basis so it can find support in this area, but it does need watching just in case it breaks back under support.
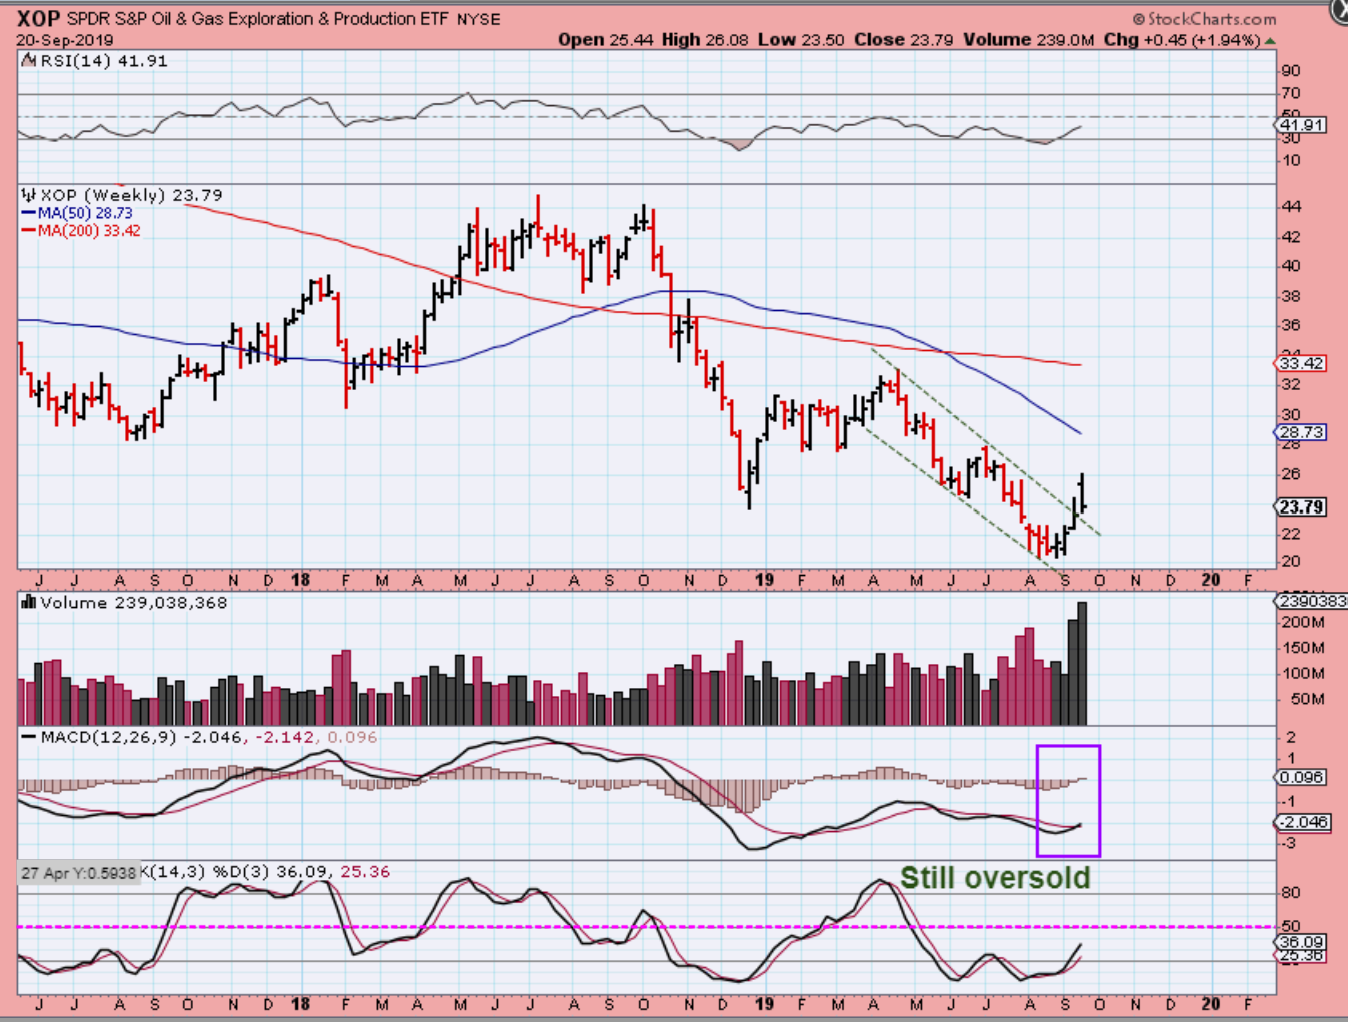
XOP – Oil / Energy stocks also Popped & dropped. Now we just need to see if this was the start of a move higher or part of a bottoming process.
.
REVIEW: The Precious Metals have been coming due for a dcl, and should be coming due for an ICL. We were watching the Fed Mtg this week for possible price action & a dcl. I was a bit surprised to see this sector acting a bit lack luster after that FOMC Mtg Wednesday, Thursday, and into Friday, but the last 2 hrs of trading on Friday showed a sudden sign of strength. What is expected going forward? Did that change things in the Bigger Picture? With that move, I’m thinking that instead of just discussing the big picture weekly charts, I want to add some detail with Daily charts for Traders. THE TOP OF THIS INTERMEDIATE CYCLE IS STILL LIKELY IN PLACE, BUT SHORT TERM ACTION COULD BE BULLISH. Let’s walk through this sector…
.
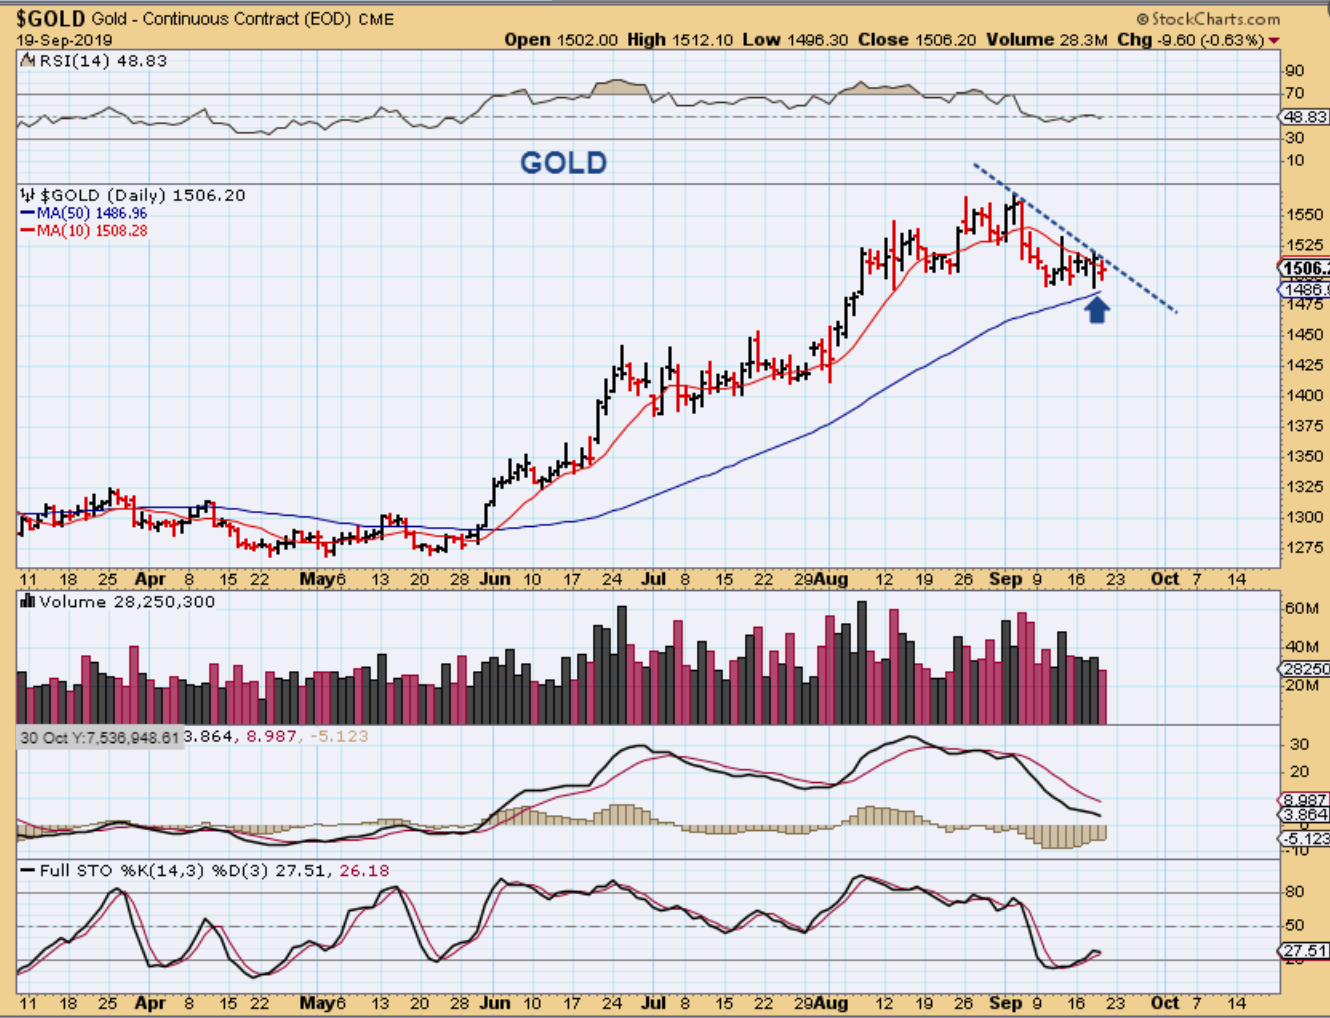
GOLD AS POSTED IN FRIDAYS REPORT – I said Friday , ” Gold looks normal and healthy from a chart perspective, but it is due for a dcl and needs to push higher above the down trend. A dcl may already be in place as we wait for that push higher.” NOTE: The 10 sma would be $1508.
.
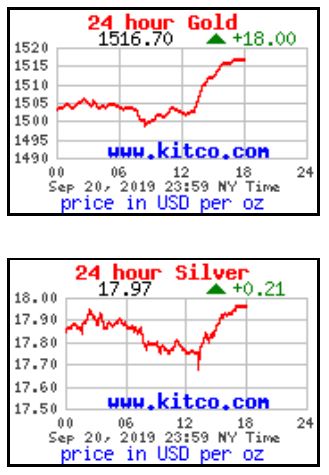
GOLD – You can see that Gold & Silver sold off early Friday and then sold off again after 12 p.m. Eastern Time, but then they suddenly started to climb into the end of the day. Since Gold shot up $18 above that $1508, that is a break of the 10 sma mentioned above, and Miners did follow…
.
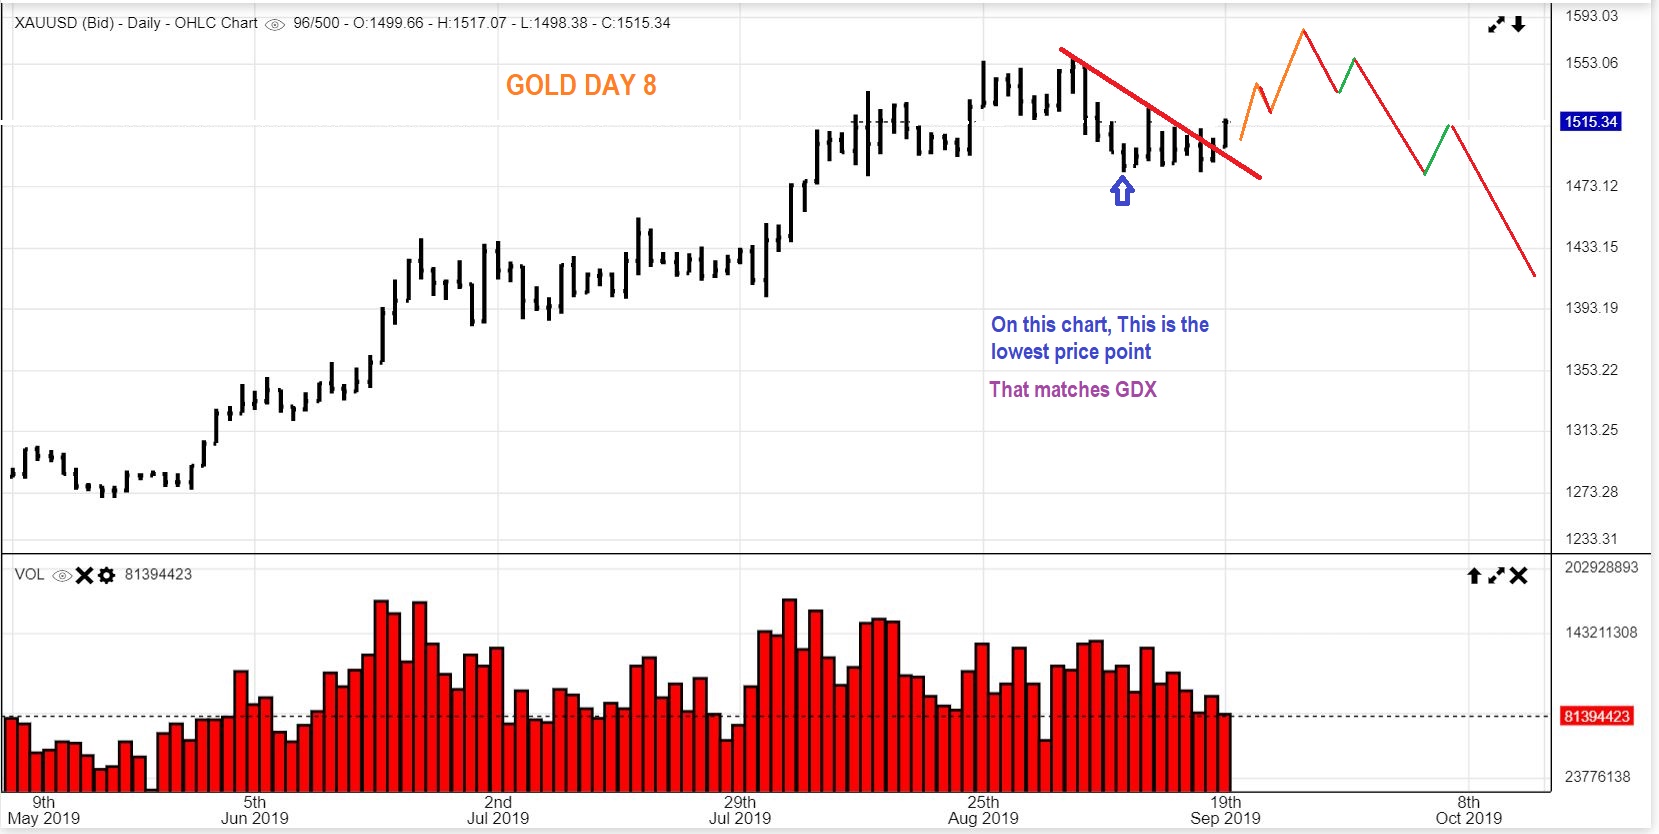
GOLD – This is already day 8, and if this will be L.T., it can peak this week. The last Daily cycle was Right Translated, so this MAY OR MAY NOT make new highs as shown, and if we are coming due for an ICL, we need to remain alert. I will look for signs of strength or weakness as this moves forward. We may only see a brief run that forms L.T. & Rolls over.
.
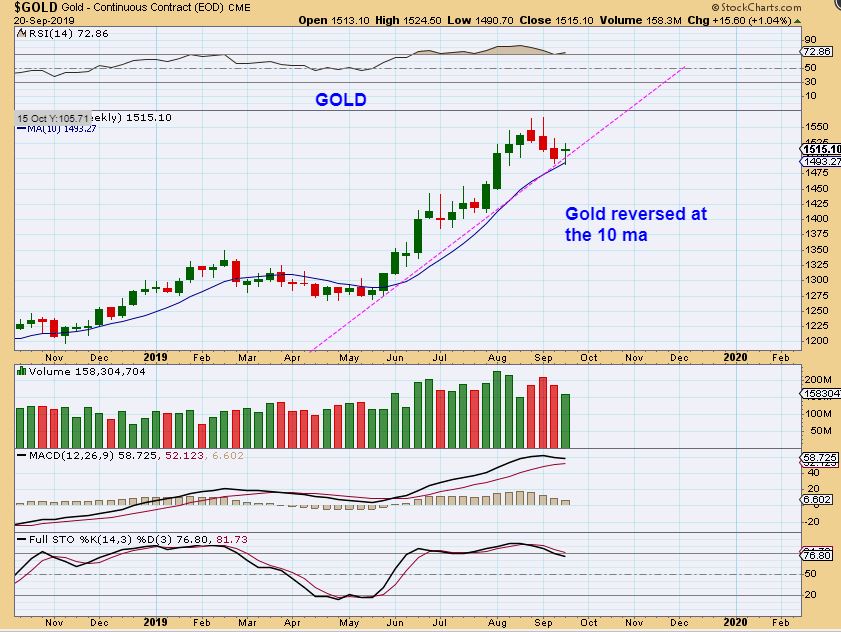
GOLD WEEKLY – On a Gold Weekly Chart we see a bullish reversal at the 10 ma. In technical analysis after a bullish trend higher, that is a Buy with a stop under the lows. Raise the stop as price moves higher, because cycles call for caution when we are 4.5 months ahead of the last ICL in May.
.
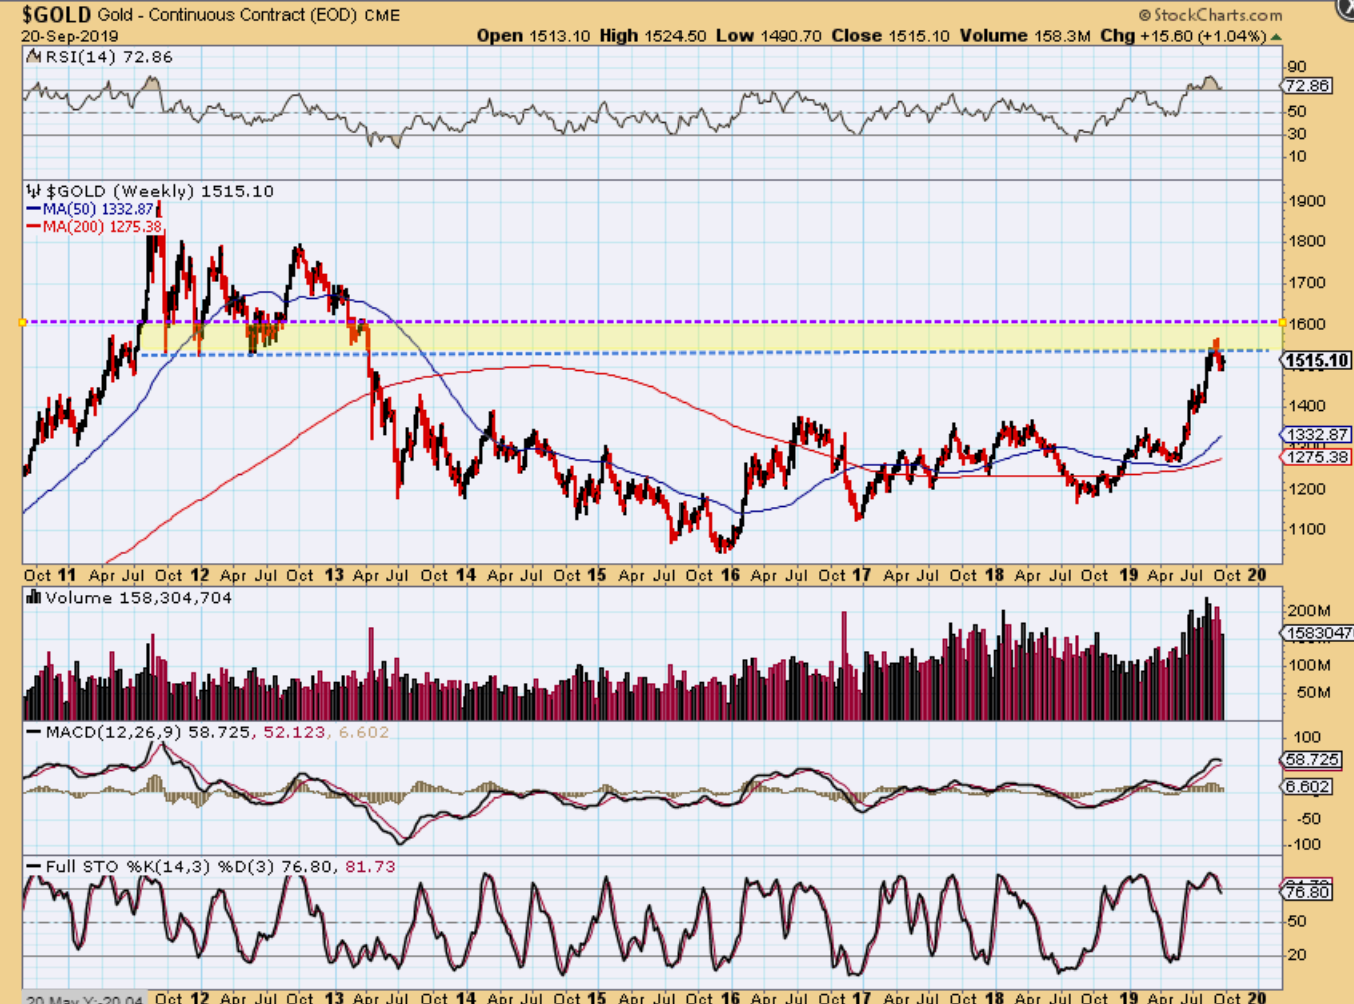
GOLD WEEKLY – You can see that we remain at solid resistance and Gold may continue to struggle here. If it does, we can expect a pull back into an ICL and then a push higher to break through this area. Could gold Break through resistance after the recent pull back? Yes, as a bullish anomaly this could race higher, but it does seem less likely at this point, so we need to watch this sector closely as it moves forward.
.
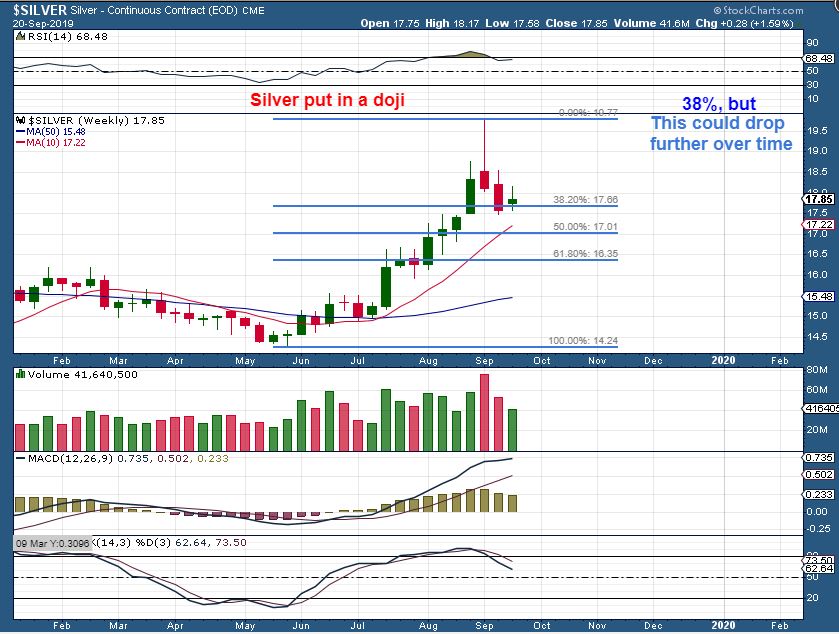
SILVER WEEKLY – Silver reversed well above the 10 ma, but found support as a 38% retrace.
.
GDX DAILY FRIDAY MIDDAY– I grabbed this chart on Friday to show that GDX was being rejected at that 50sma midday. After a Fed day reversal, we had no follow through due to that 50 sma…
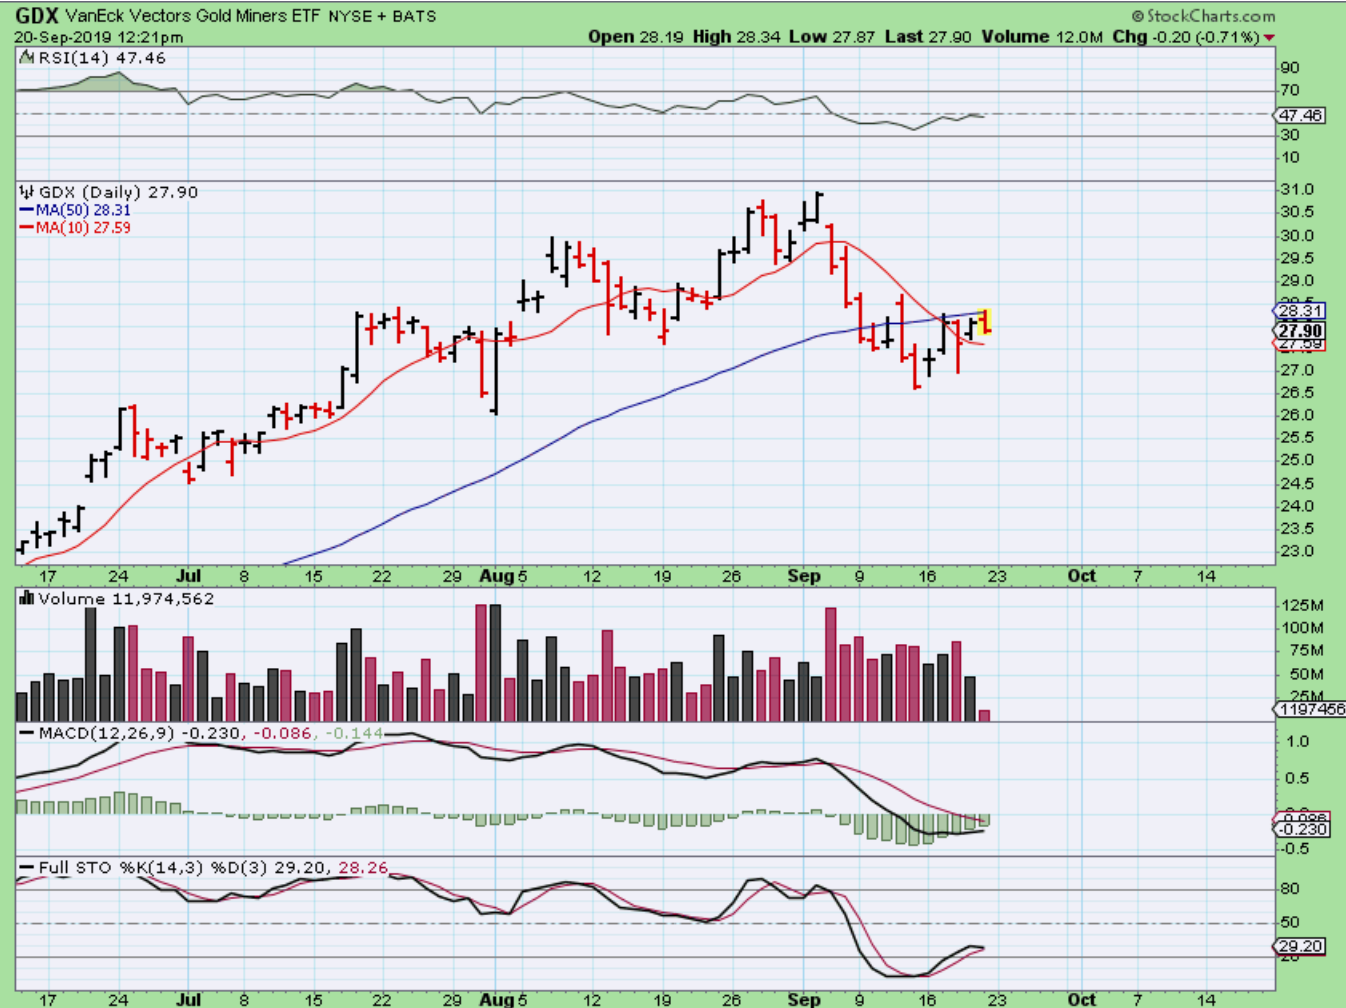
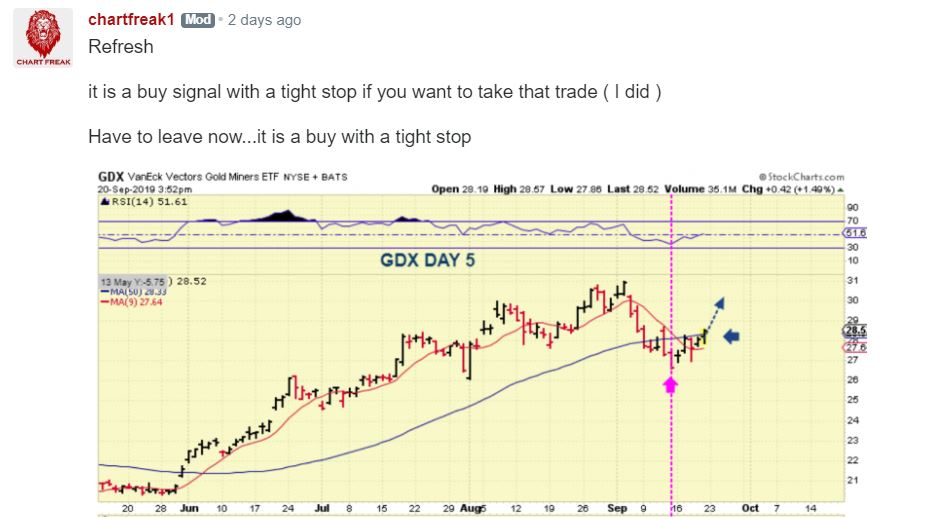
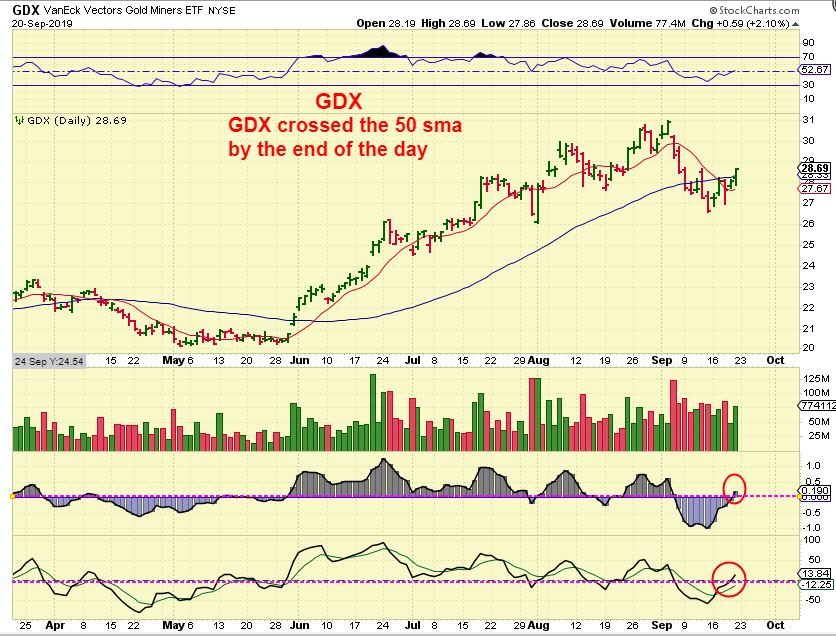
GDX – Suddenly Miners began to rise with Gold and GDX pushed through that 50 sma. I was writing in the live comments area that this move looked good and is a short term buy. This is a day 5 push higher. This is what I posted.
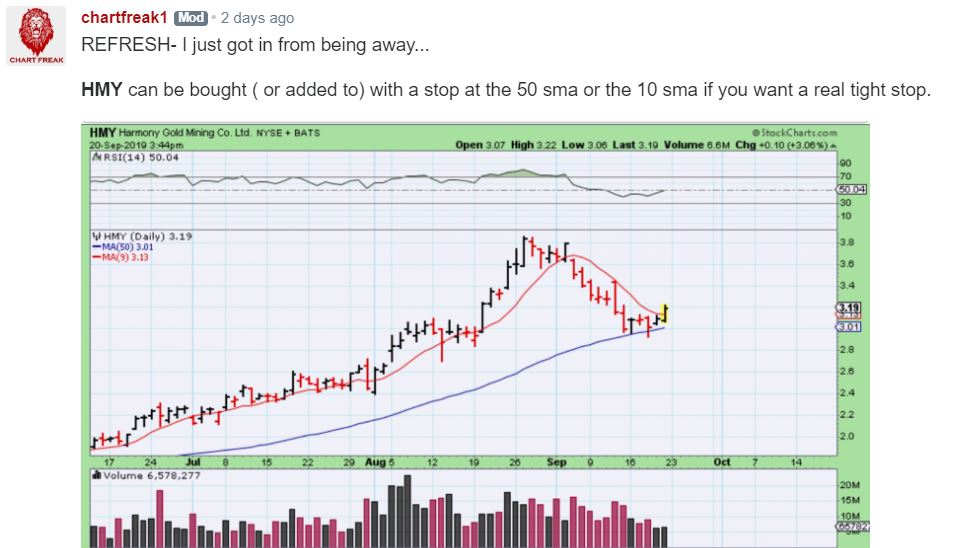
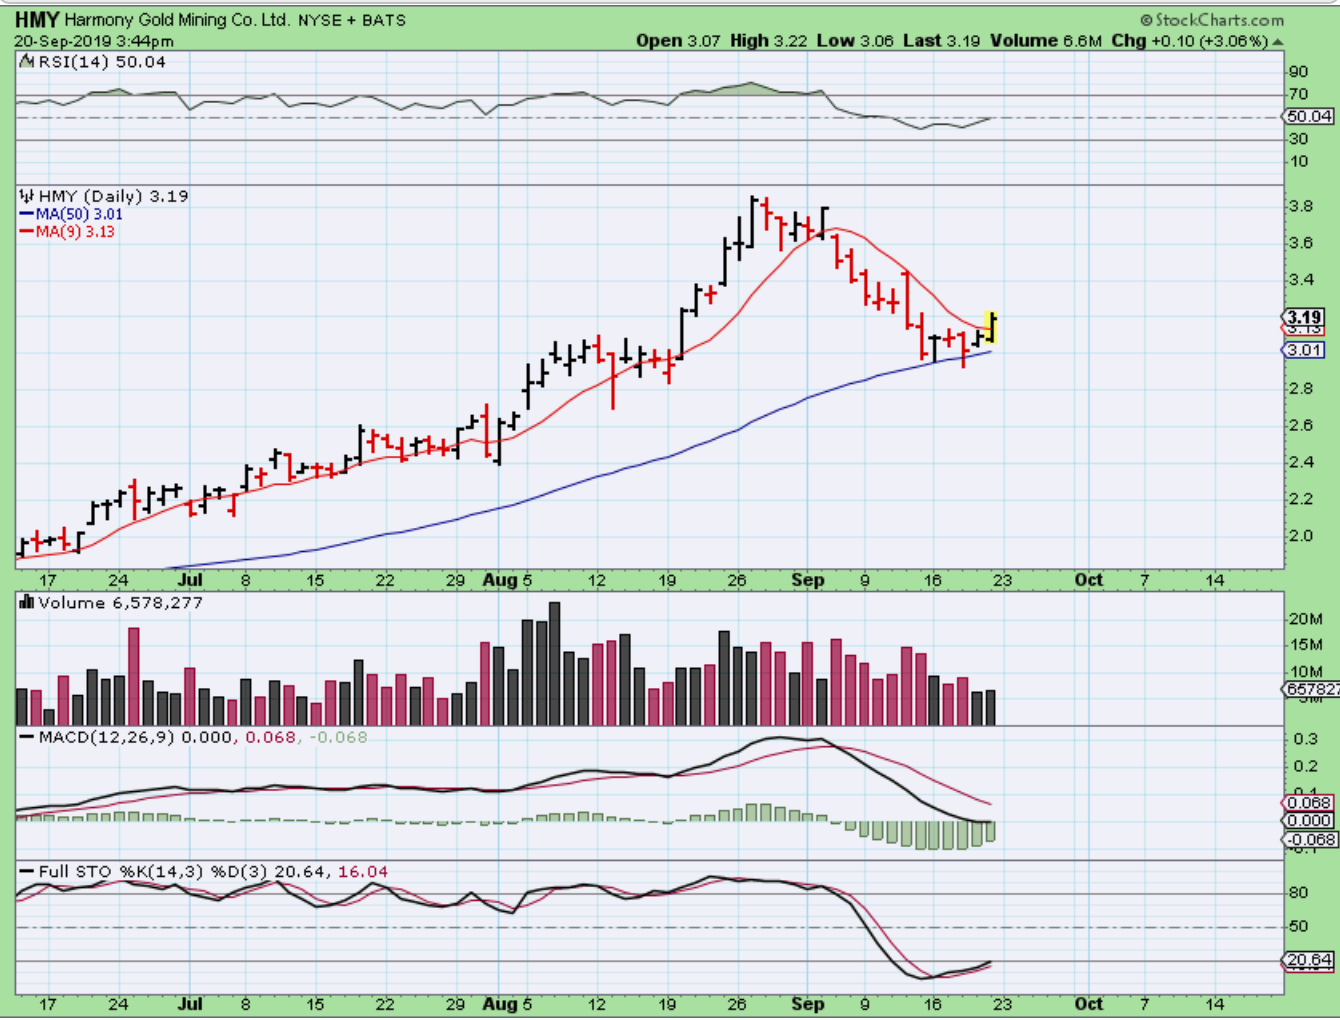
HMY & CDE – I also have discussed over the past week or two that I owned DRD, HMY, CDE, etc recently, and I posted this Friday in that live trading area as a Buy and will discuss things further at the end of the report.
.
GDX – CAN IT run to the former highs? Yes, since the last daily cycle was R.T.
Will it run to or even break the highs? We don’t know, and a late daily cycle has to be taken step by step, since it can also become weak at any time. That said, some of our Miners may make some nice gains next week ( I will add that to the end of the report).
.
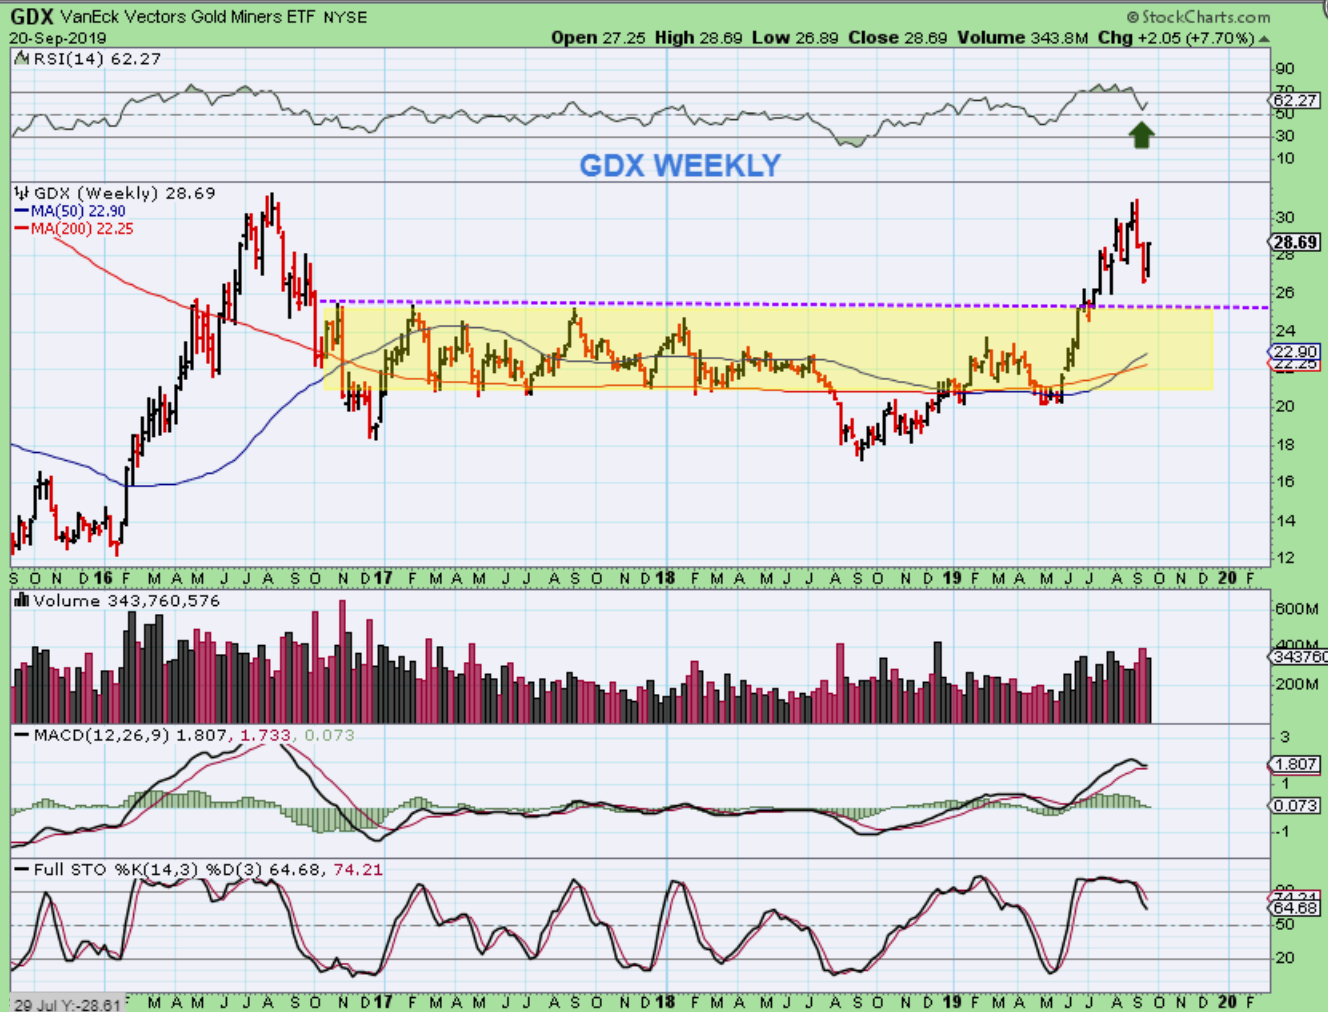
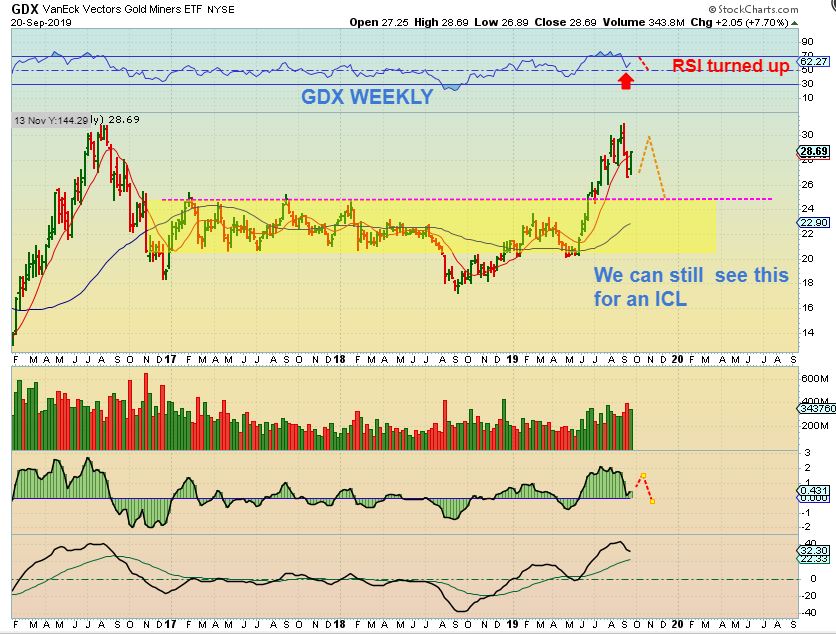
GDX WEEKLY – What started as a lack luster week ended with a strong reversal.
.
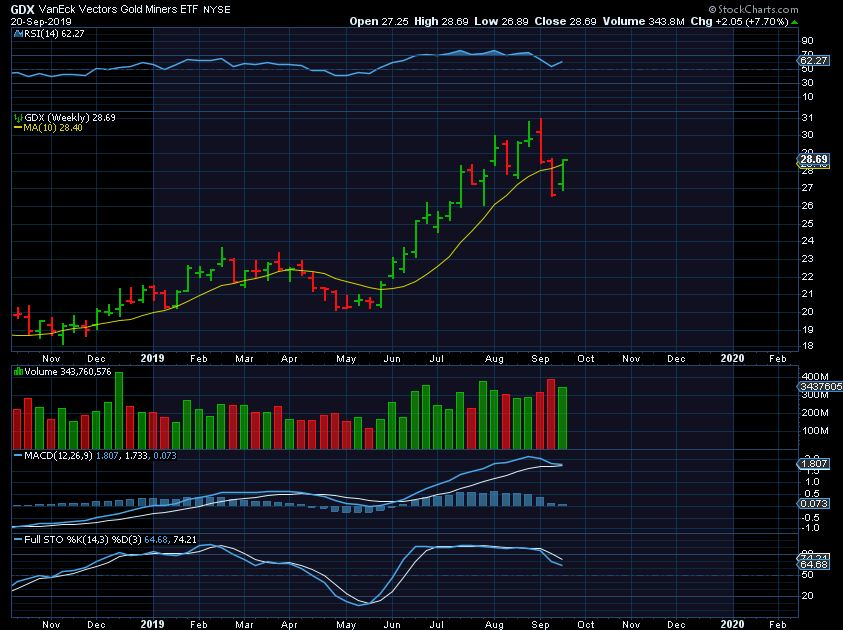
GDX WEEKLY – The weekly chart flipped to the point that it closed back over the 10 week ma.
GDX WEEKLY – And we can see that this was a drop to the 38% retrace.
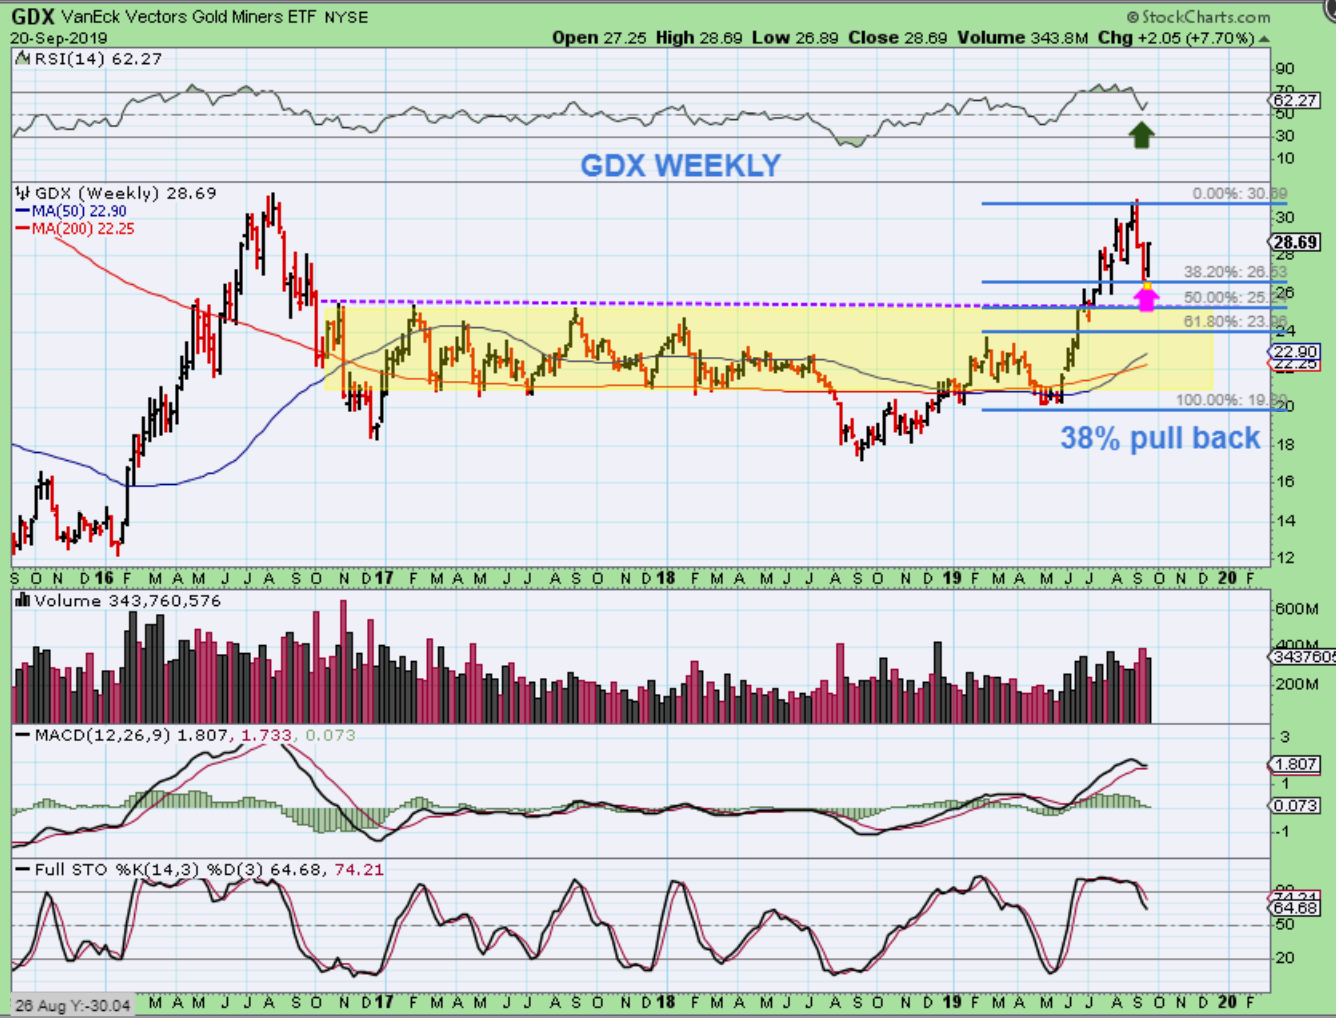
GDX WEEKLY – I see a similarity with the 2016 ICL, but this does NOT fit the criteria of a pure ICL set up. In a Bull Market run, however, surprises do come to the upside, so I do think that certain Miners can be bought ( Maybe just for a quick trade), they just may need to be babysat a bit closer.
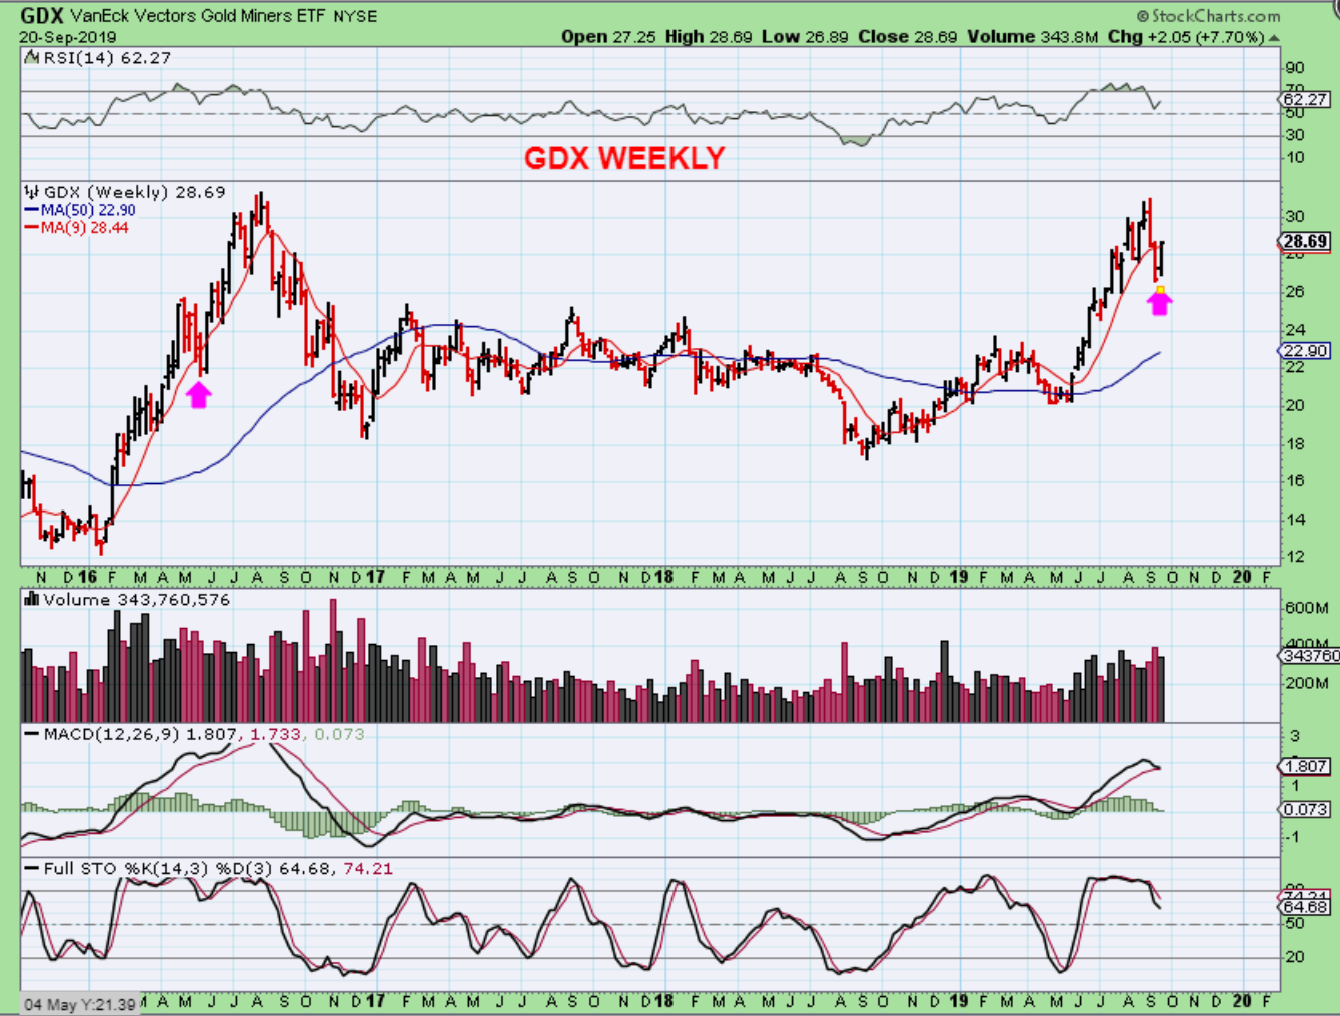
GDX WEEKLY – We may end up with something like this after this daily cycle unfolds. THIS IS VERY POSSIBLE WITH AN ICL AHEAD.
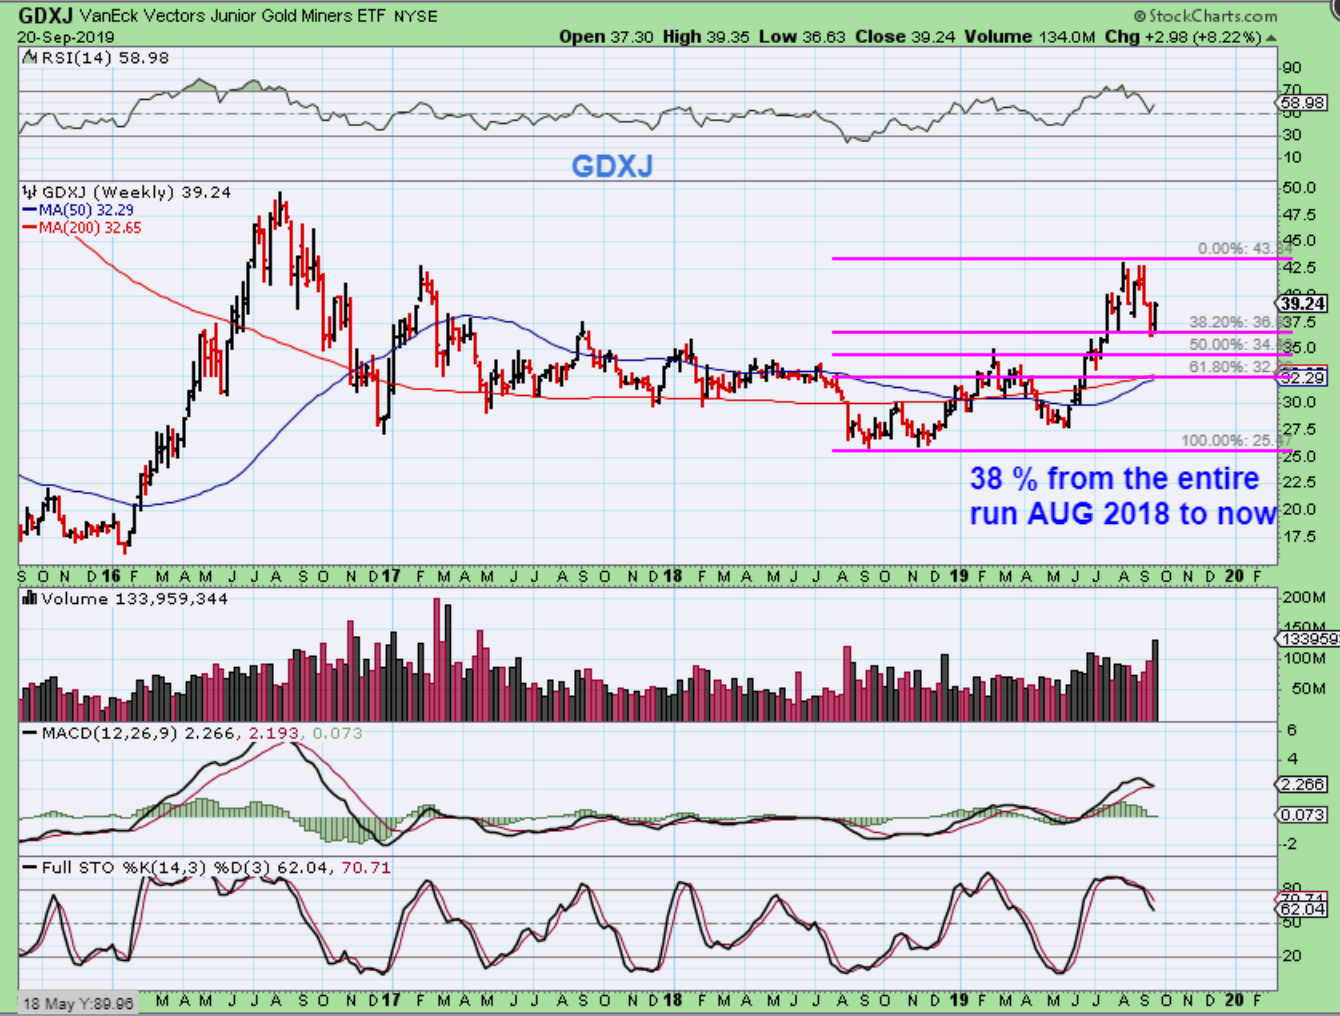
GDXJ – We had a 38% drop for GDXJ too .
.
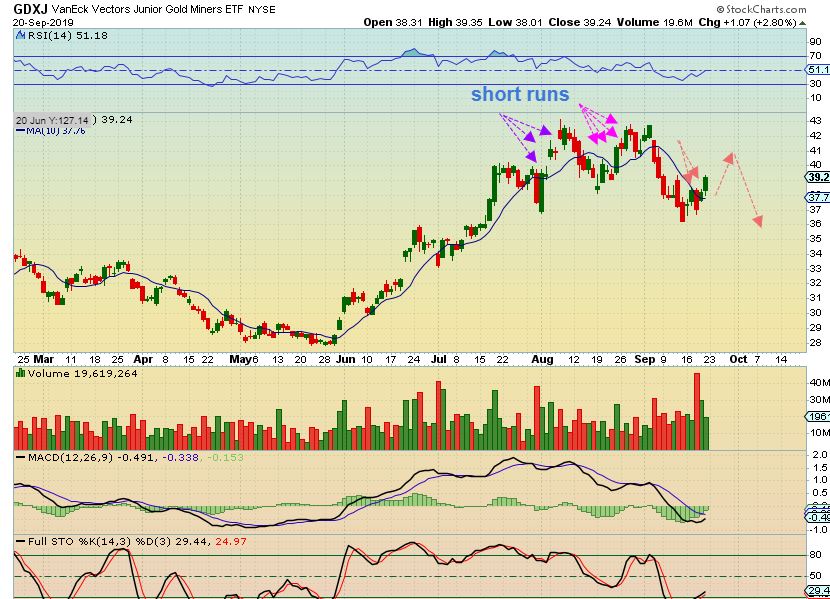
GDXJ AS A REMINDER: GDXJ & GDX reversals look great, but often move higher for short periods of time late in the intermediate cycle. Individual Miners like EGO, DRD, HMY, RGLD, AU, etc ran stronger as leaders, that may help your basket of Miners or trades, but the ETFs can get choppy.
.
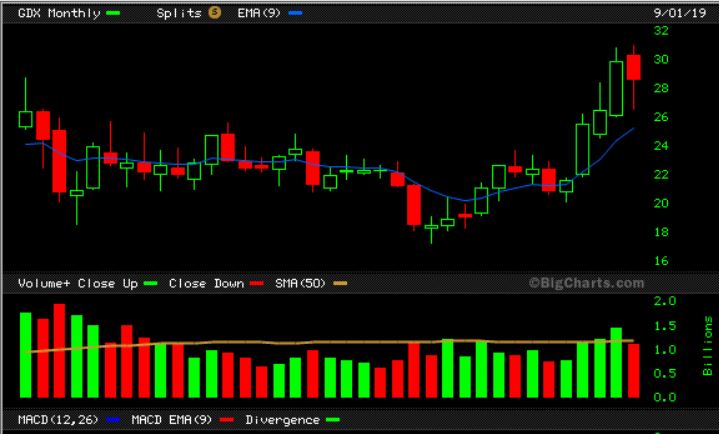
GDX MONTHLY – You can see that even if GDX rises this week, the Month ends next Monday and we could have a topping Candle forming. I will just keep in mind that a run in Miners is possible, but could be shorter lived than one would hope for. Under these conditions, I personally just Use Stops, Raise Stops over time, and Stay Frosty! You may still be able to lock in solid additional gains.
.
I will discuss a few Miners below
.
~ALEX
.
HMY – I have been saying that I bought HMY at the 50sma because it is acting Bullish during the pull back. Like DRD, it reversed at the 50sma. I posted this chart in the live trading area Friday as a break above the 10sma showed follow through & I added.
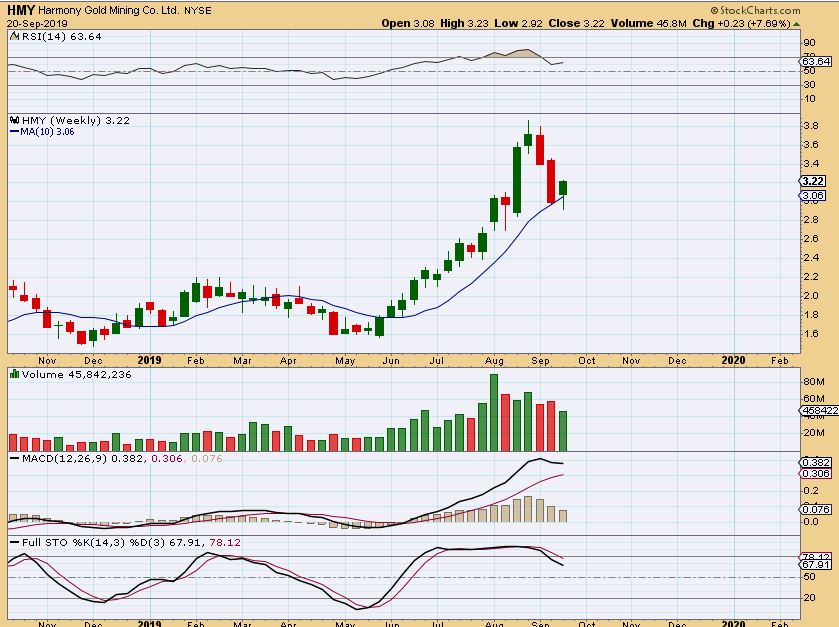
HMY WEEKLY – Stepping back to the weekly, that is a bullish reversal at the 10 week ma. I mentioned in reports last week that my DRD trade is making good gains and that even a simple run to the recent highs for HMY would be 25% gain. Miners move quickly, this could run to recent highs.
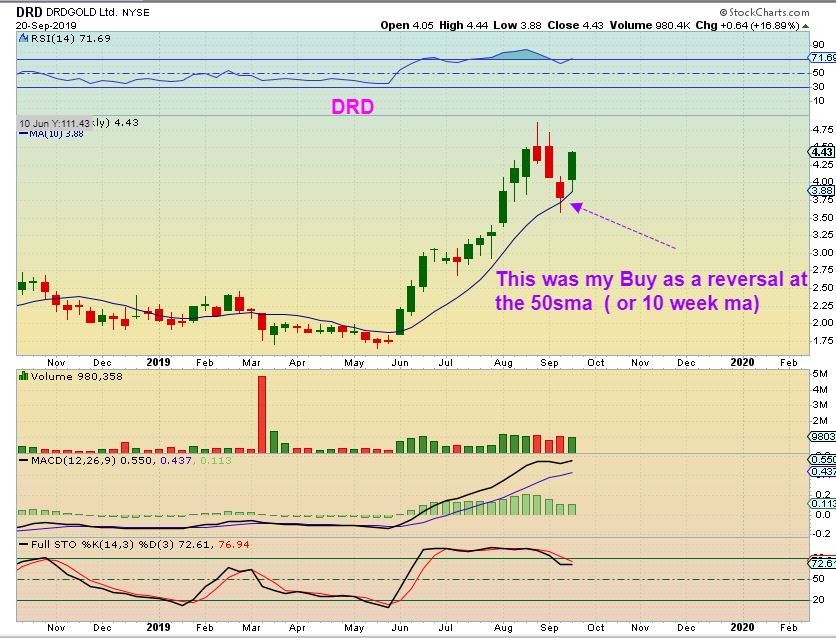
DRD WEEKLY – You can see that the DRD trade is already up 20% and was bought with a stop at the 50sma after the reversal.
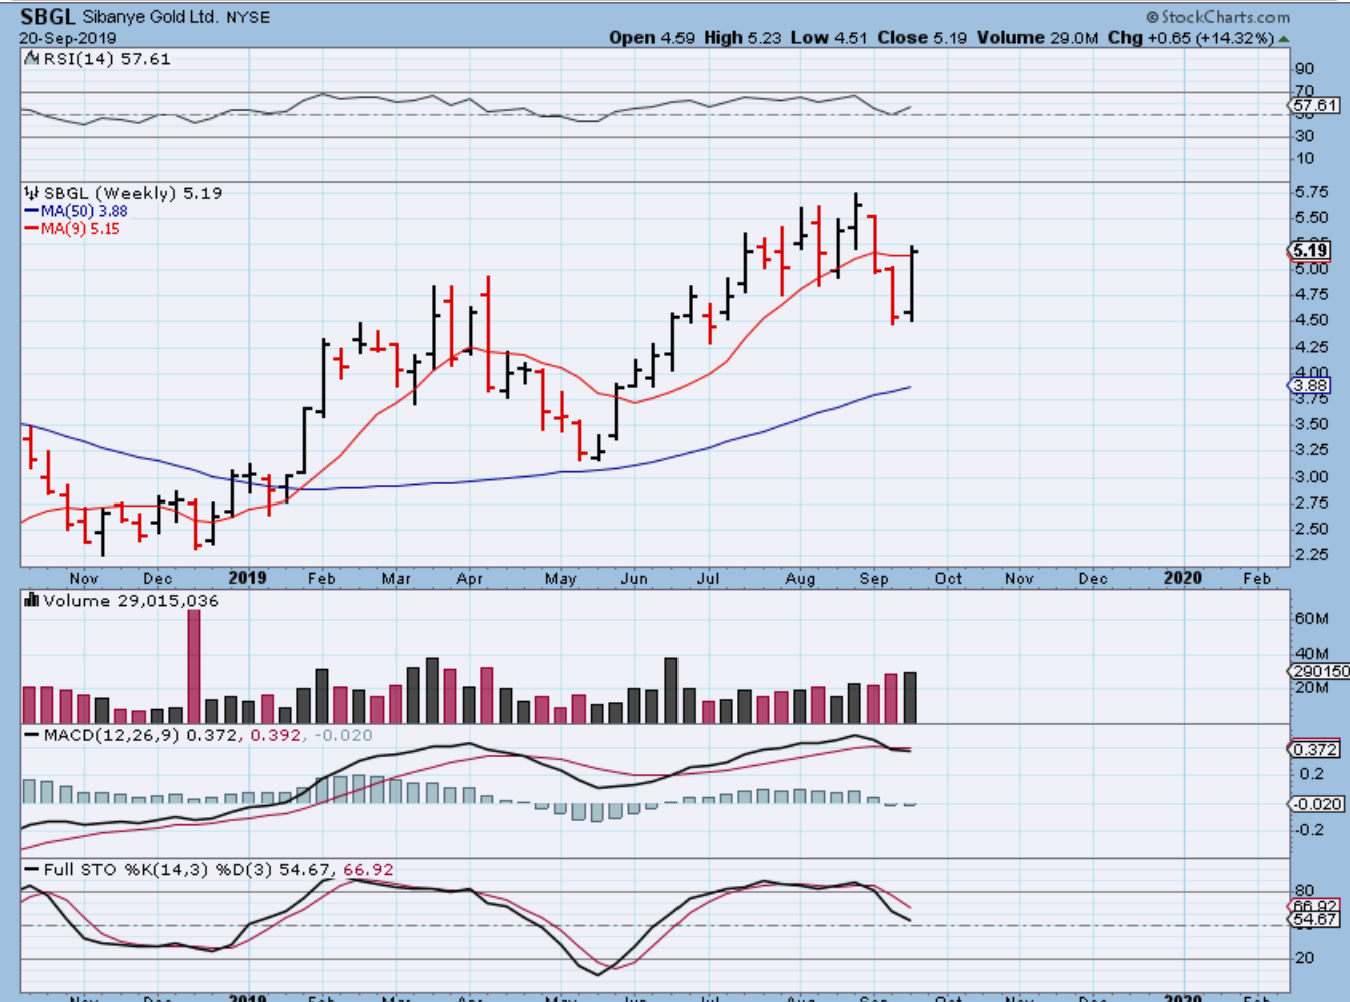
SBGL – I pointed out SBGL in that live area Friday too. Look at that sell off in September, it was fairly steady, but much of it was erased last week. That is a strong reversal, breaking above the 50 sma, and…
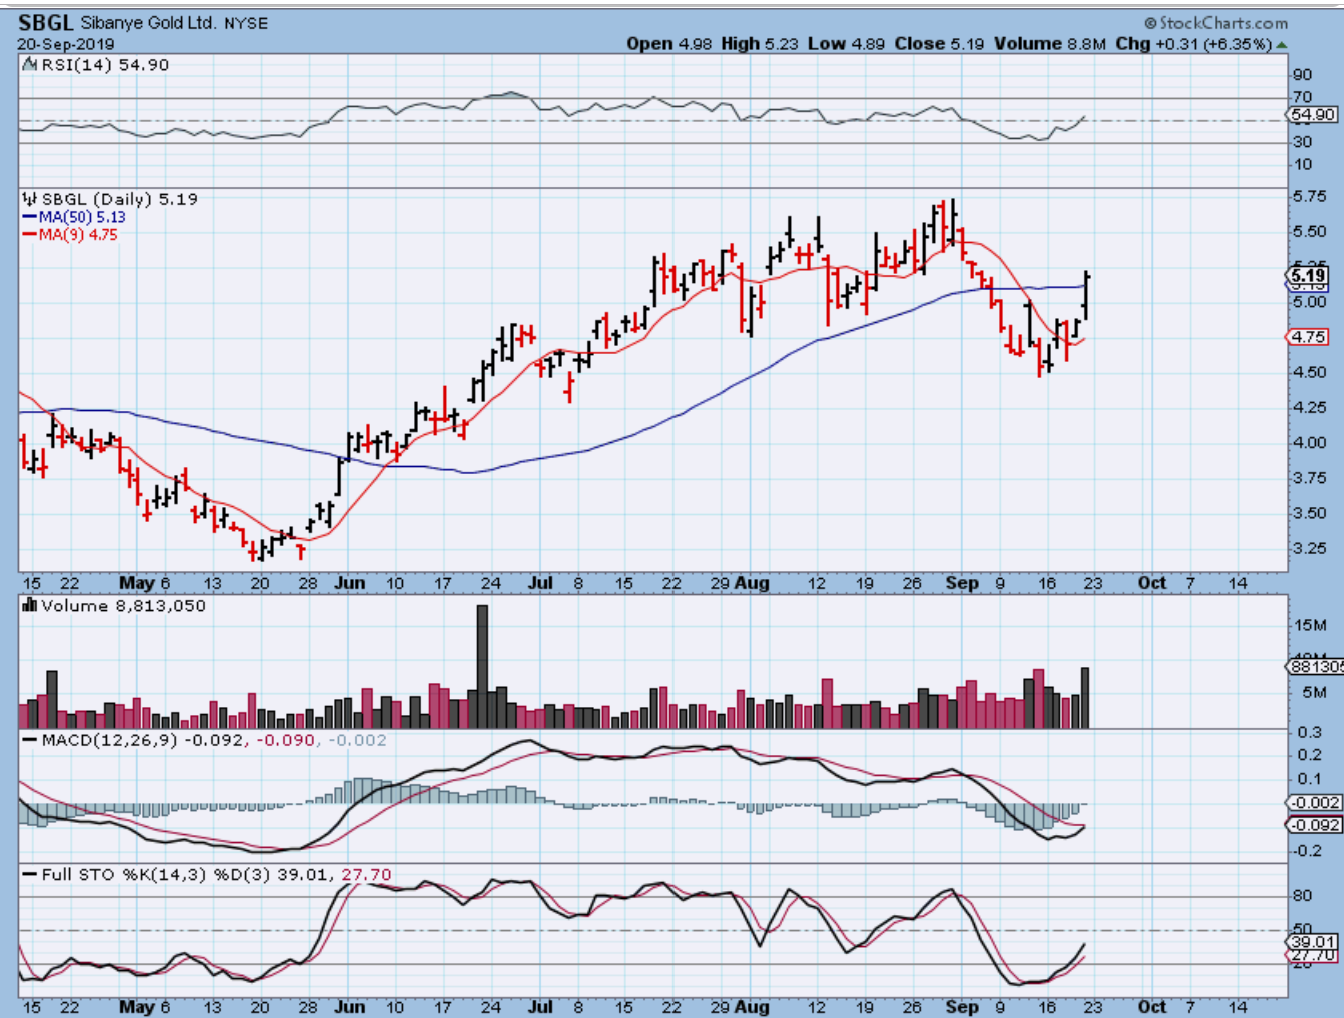
SBGL WEEKLY – That big reversal on the weekly chart had SBGL up 14% for the week. The bullish surprise was to the upside for SBGL after a pretty steady drop on the above daily chart.
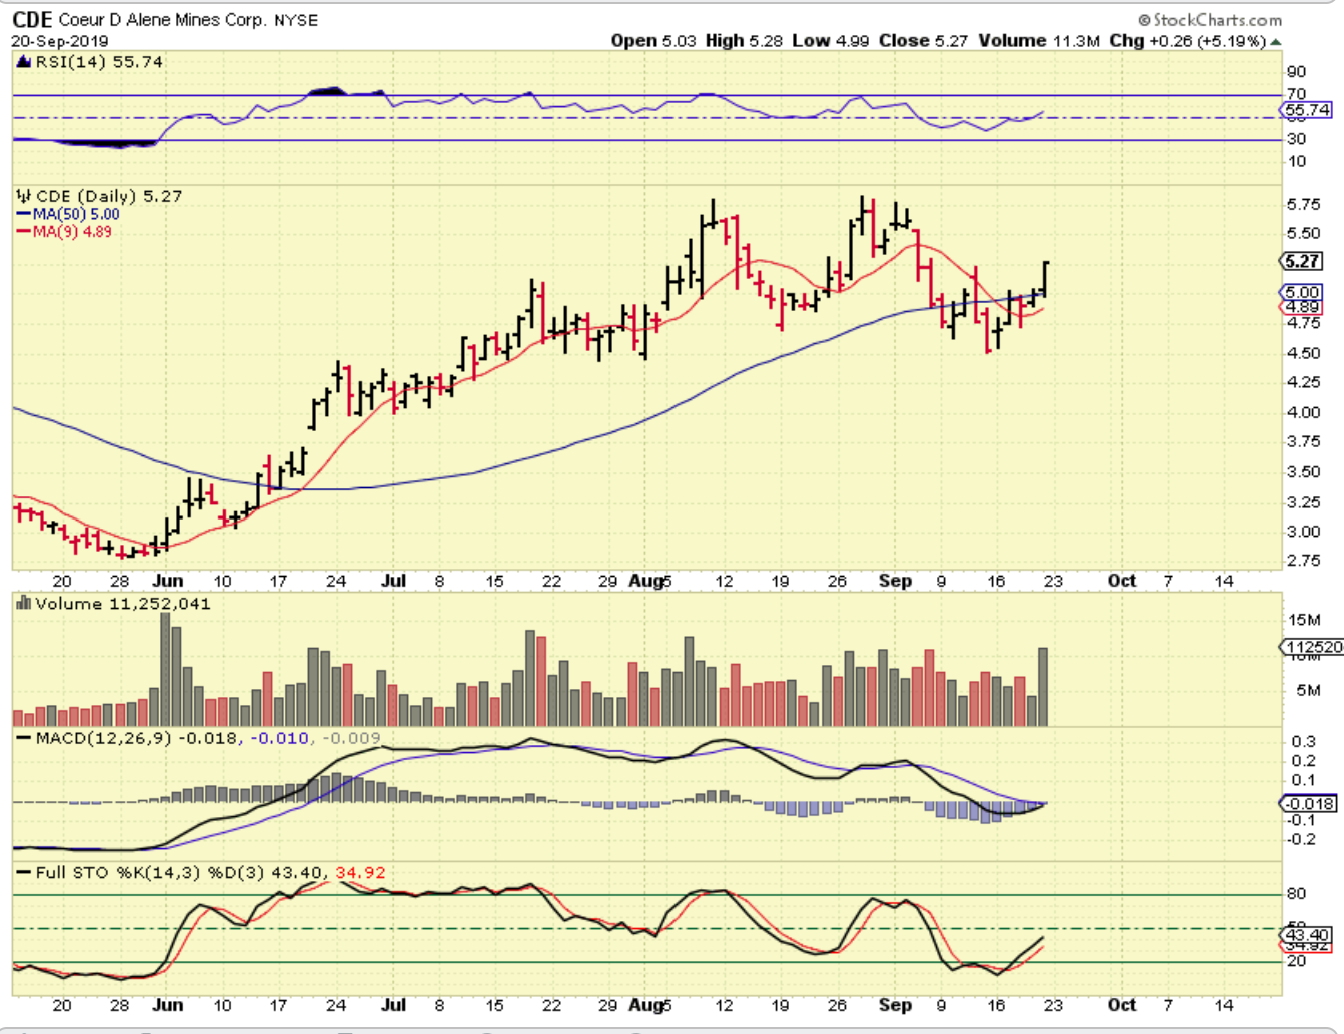
CDE – I also posted this at the end of trading Friday as a possible shake out happening in Some Miners like CDE. I mentioned that even a ‘small’ run to former highs is a $5.00 to almost $6 run.
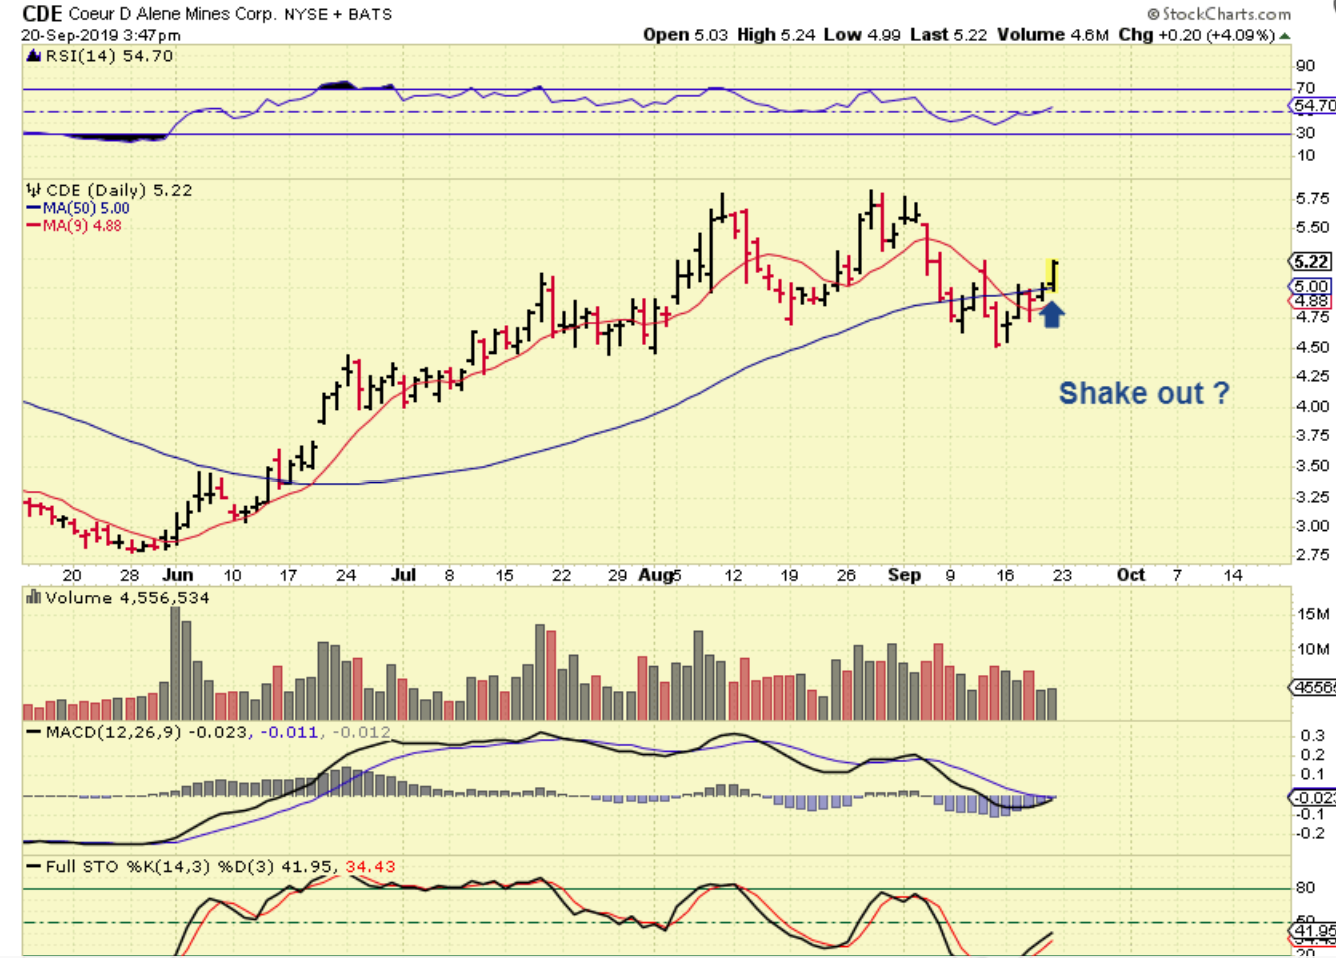
CDE – It closed at the highs with big volume ( options expiration).
.
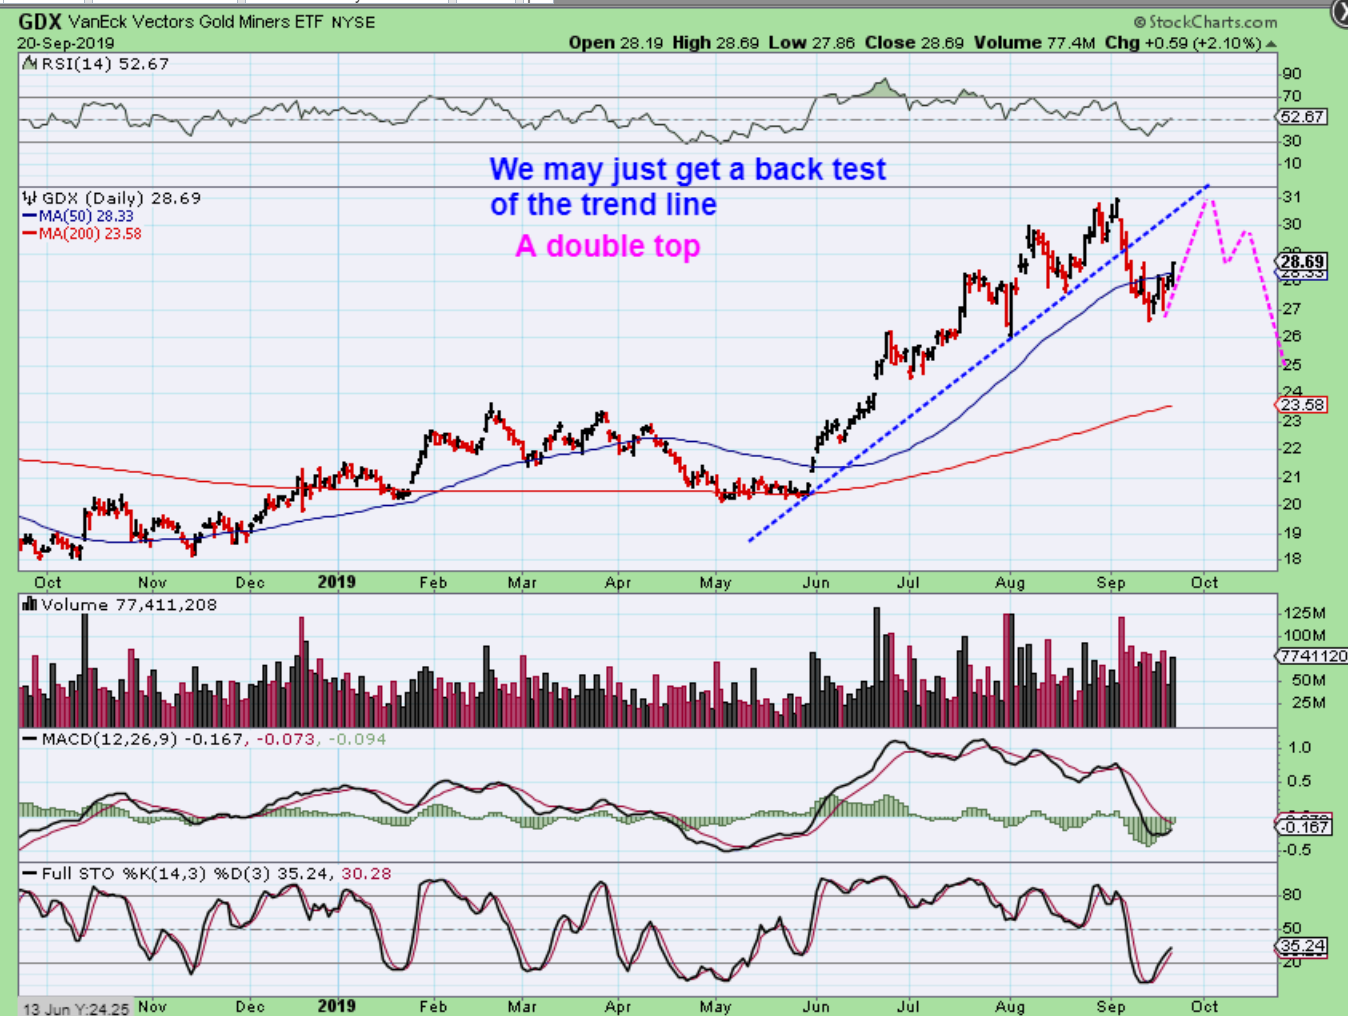
GDX- If GDX wants to bullishly run all the way back to recent highs, we could get a double top & then drop to an ICL, so again, at this point I watch for strength or weakness going forward.
.
CONCLUSION FOR YOU & THE MINERS –
1. I had mentioned cutting leverage at the last peak area, great gains were locked in…
2. I then even cut some of my miners, but held a basket on the pull back, I traded some miners, and I even added more miners recently as this DCL approached.
3. NEXT – If you have followed that pattern of trading this Intermediate Cycle, you can now decide to continue to hold that basket for ‘surprises that may come to the upside’? OR
4. If You didn’t like holding that basket through the drop in Miners, the next drop into an ICL should be deeper. You may lighten up if this bounce looks like a double top & just wait for an ICL to go all in again.
AGAIN, GDXJ AS A REMINDER: Before you take any new trades, just remember this chart. GDXJ & GDX reversals look great, but often move higher for short periods of time late in the intermediate cycle.
.
If you have time to look up a few charts, I found these interesting. You may want to look at them on a daily & even a weekly chart, like I have shown you above, they may be good for a trade…
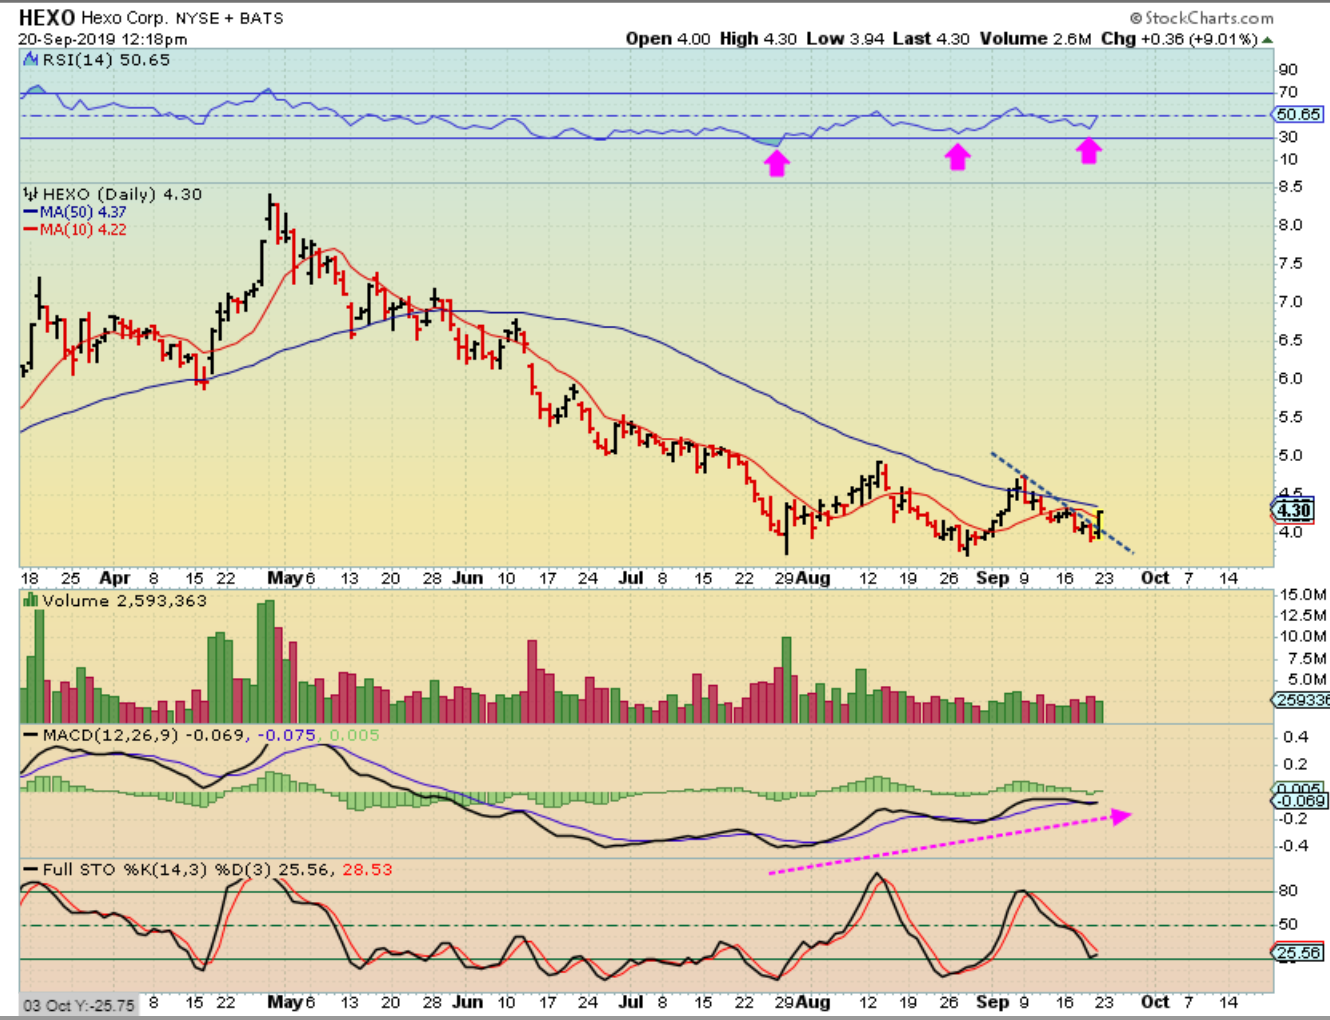
HEXO – I posted this chart Friday too. It could be a base bottom, so I bought it.
.
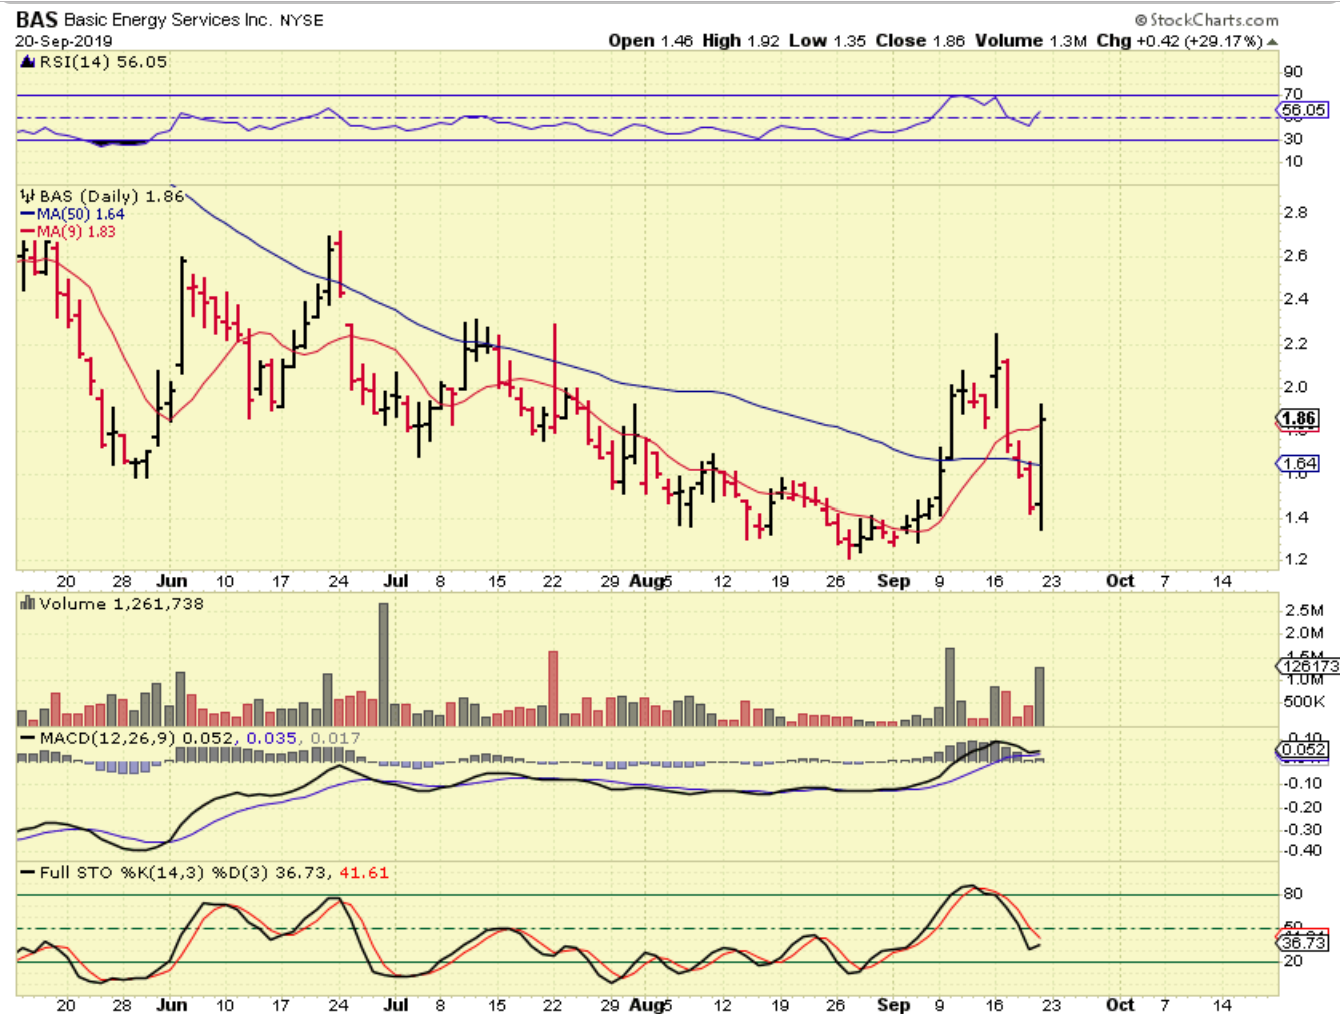
BAS- BAS shot up 30% into the close Friday, so maybe we’ll start seeing some surprises to the upside in this sector too? Time will tell.