
September 24th – Will They Be Able To Make It?
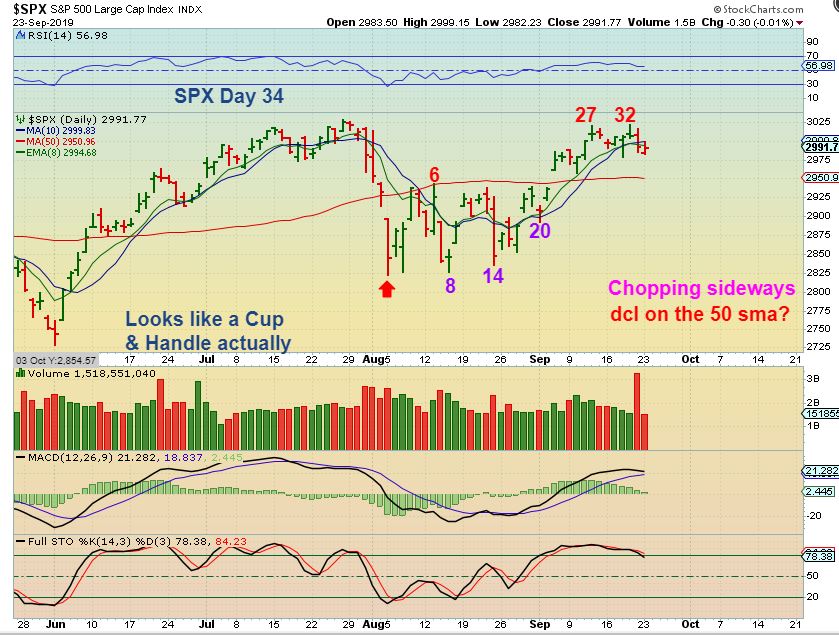
SPX #1 – The S&P looks like a cup & handle. This is a right translated daily cycle so it may just drop or drift to the 50sma as a dcl, and then head higher. It closed below the 10 sma so the decline into the dcl may have begun. Let me draw an example of what this could look like…
.
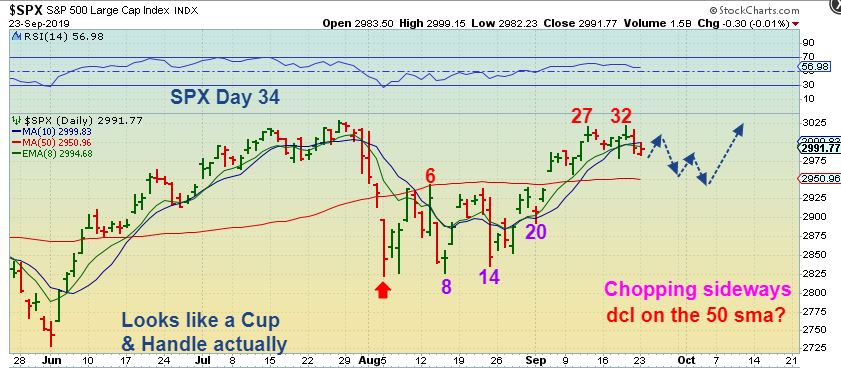
SPX #2 – I am not predicting a 1-2-3-4-5 here, I’m simply showing a choppy ending to this daily cycle that could tag the 50sma as 1 example. That could happen in days. Now let me show you a more bearish thought…
.
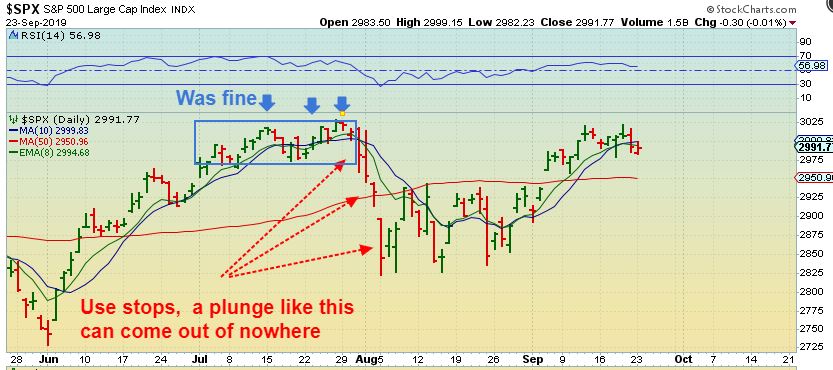
SPX #3 – Everything was sideways & choppy until the last 4 days of that last daily cycle. That was simply a 4 day plunge. If it happened then, it could happen again, so use stops.
.
What do I lean toward for my expectations? My feeling is that we are close to the end of this daily cycle, it looks like a cup & handle, it formed R.T., and I think we’ll probably get a DCL as a reversal off of the 50 sma . It is just important to me to understand possible dangers & use stops or even lighten up when heading into a dcl.
.
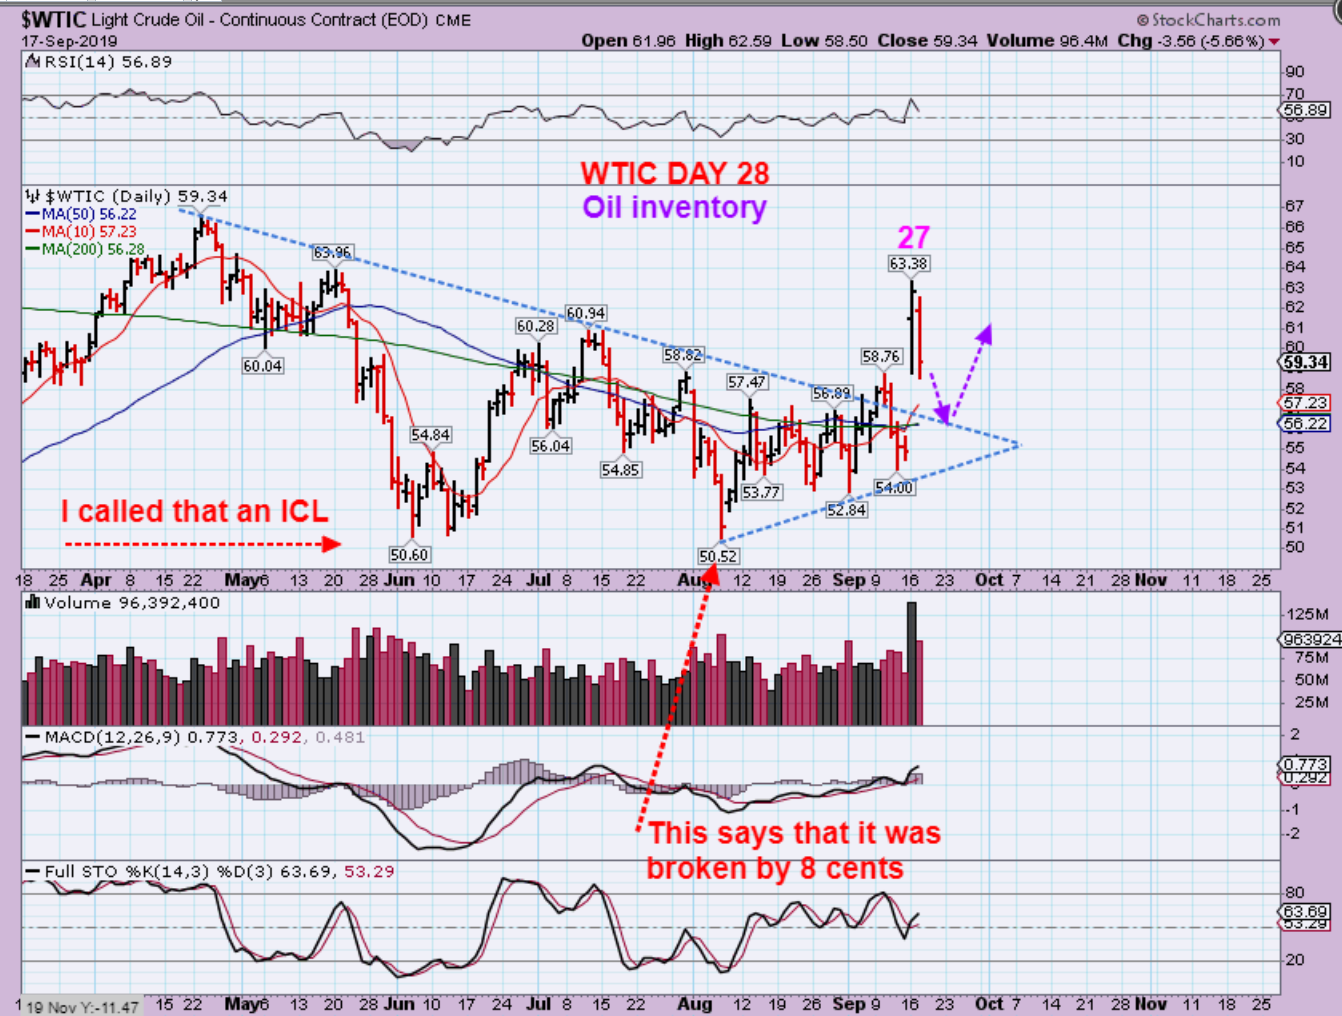
WTIC DAY 28 Last Week – With a strong news driven pop, and then the reversal, there are still bullish signs, so I pictured possibly a bounce after Wed Inventory report. Where are we 4 trading days later?…
.
WTIC DAY 32 – Chopping sideways. Oil dropped Monday & reversed higher. It sits above the 10sma & since Oil can have 40 -50 days in a daily cycle, this is still considered fine or healthy. This Wednesdays oil inventory report MIGHT reflect a drop in inventories, and Oil should then continue higher if this is not ready for the dcl. 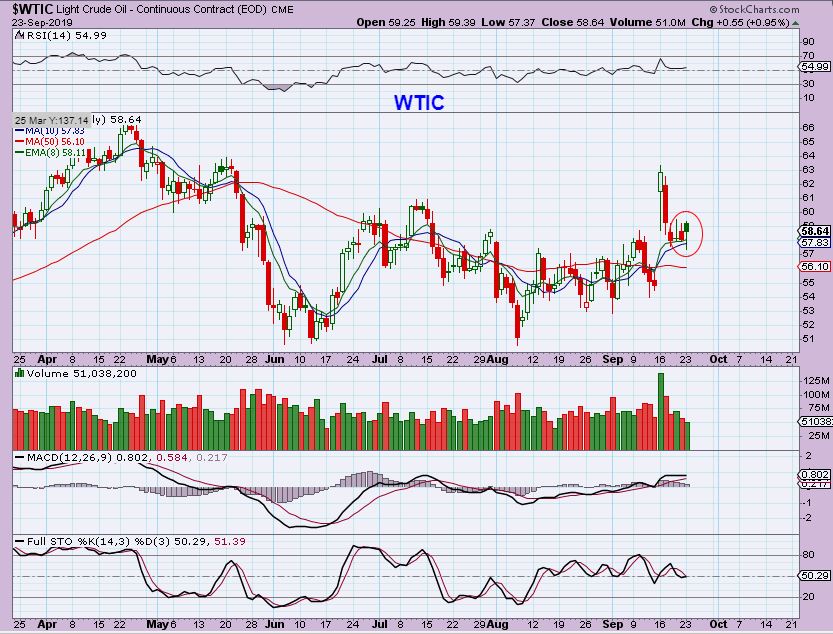
I will discuss oil / Energy Stocks a bit more at the end of the report.
.
Gold, Silver, & Miners:
The question is, How High Can They Climb?
Answer: We Just Don’t Know Yet.

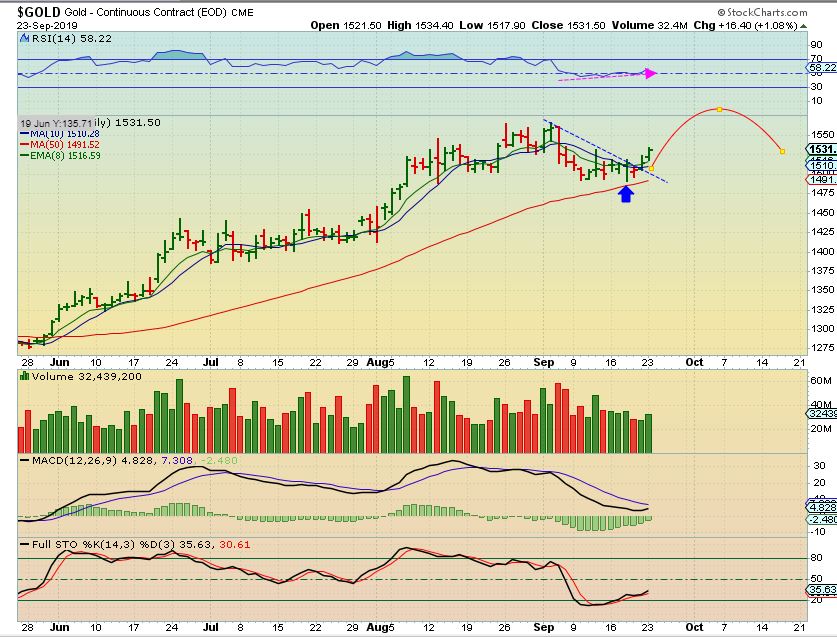
GOLD – Gold stayed stronger than miners, since it did not lose the 50 sma. It broke above the down trend line & the 10 sma on Friday, and Monday we got some follow through. The last Daily Cycle was right translated, so I have drawn the possibility that this makes a slightly new high & rolls over as L.T.
.
GOLD – I stared at this chart Monday night and I thought to myself, ” There is actually nothing wrong with this chart. The Miners broke down below their 50 sma, but Gold is still acting bullishly.” We’ll see if it can get above the prior highs.
.
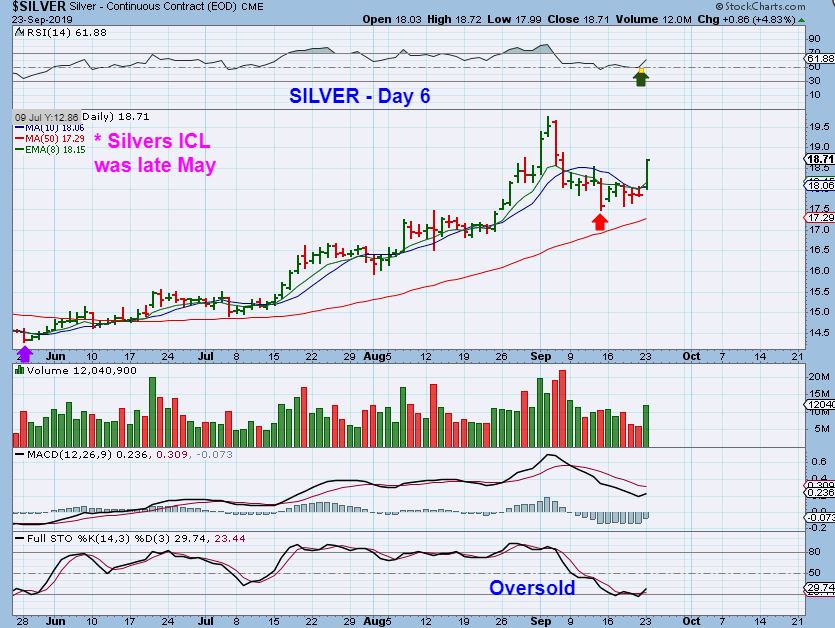
SILVER – On day 6 Silver popped almost 5%. That is Impressive this late in an Intermediate Cycle, but remember that the ICL for Silver was later than Gold, only 3.5 months ago. Can Silver move above prior highs? It sure looks like it could, based on Mondays move and how oversold Silver is.
.
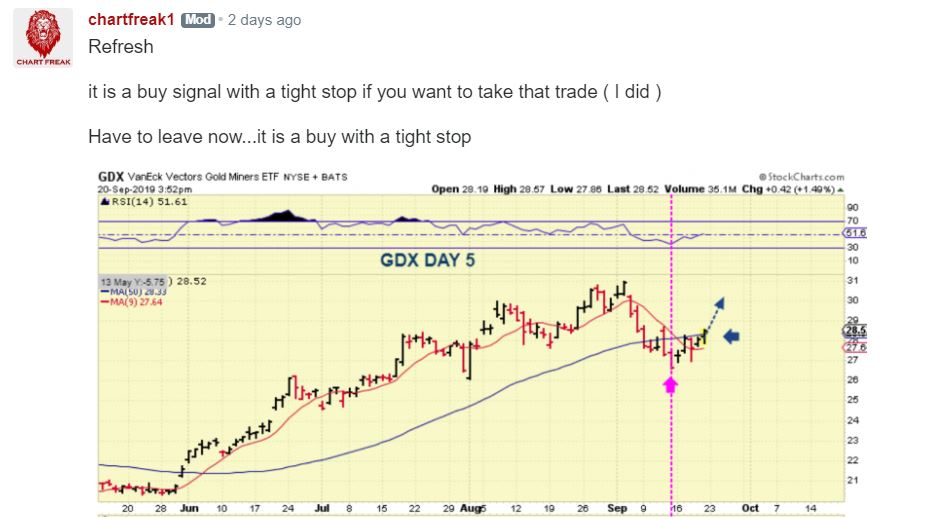
MINERS: THIS IS WHAT I SAW ON FRIDAY – Suddenly Miners began to rise with Gold and GDX pushed through that 50 sma. I was writing in the live comments area that this move looked good and is a short term buy. This is a day 5 push higher. This is what I posted…
.
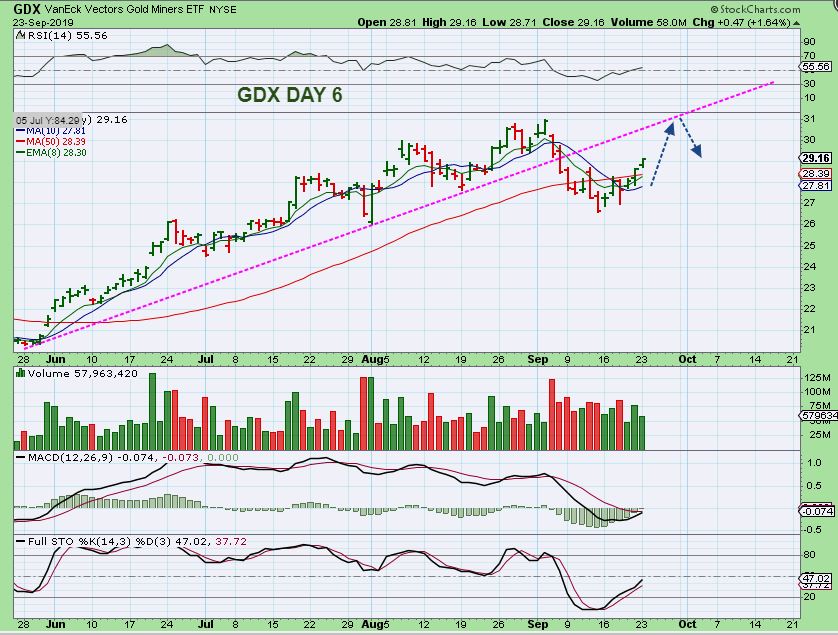
GDX – Day 6 saw the move follow though even further. GDX is still closer to oversold, and even though it can start to weaken & roll over at any time as L.T., It can also climb & back test that trend line break. It may Double top & become L.T. , it may break out & then Roll over as L.T., it may weaken at any time. Gold & Silver do look good above their 50 sma , so I would imagine that Miners can go along for the ride if they climb higher.
.
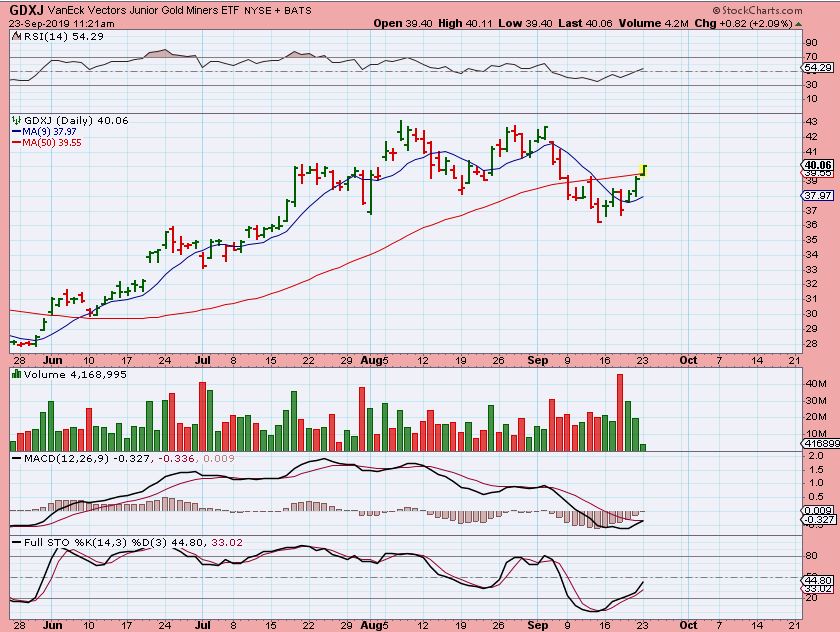
GDXJ – Closing over the 10sma & above it’s downtrend line was also a buy Thursday, but GDXJ still closed under the 50sma & looked weaker. Monday it also moved through it’s 50 sma. Many Silver Miners looked good Monday.
.
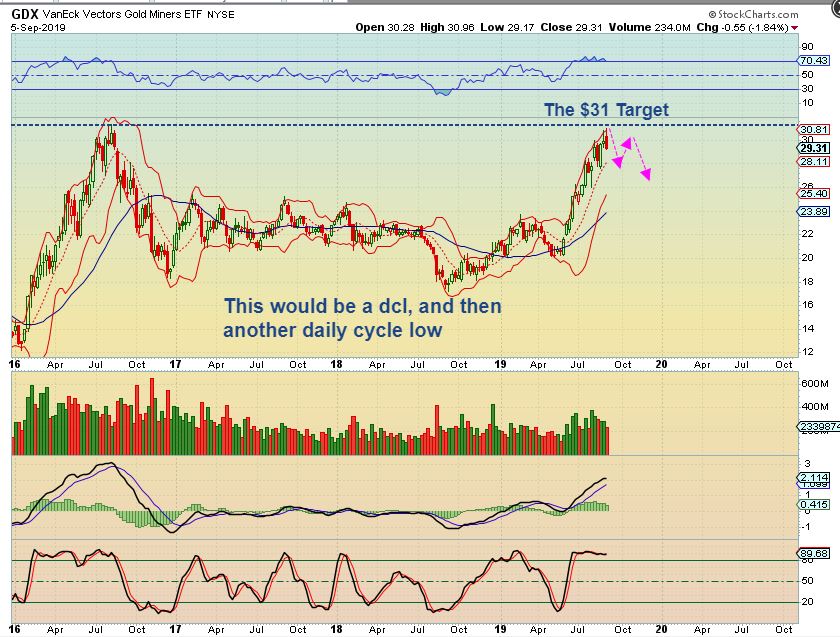
GDX – I drew this a-b-c type drop possibility on Sept 5, expecting a drop to a dcl , then a bounce. We now have the drop, we now have the bounce taking place. From here, we just have to take it step by step looking for strength or weakness. There still should be a drop into an ICL in the future.
.
The hard part about the current set up in Miners is the ‘lateness’ in the Intermediate Cycle as a whole. Gold bottomed in early May, so we are almost 5 months from those lows. Silver bottomed at the end of May, so it is almost 4 months old. It is not common to expect a strong rally this late in an intermediate cycle, especially since the Miners had a bigger correction than the metals, but you just have to cautiously play what the market presents and hope for good results, or wait for the next ICL. Some are even scalping day trades, Taking the trade early & selling any pop just to lock in gains, but again, that is not for everyone.
.
When you take positions in Miners or Energy at this point, they are trade-able set ups using technical analysis, but they have to be considered a bit less reliable or less strong due to the age of the Intermediate Cycle. Buying near an ICL is safer once the run higher starts, because those lows aren’t broken for months and time is on your side. That said, each individual can decide whether to trade the set ups or not. At this point you want to Stay Frosty and use stops. I can discuss this a bit more below.
.
For now, enjoy your Tuesday trading.
.
~ALEX
.
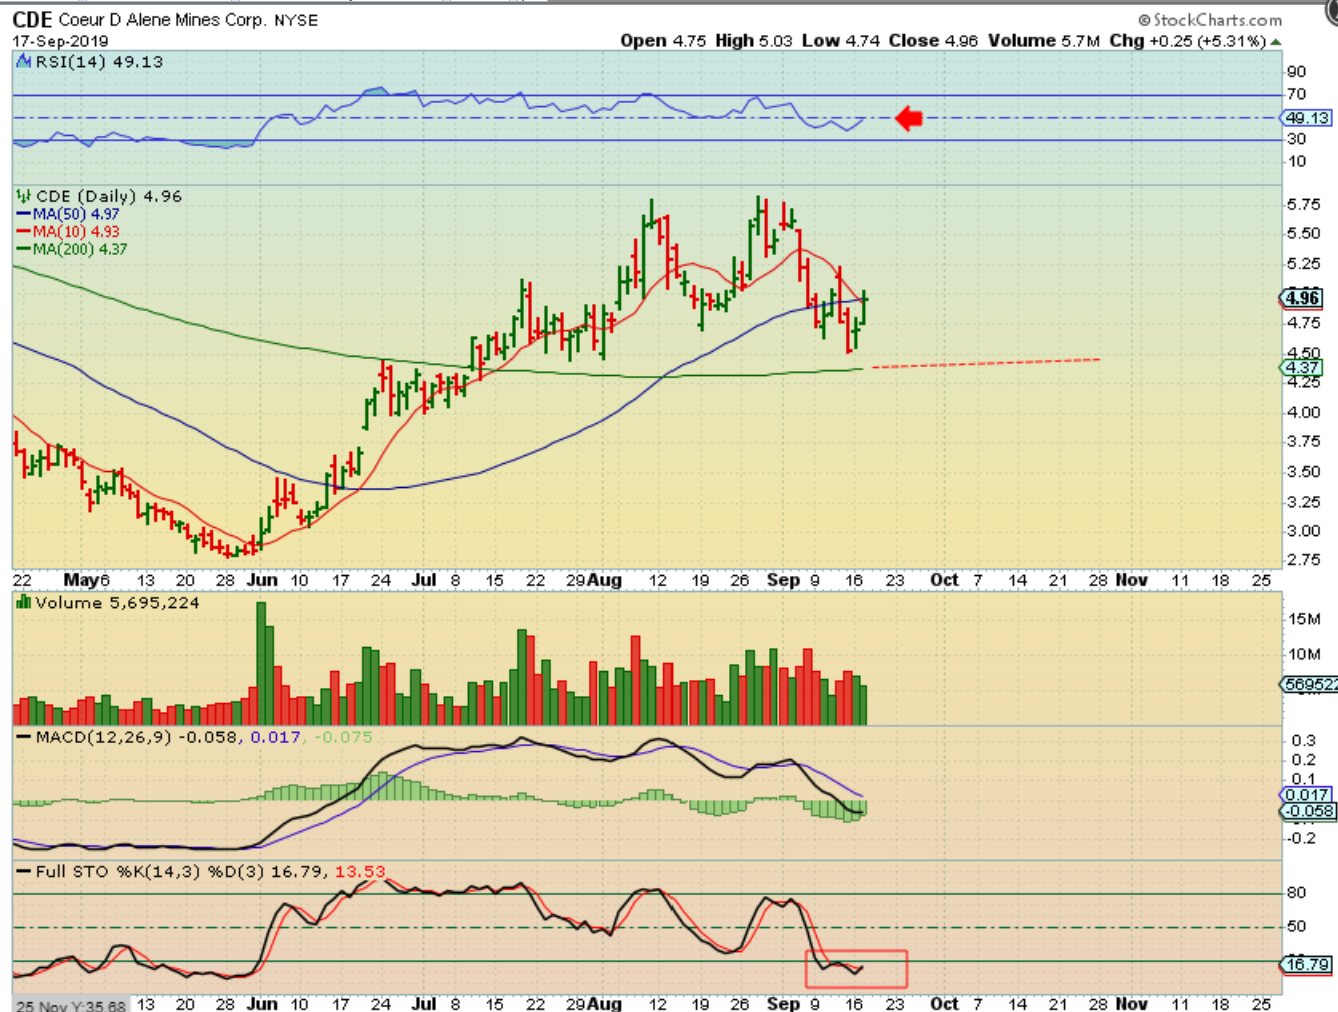
CDE SEPT 17 – I mentioned that I added to CDE & went full position again as it broke above the 10 & 50 sma knowing that a stop could be placed below the 200sma.
.
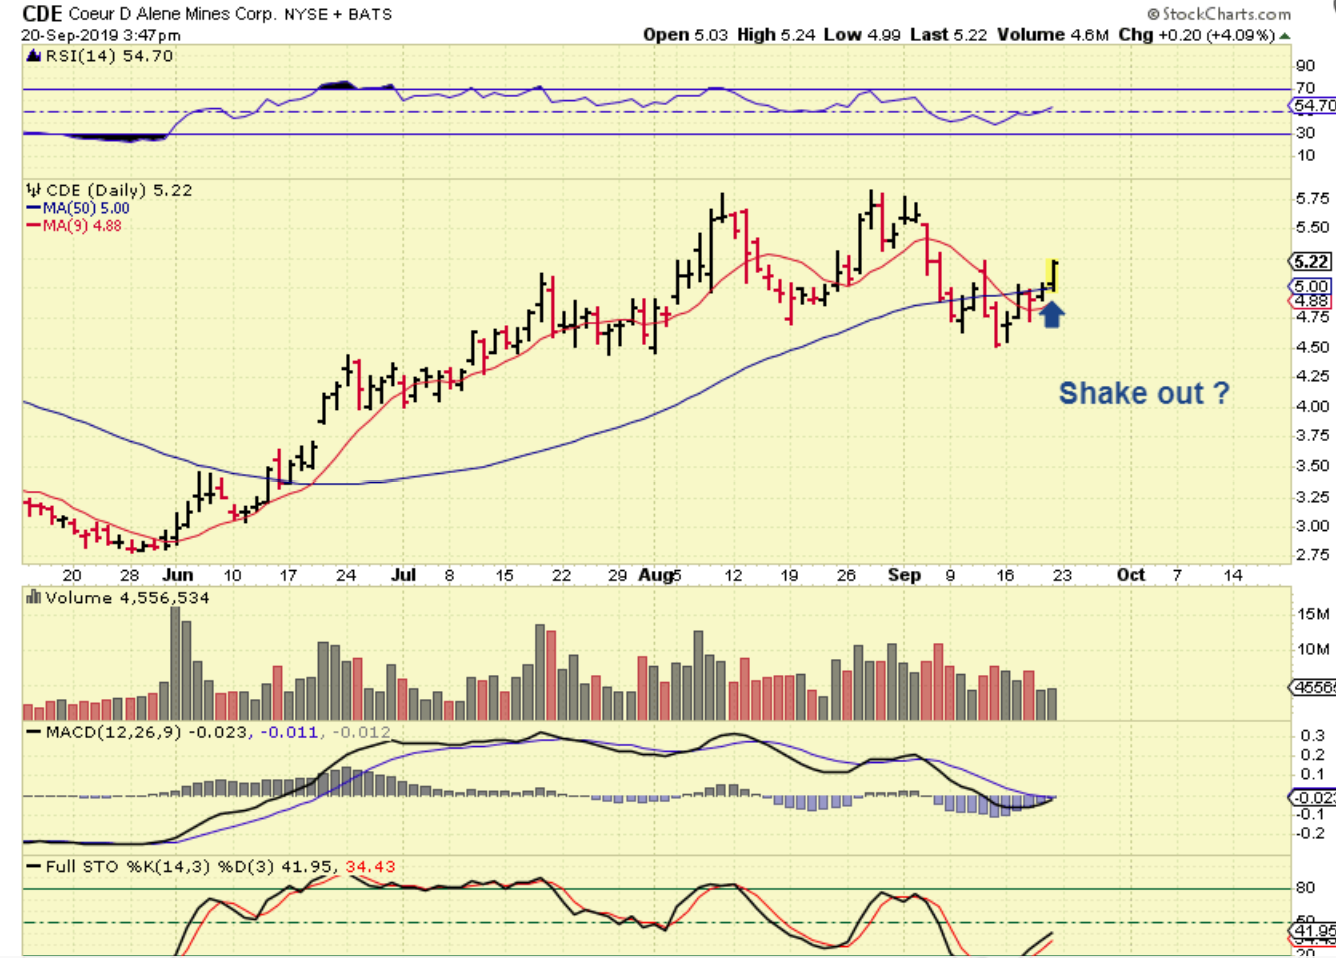
CDE -CDE closed above the 50 sma on Sept 19 and here on Sept 20 it got the follow through hoped for from that set up. I mentioned that even just a quick run to prior highs in some of these could lead to 20-30% gains.
.
CDE – Monday it continued higher, here up 4%when I posted it in the live trading area.

.
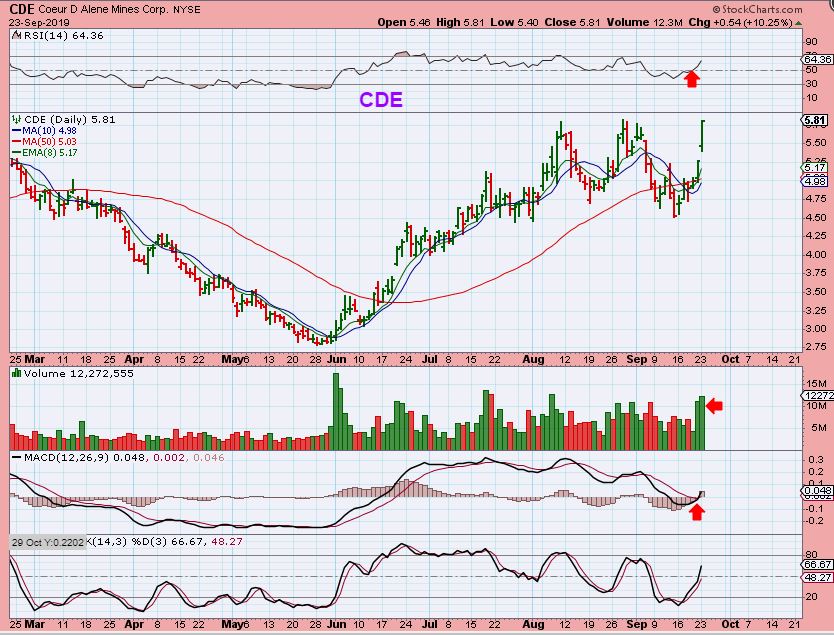
CDE – Up 10% on Monday alone, CDE is already at former highs. You can see that some of these set ups using a ‘Technical Analysis Set Up’ can play out nice & quickly. Many Silver stocks responded Monday.
.
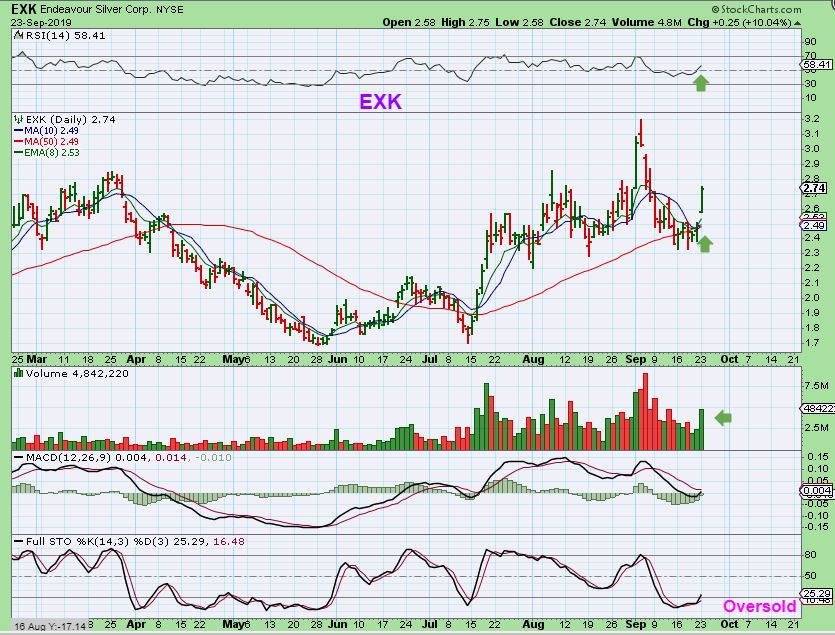
EXK – The set up is similar here and EXK was up 10%. This is still oversold and a run to former highs from the 50 sma is also 25% gains. EXK is still quite oversold so I actually added to EXK yesterday. It is VERY hard to do that confidently when we should be expecting a L.T. daily cycle, but I take the set ups a step at a time. Let me show you something else…
.
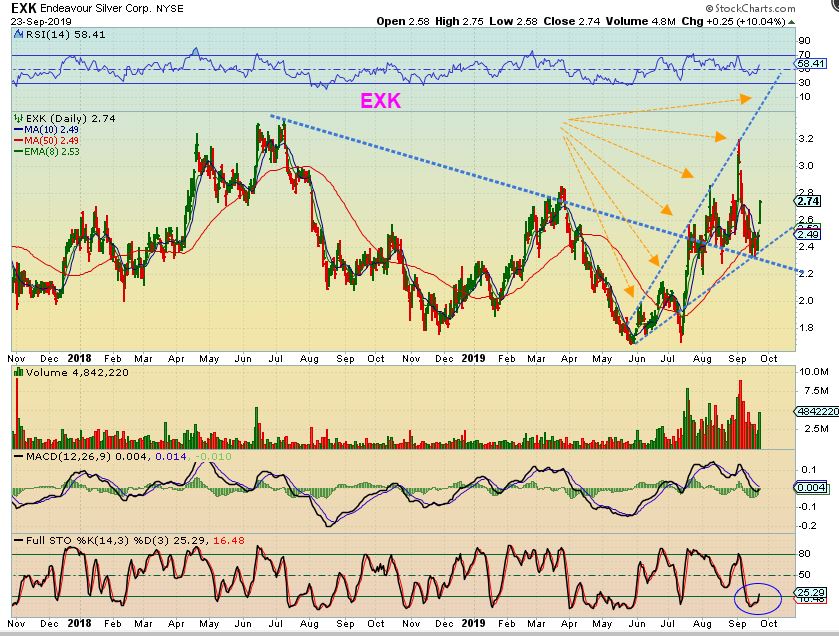
EXK – If EXK can put in a run & peak similar to the last runs, it could run to $3.40. If Silver becomes L.T., it probably won’t, but this is how I viewed EXK without cycles in mind, so I took the trade as a bullish oversold set up for now.
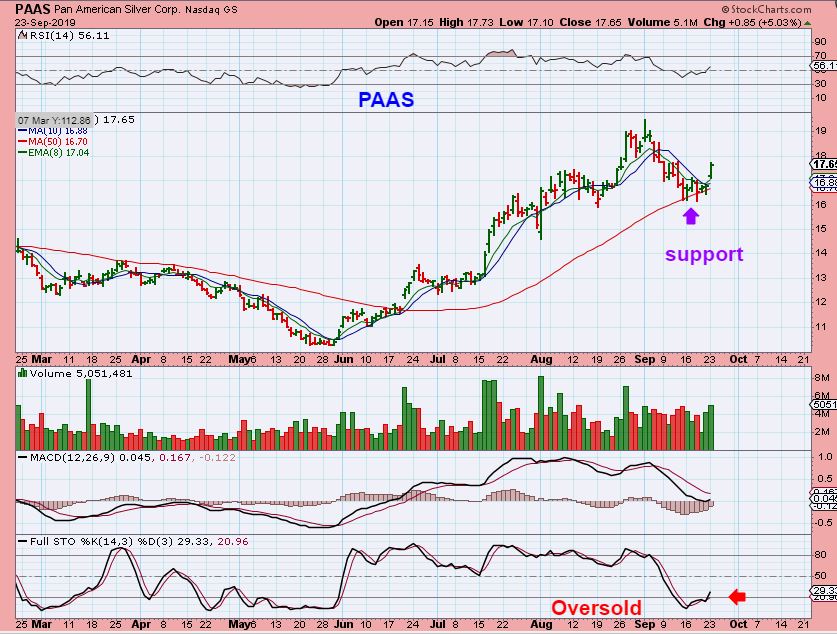
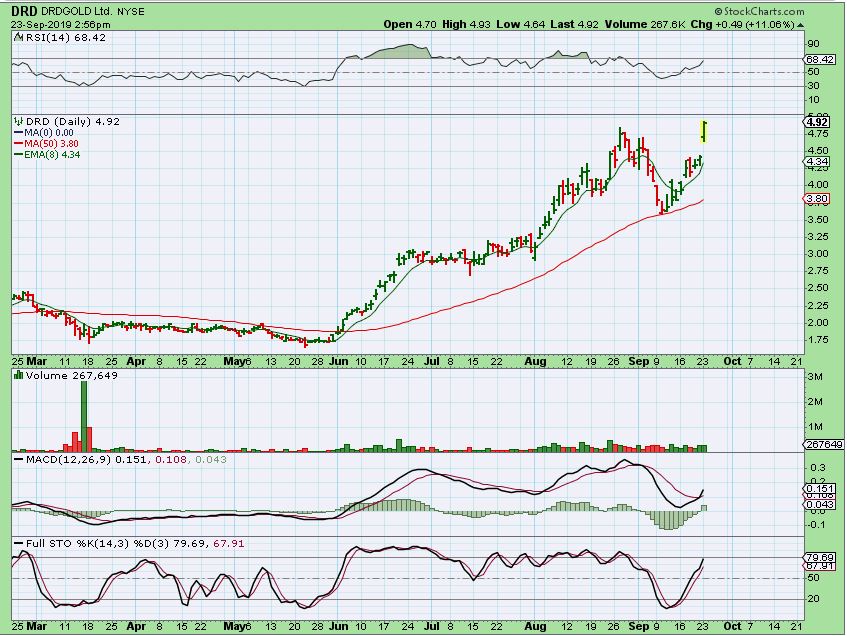
PAAS – Another Silver stock finding support at the 50sma was Paas. It too is oversold. Do you remember the DRD ( & HMY ) Trade set up? It was to buy at the 50sma and let it ride, hopefully reaching former highs…
DRD – Well, after holding support on the 50sma, DRD broke to new Intermediate Highs!
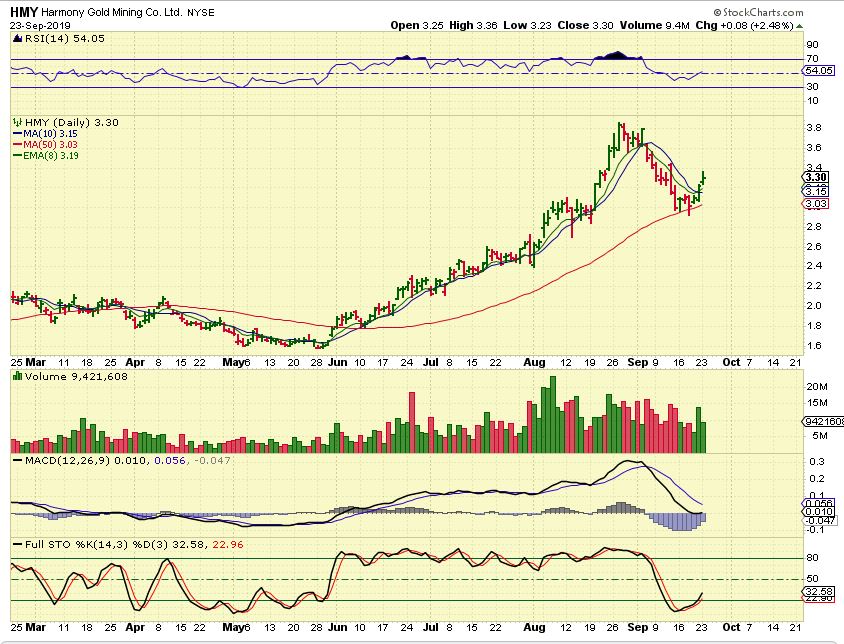
HMY – So I have pointed out that I bought HMY at the 50sma with a stop, since DRD was reacting bullishly.
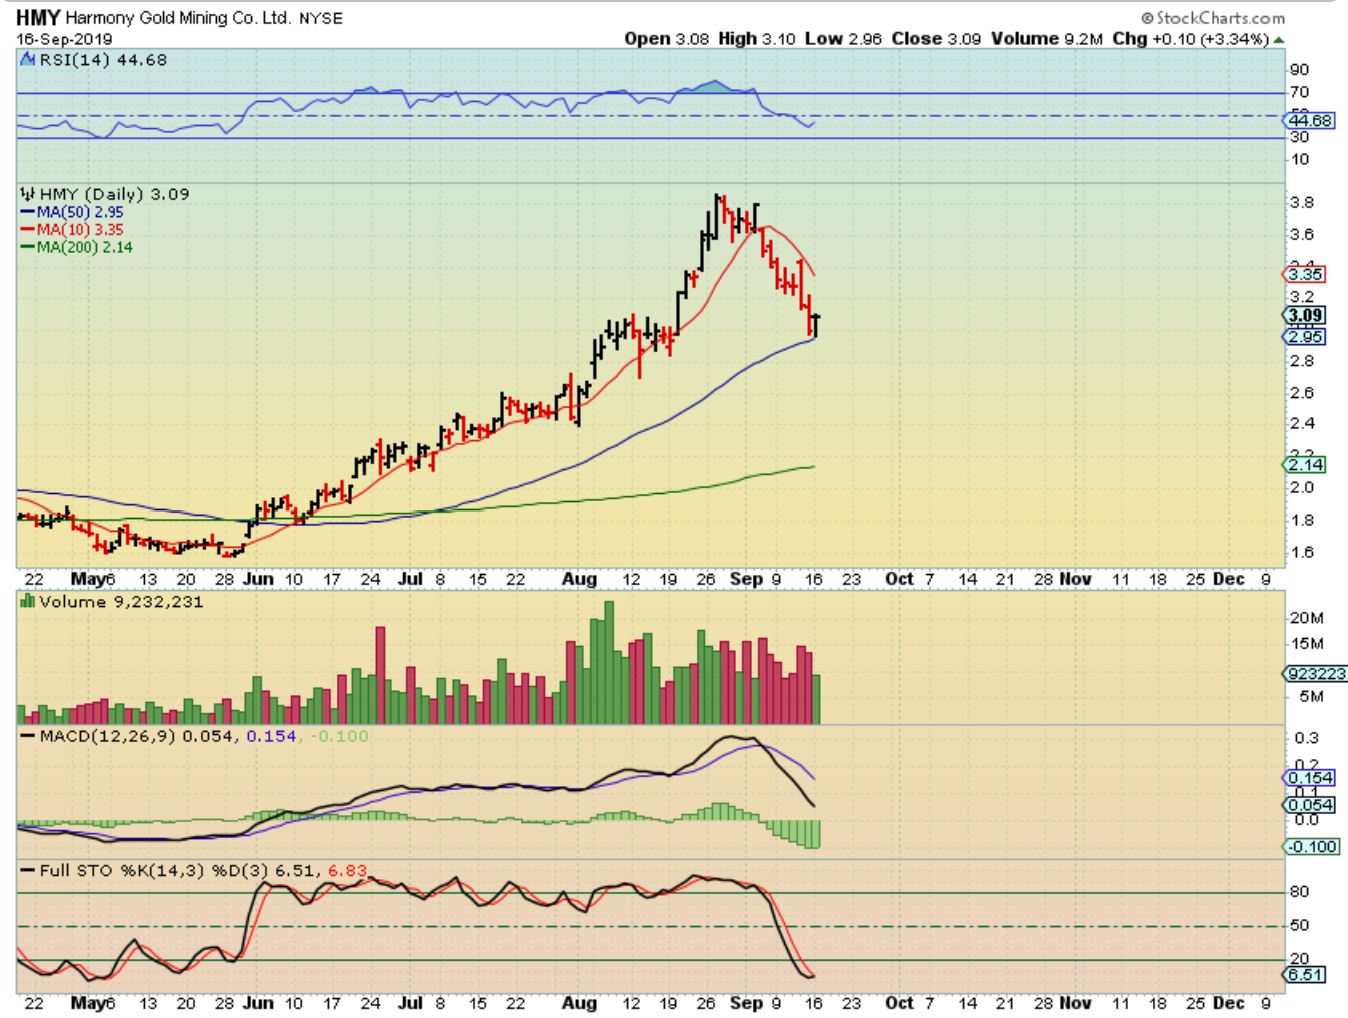
HMY has slow progress, but I am still hoping for the same results that DRD is seeing. It is still overbought too. EGO, RGLD, and AU have similar set ups .
So I want just to repeat what I’ve seen in Left Translated Daily Cycles. I have seen weaker ones Top on day 5, chop sideways, and sell off. I have also seen some stronger ones top on day 12-16 ( 3 trading weeks after the dcl) and become left translated when the daily cycle low comes on day 35. This is why I am taking trades, and the hardest part will be selling & keeping those gains before the music stops. I take it day by day, step by step, looking for signs of strength or weakness along the way. It can change very quickly, but so far Silver was a good sign of strength.
.
OIL / ENERGY – Another difficult sector to trade right now. Many of us actually got in near the very lows before the Saudi oil Refinery bombing, so we still have solid gains after the Pop & Pull back. I am waiting to see if we get follow through now or will these continue basing?
.
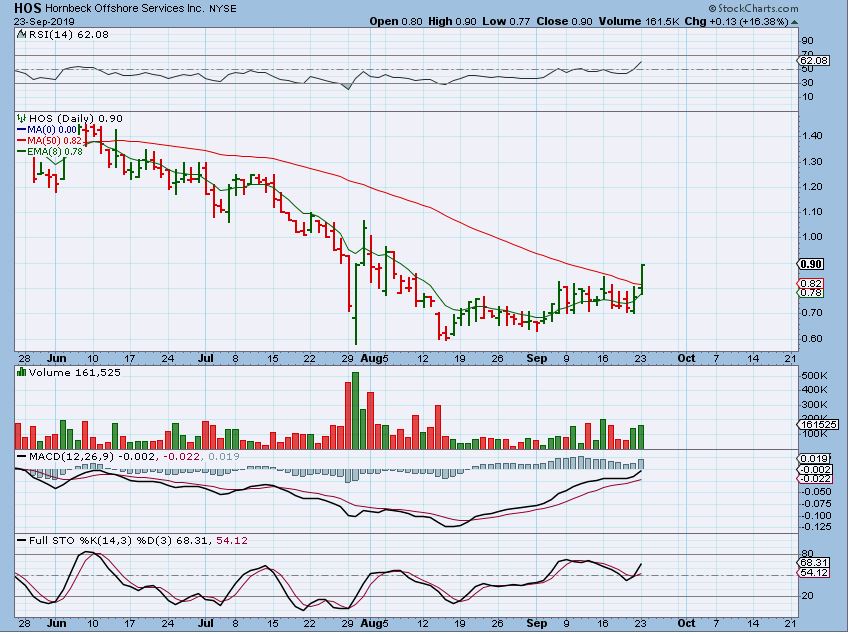
HOS – BAS popped Friday and HOS, NOG, and a few others popped yesterday, so that could be a good sign.
.
Let me show you something that I am watching on many of these stocks…
.
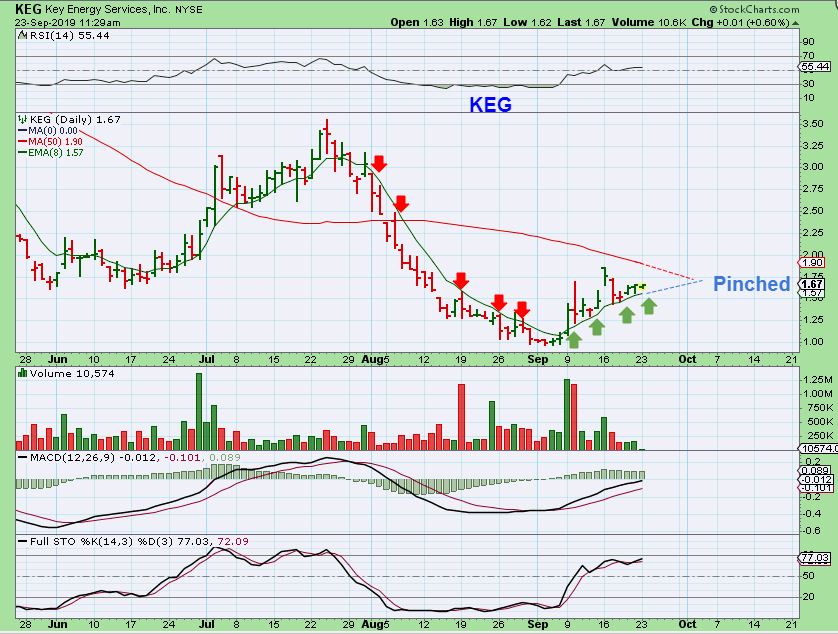
KEG – I use the 8 ema & 9 sma on these to see if they were capped by it in the sell off, and have they recovered it now. Is it acting as support? So far a few are actually pinched between that 9 sma & 50 sma. This may be bottoming.
.
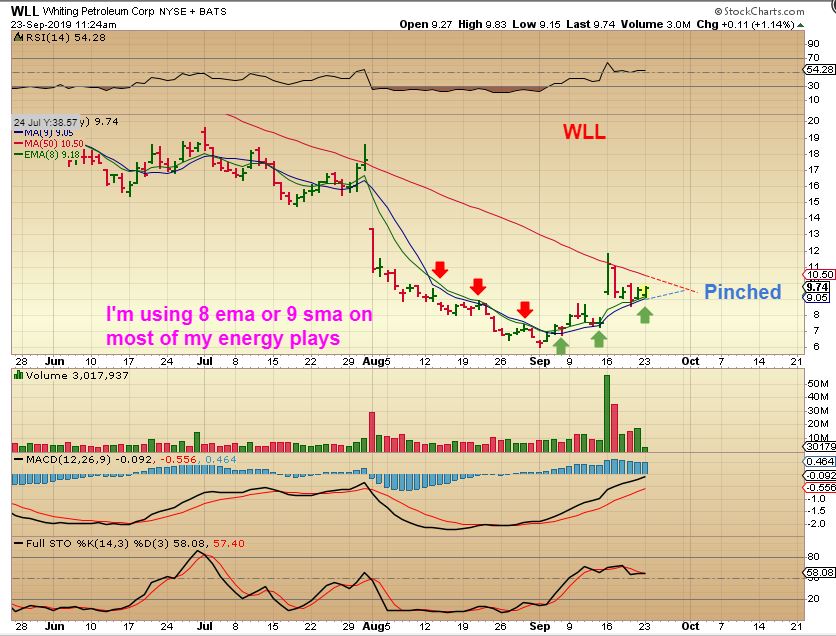
WLL – Again, I use the 8 ema & 9 sma on these and see if it is acting as support. It does not have to to remain bullish, but it seems to be more bullish if it does.
.
NOG – NOG Popped Monday, but notice also that NOG did not hold above the 9 sma regularly, it moved above the 50 sma & followed a trend line rather nicely though.
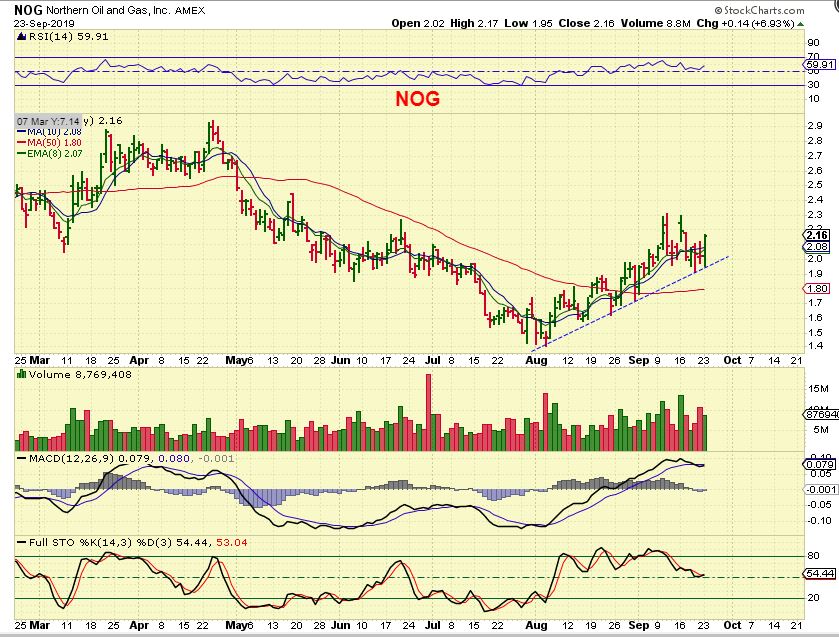
So many of the Oil / Energy Stocks still look good in this way. OAS, VOC, LPI, etc have been mentioned, and PLUG, BLDP, CLNE, GEVO , etc have been leaders as a cleaner energy play.

