Thursday September 5th – Surprises Upside
.
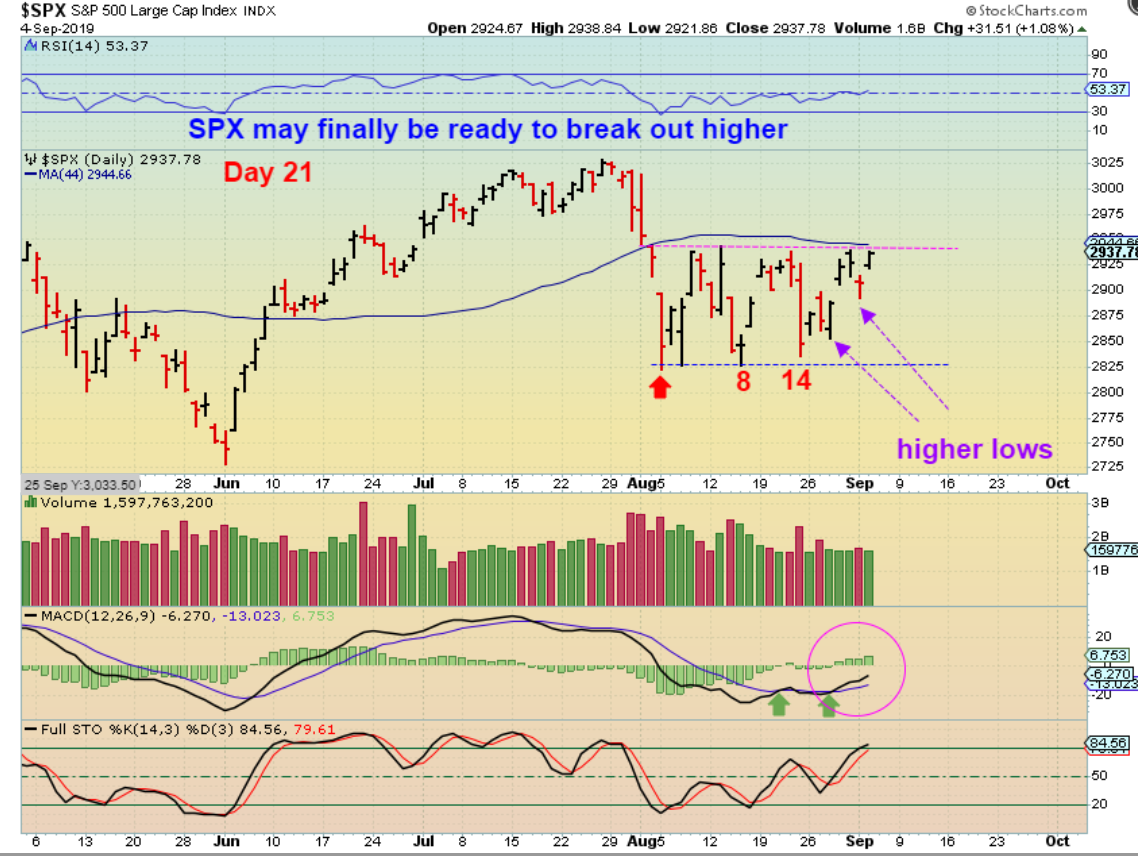
SPX – The MACD is bullish and we are no longer dropping to the bottom of the trading range, so with mini-higher lows, this could be preparing to break out. As day 21, I’m not sure how high this run would be able to go before a dip into a DCL would come due. ( Fed Mtg?).
.
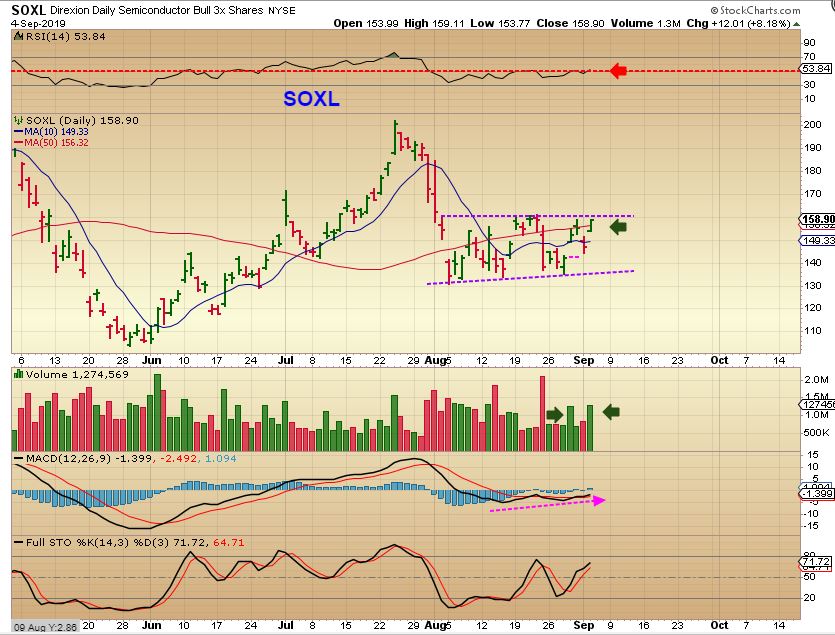
SOX – With the volume increasing on the upside push, the SOX ( SOXL used for volume) may be leading the way, after dropping to a gap fill Tuesday and breaking above that 50sma Wednesday.
.
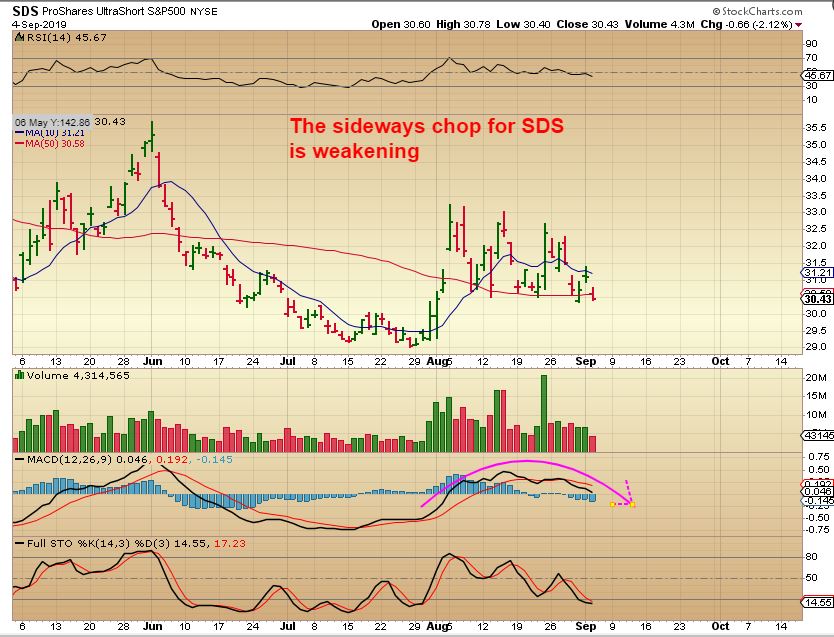
SDS – Also we have the inverse S&P 500 , an it looks like the sideways consolidation here is weakening. This could double bottom and the SPX could double top.
.
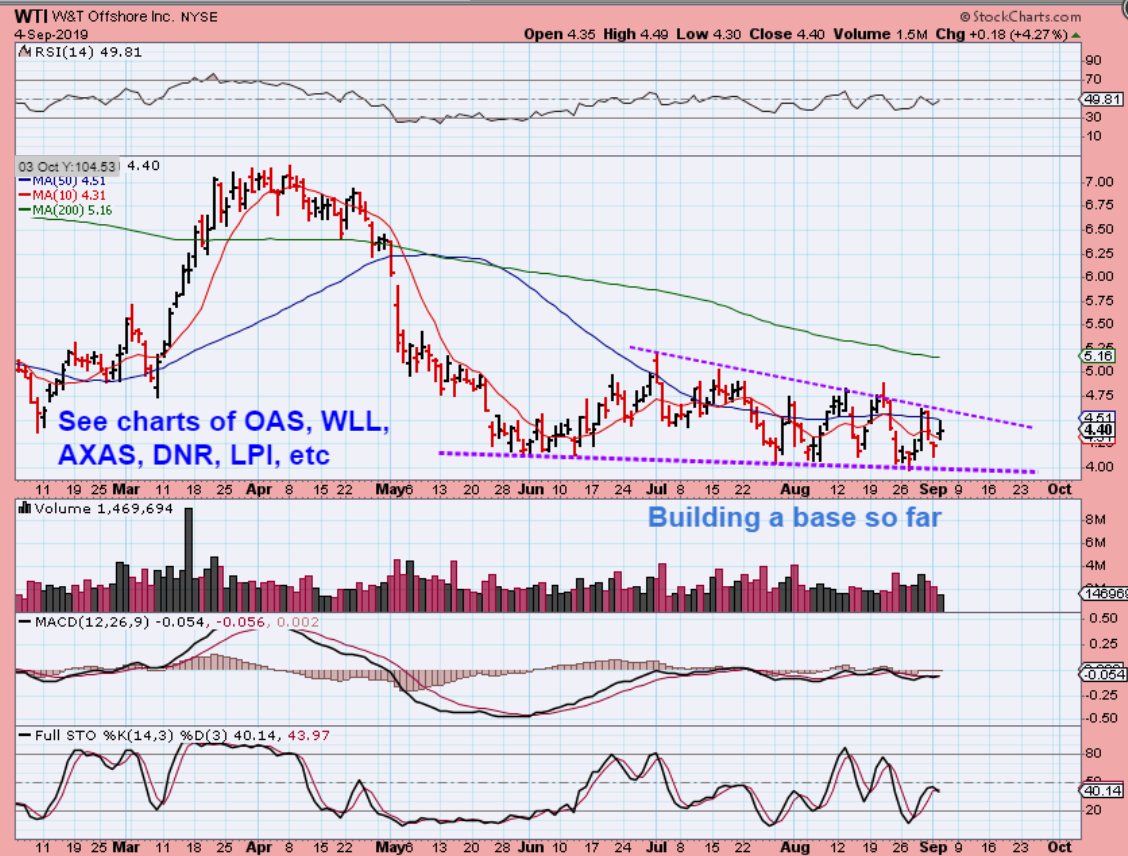
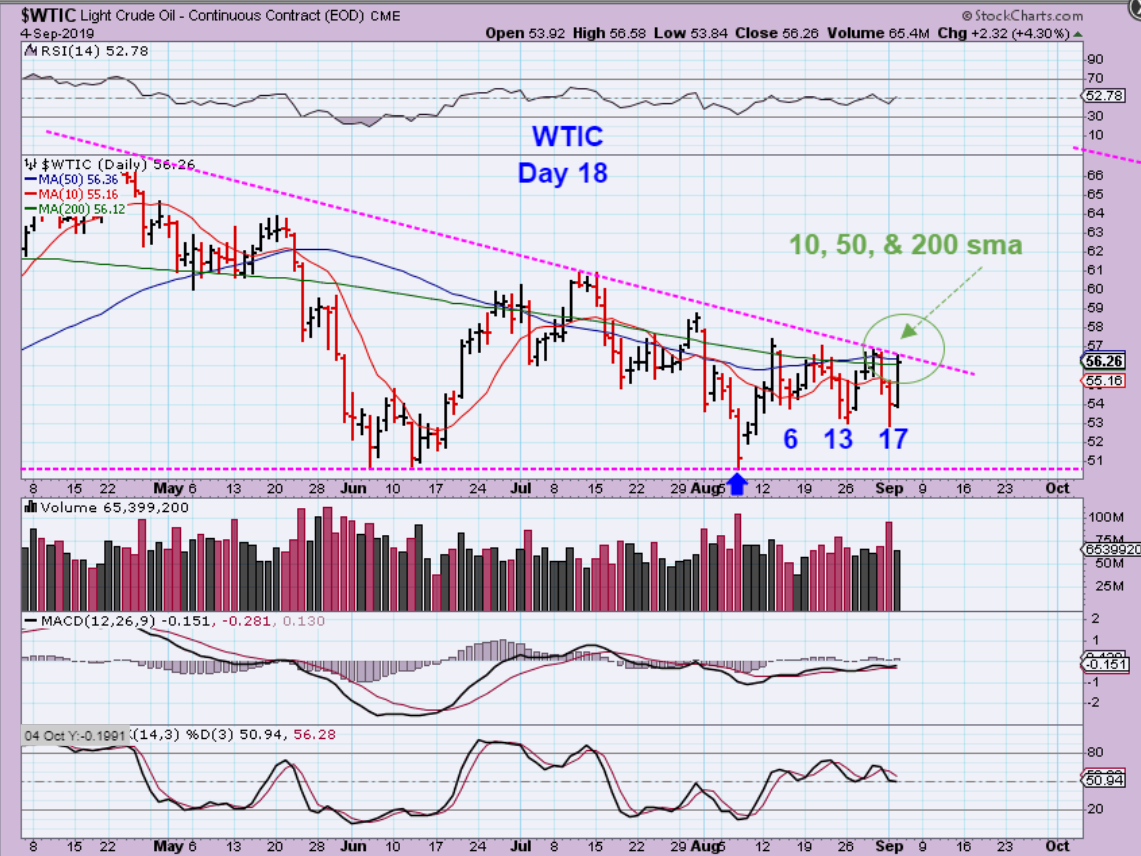
WTIC – Here we are again with Oil pushing to break out above key resistance(s). Monday was a holiday, so they usually release the Oil inventory report on Thursday of that week. That report may help or hinder Oil at this resistance again. A break out could run nicely after a long 3 month consolidation / base like this. Oil can have 40-50 day daily cycles.
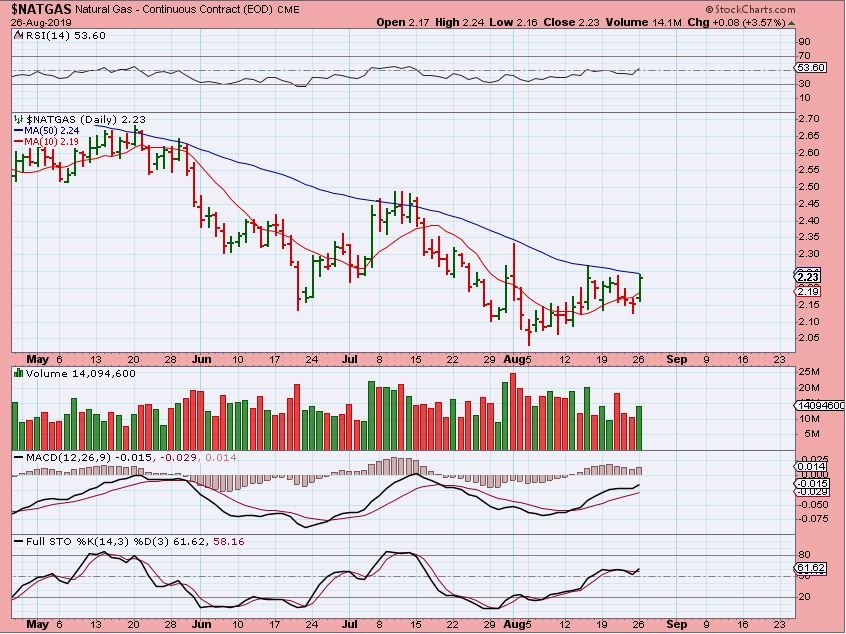
NATGAS – On AUG 26, This was my chart of NATGAS pushing against the 50sma. A break out would also be a buy here…
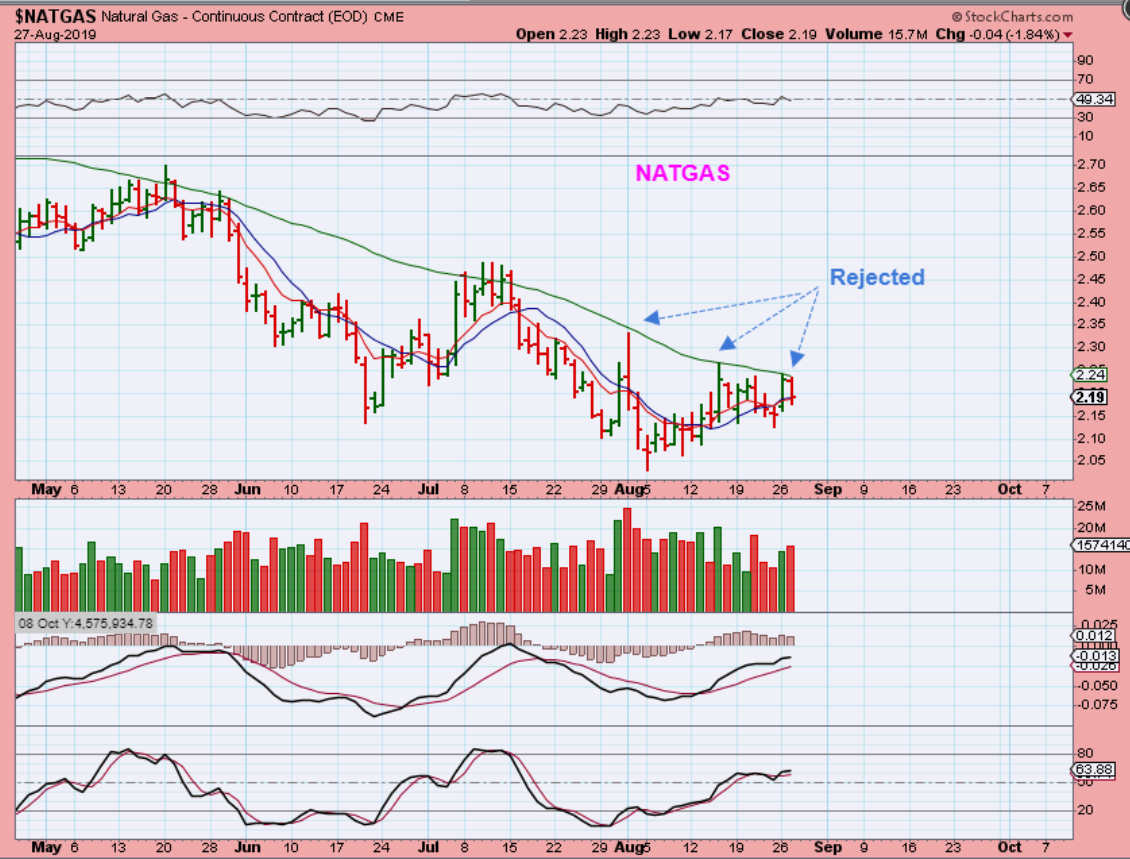
NATGAS – It was then rejected again on Aug 27th, much like we are seeing with Oil.
.
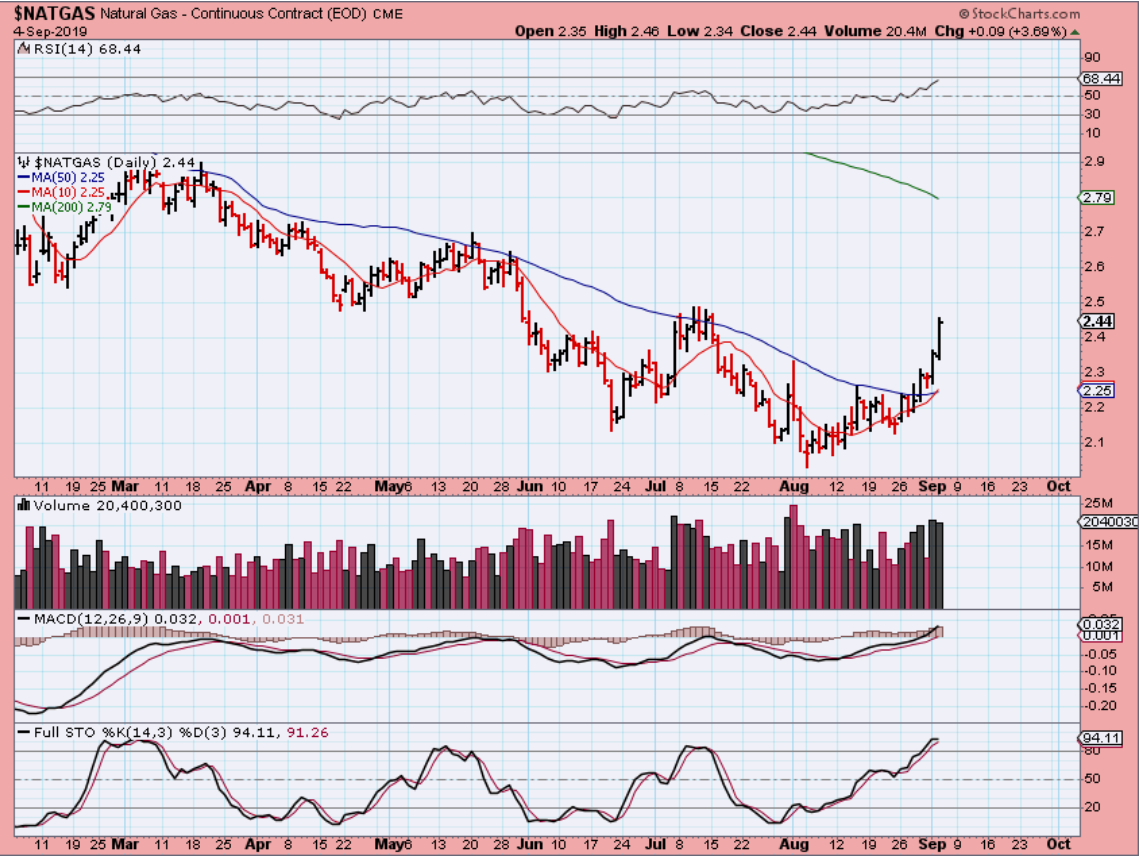
NATGAS – Soon it broke out & has been running since. I am also showing you this so that you see how OIL may break out through the 50sma, and then it could run higher also.
.
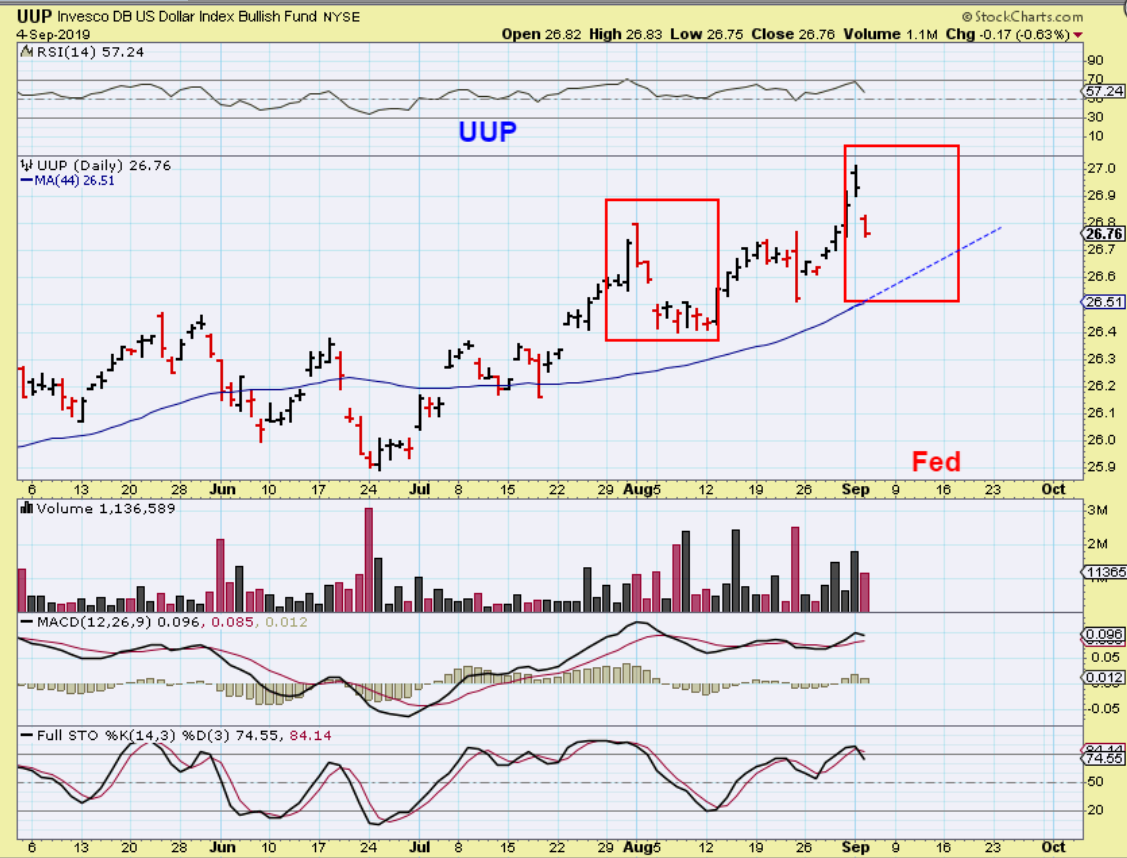
UUP ( for the USD) – The USD had that topping reversal candle Tuesday and dropped Wednesday…
.
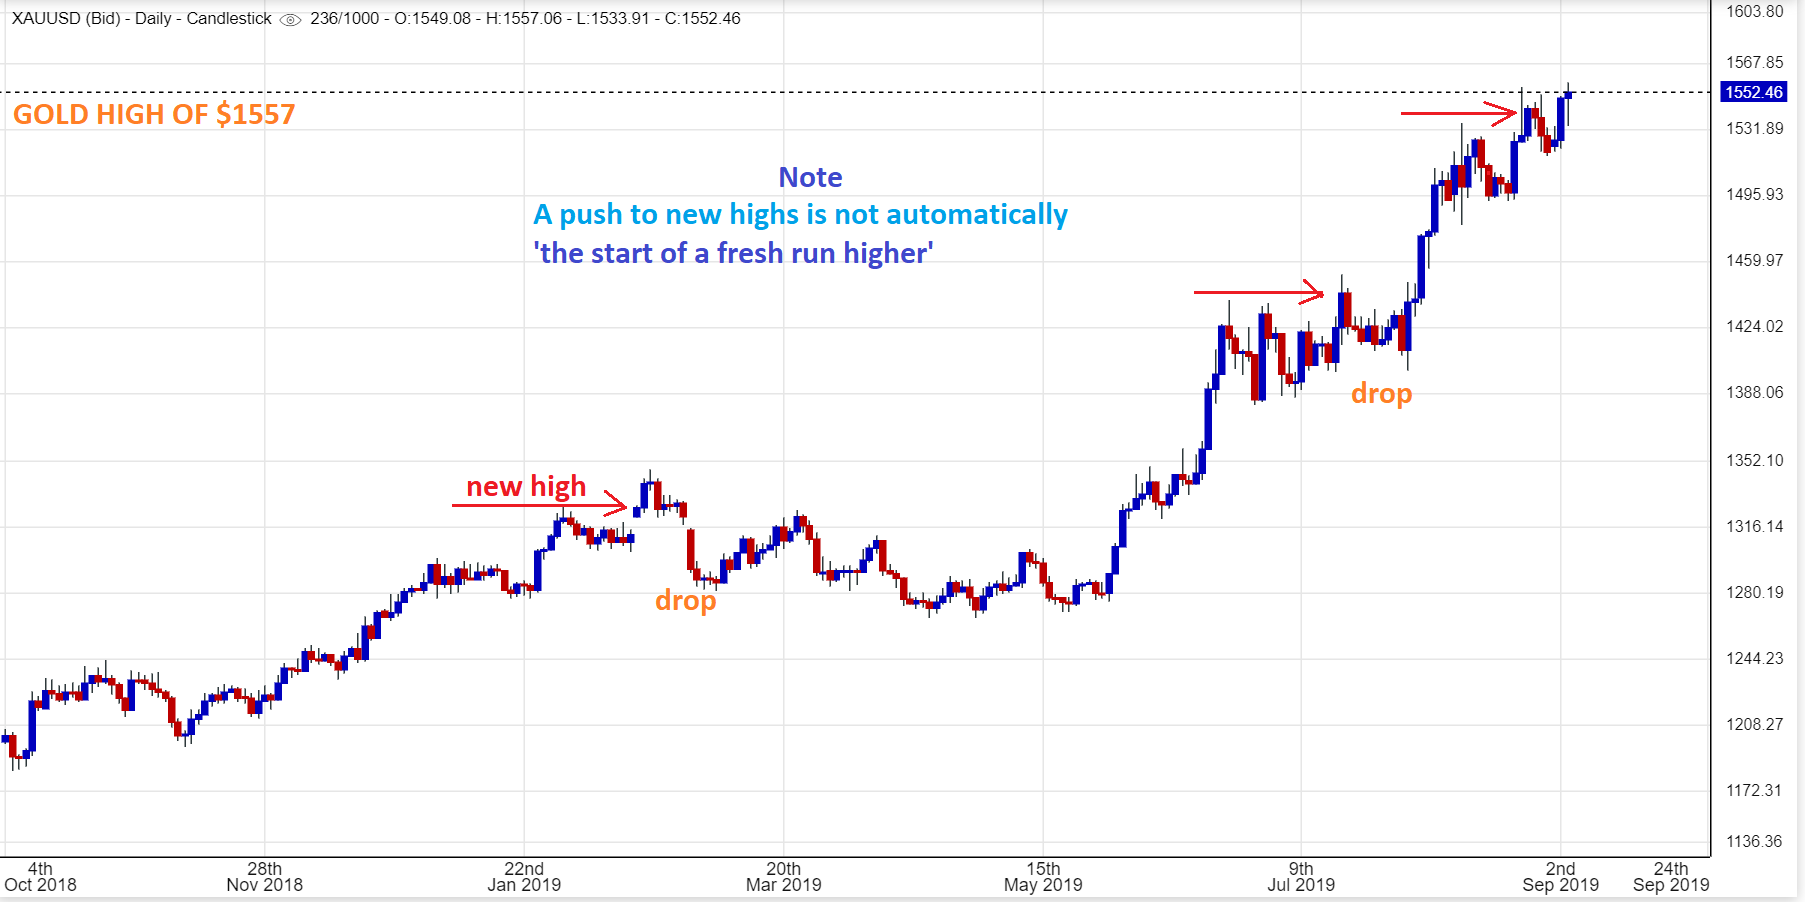
GOLD #1 – So Gold & Silver pushed a bit higher to new highs on Wednesday. I know that that is exciting, and this COULD keep climbing, but I am just pointing out here that a push to new highs does not automatically mean that it will just keep going. In the past, we’ve seen New Highs Pop & Drops. See the chart…
.
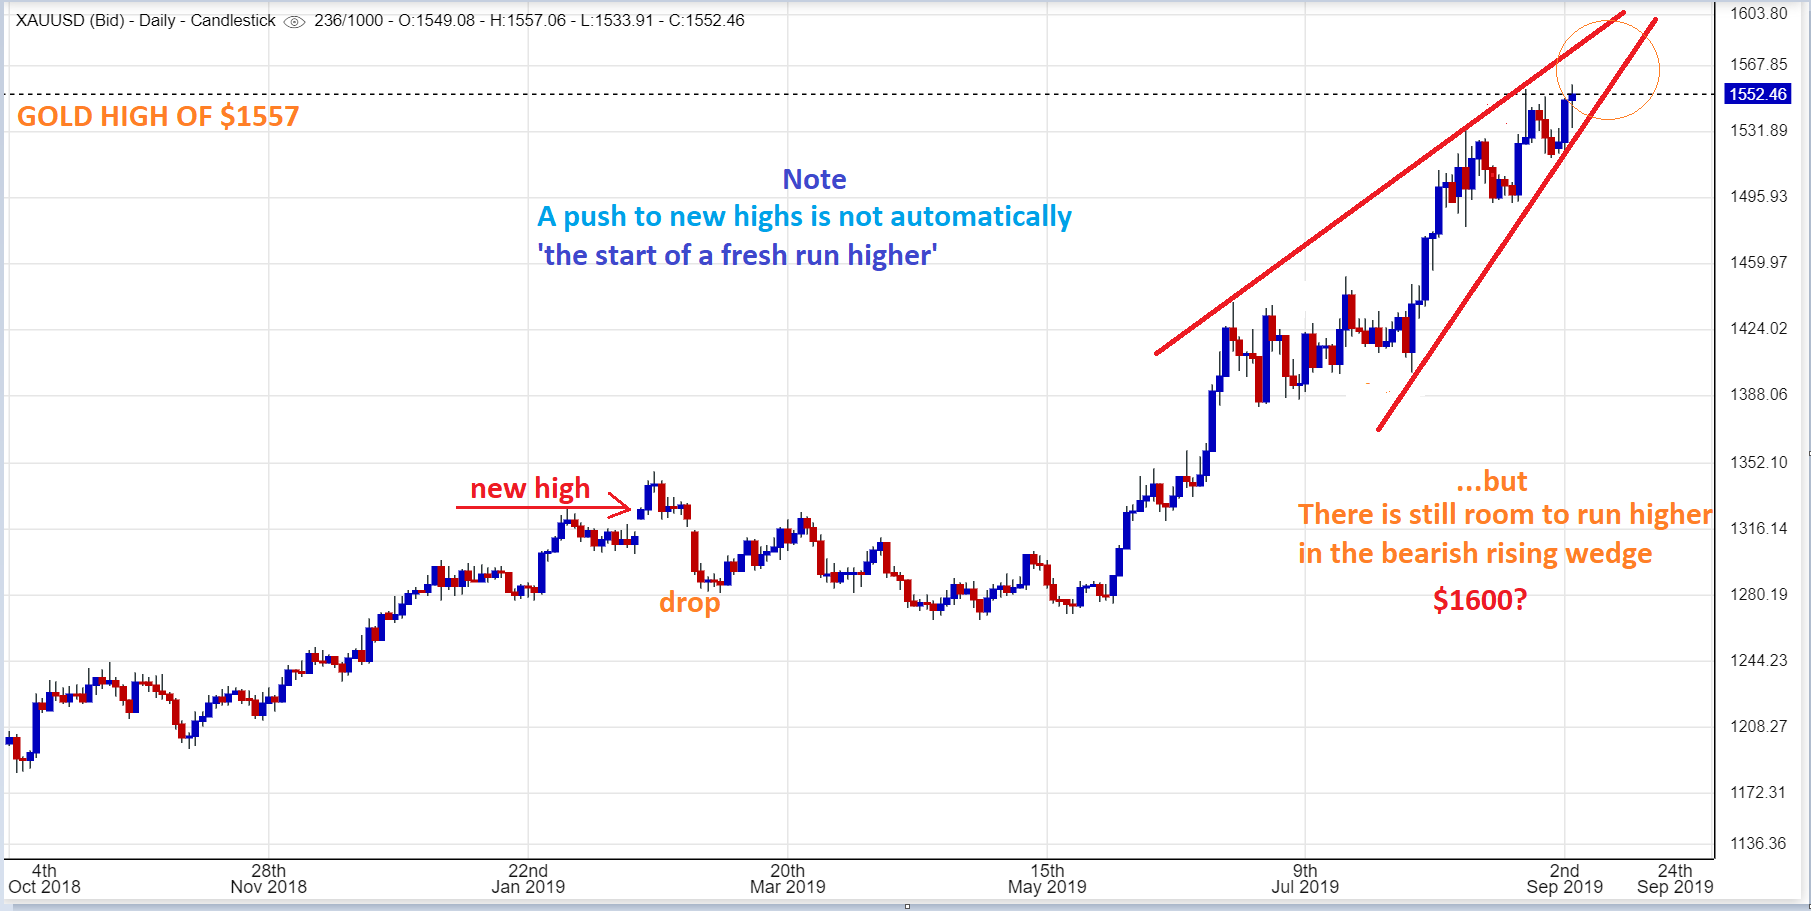
GOLD #2 – I pointed out this bearish rising wedge in Wednesdays report. There is more room left to the apex, so this COULD continue higher. We’ve hit the initial $1550 target, but $1600 was also mentioned as possible. See the chart…
.
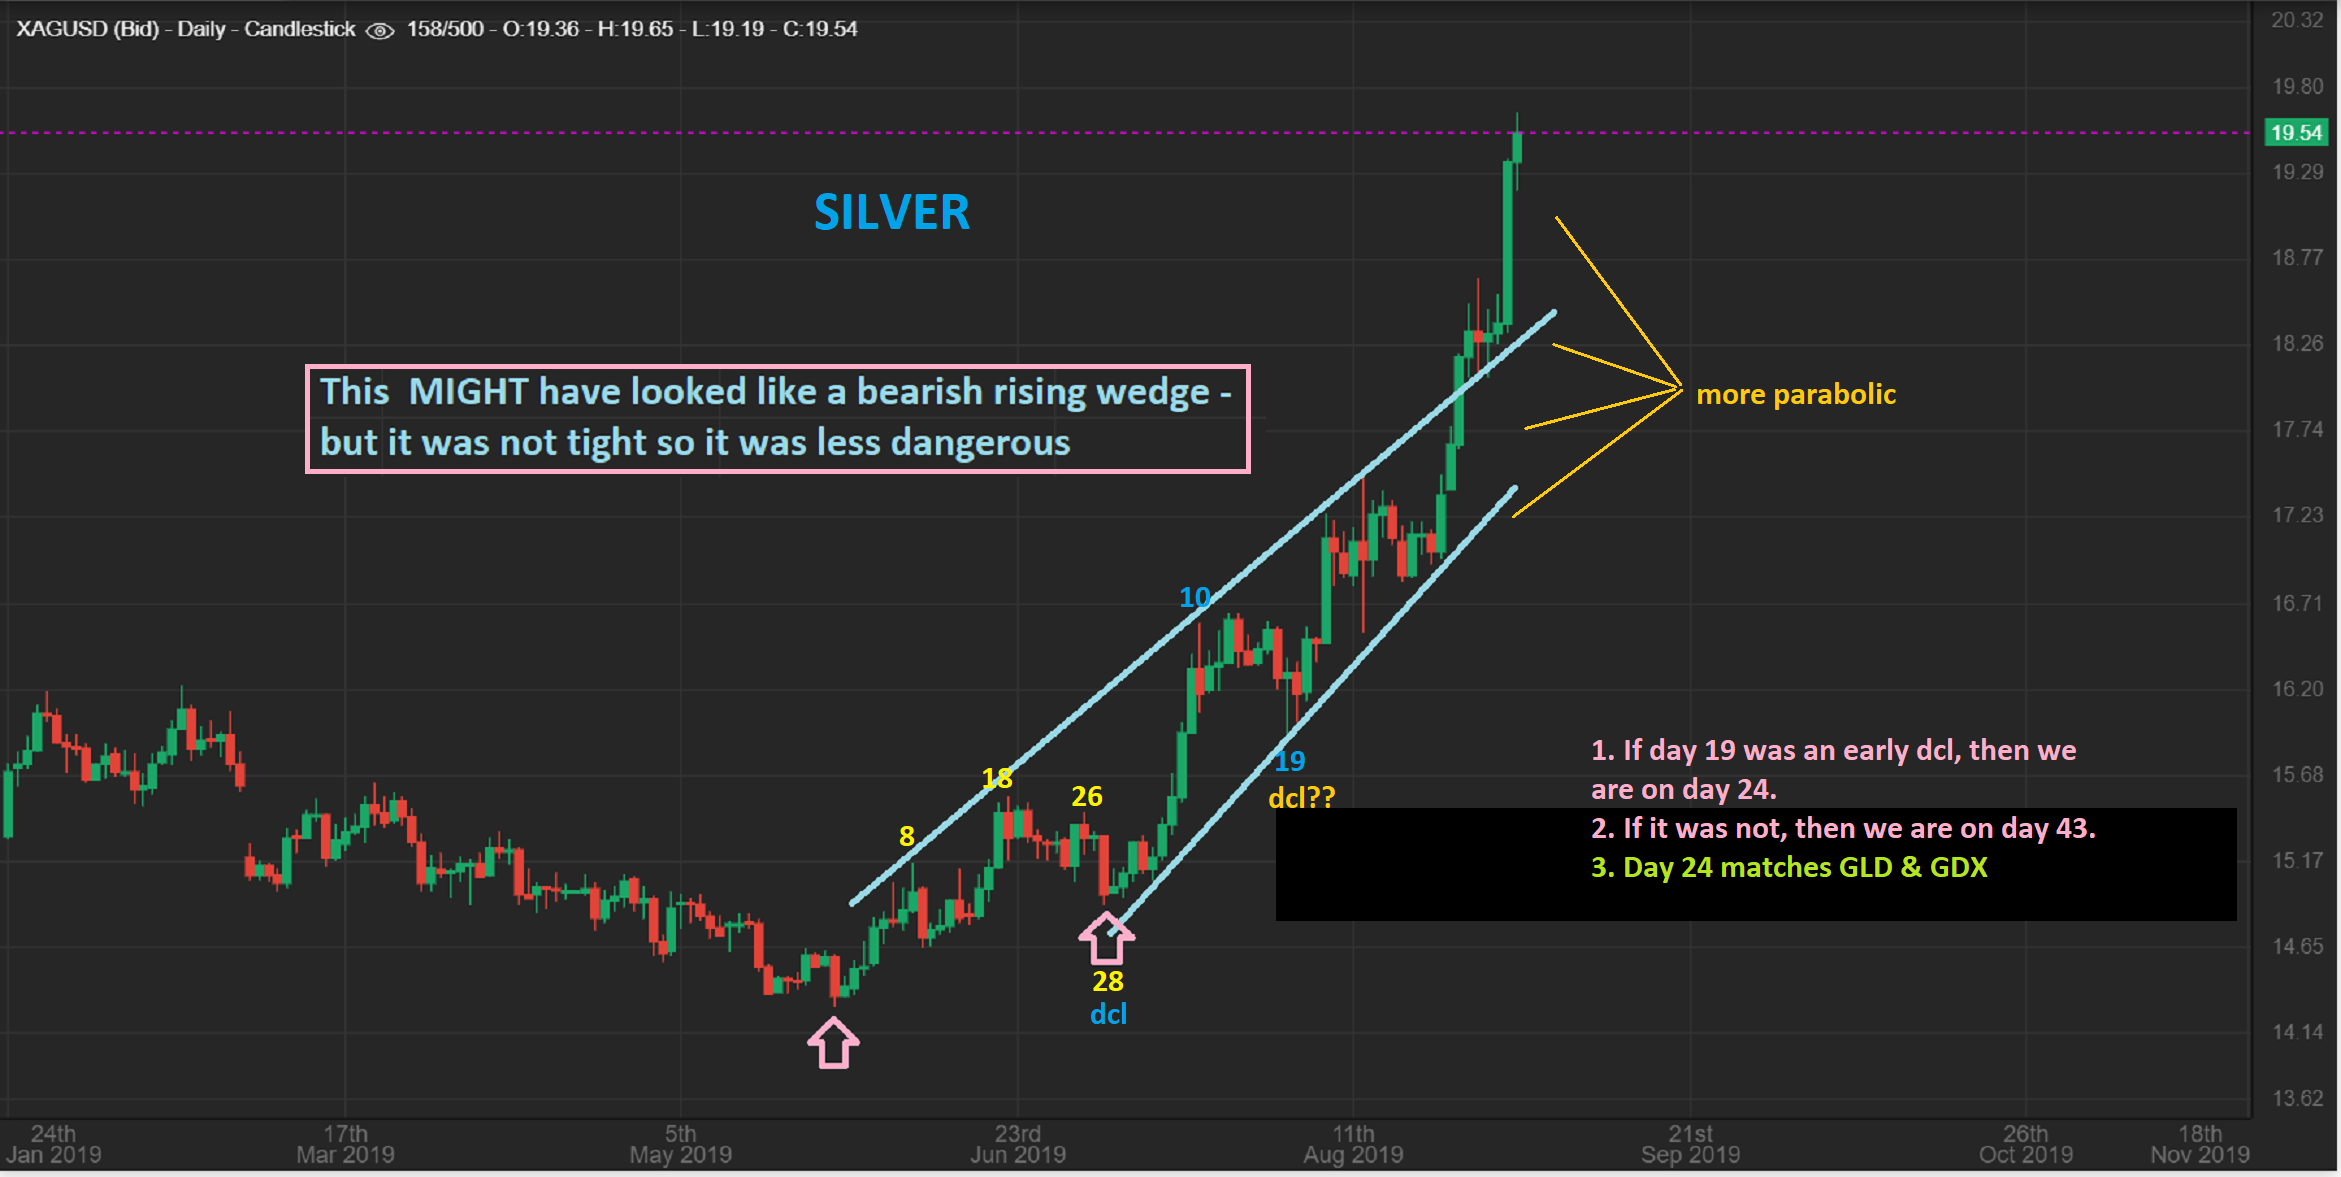
SILVER – Silver has just exploded higher. The cycle count seems to be clear here, with Silver at day 24. That makes this move a short term parabolic burst and likely it will not be able to continue for much longer. Silver hit $19.65.
.
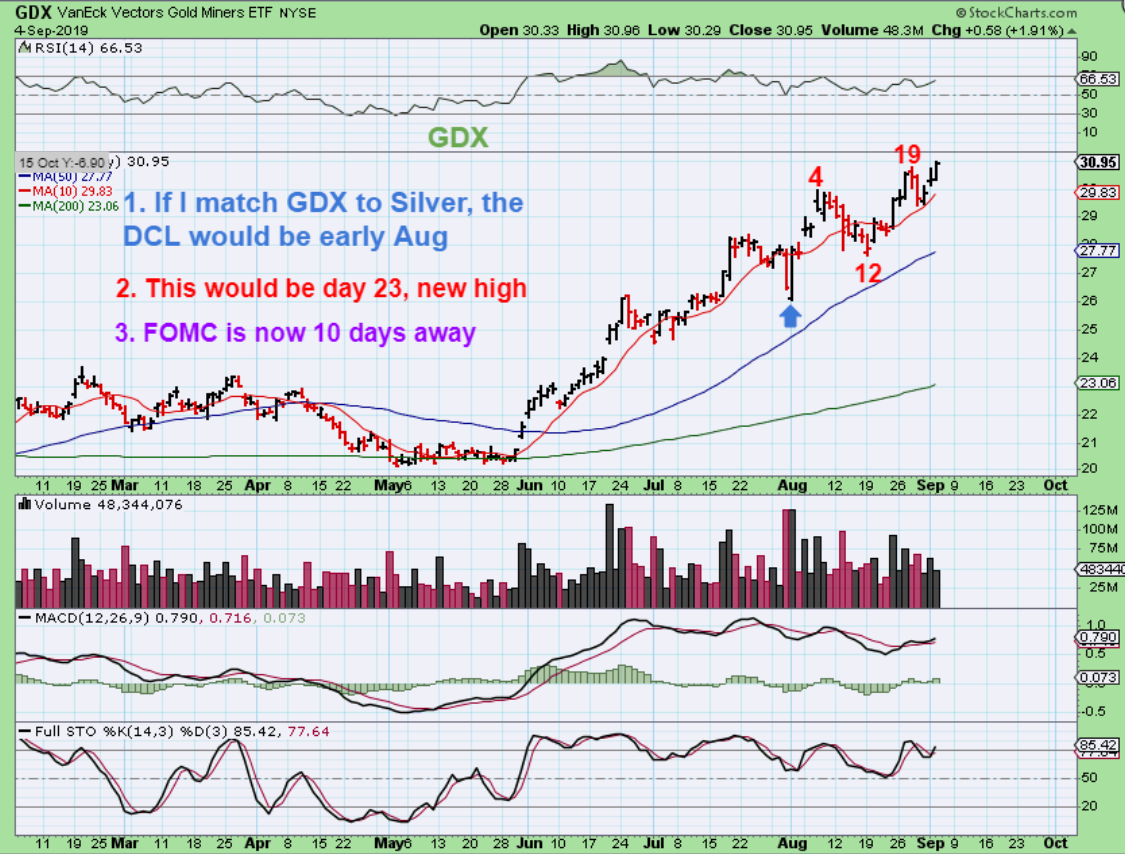
GDX #1 – If we match GDX with Silvers cycle count, it would look like this. This would be a new high on day 23, and we know that they can last anywhere into the 30’s. NOTE: With the FED MTG 10 trading days away, I can imagine 2 different possibilities ahead—
.
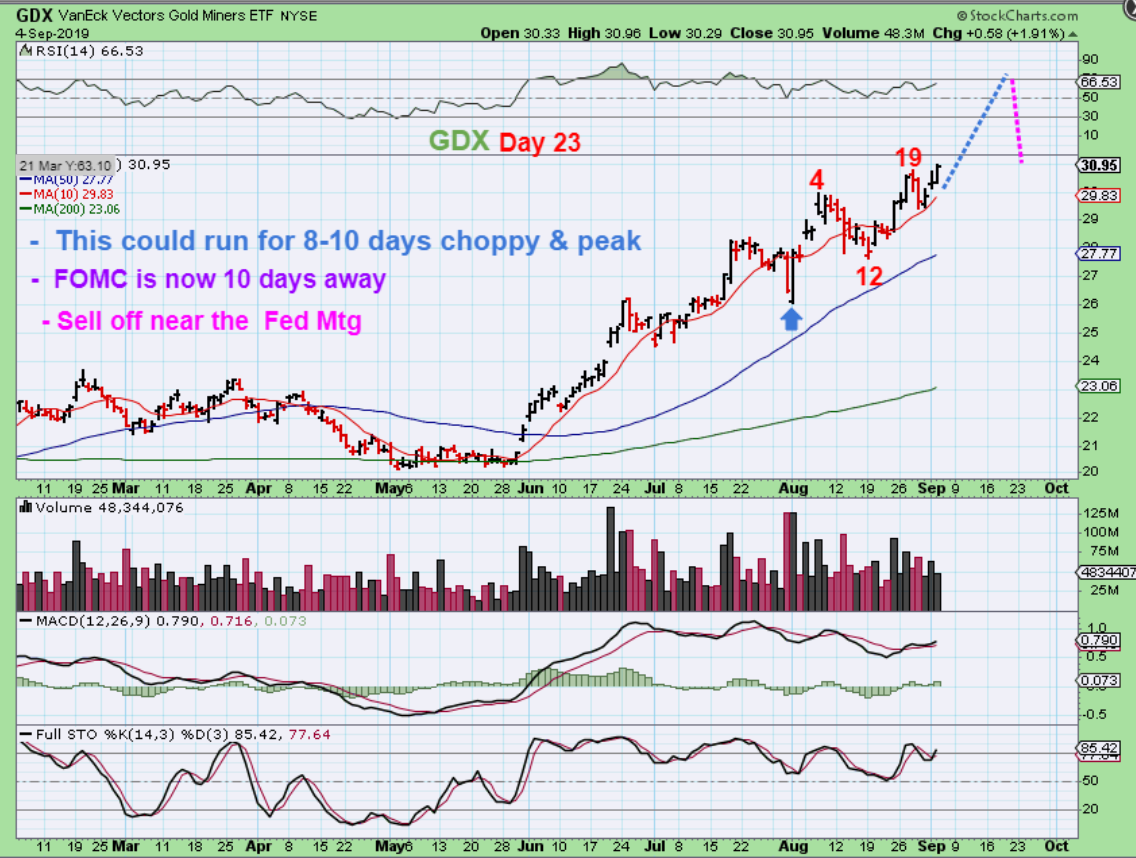
GDX#2 – GDX could rally or continue to chop slowly higher for a few days, and then drop near the FED MTG, or…
.
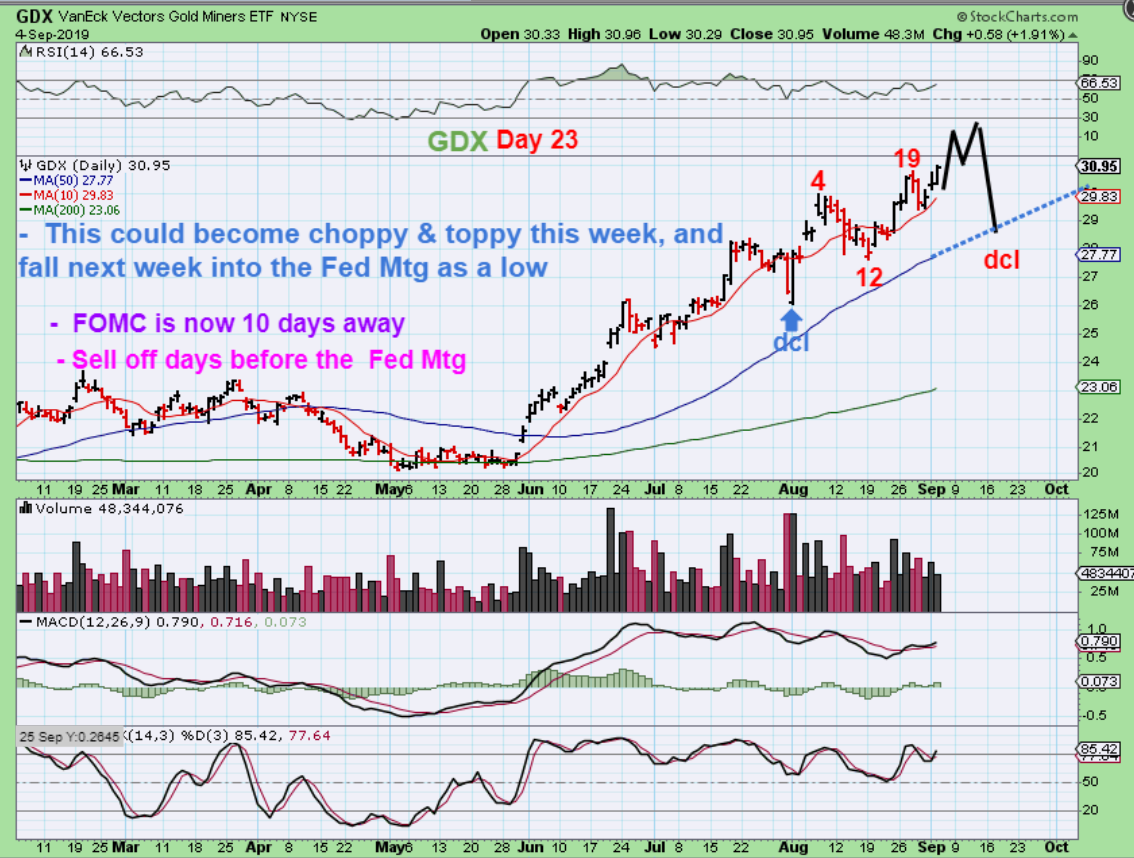
GDX#3 – It could pop here & quickly drop for the next several days, gradually chopping down into the next dcl near that Fed Wednesday. 50 sma on Fed day?
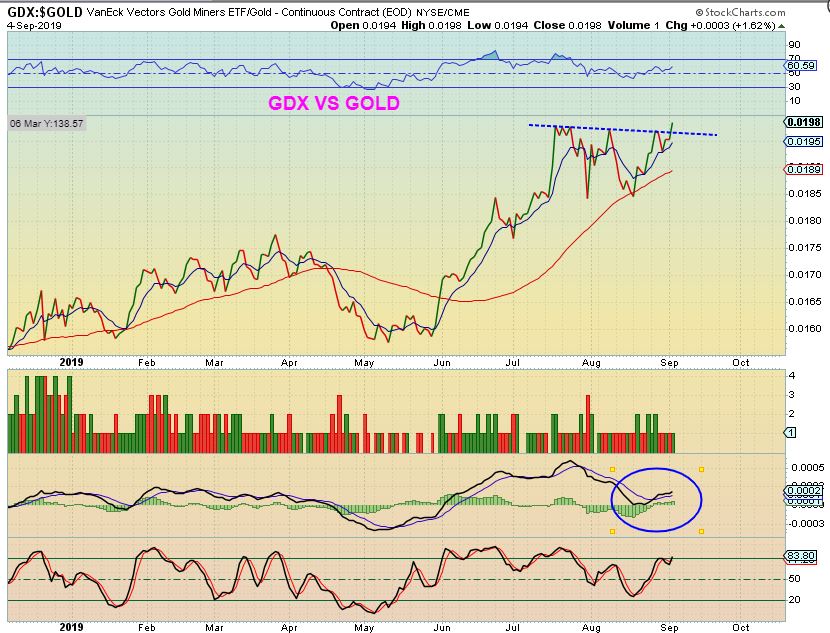
GDX VS GOLD RATIO: When we see MINERS leading the way, it is more Bullish. With Wednesdays move of GDX to new highs, it looks like Miners are leading again.
.
.
The General Markets have been looking more bullish lately, and I have mentioned that in the reports. As I proof read this report, I see the futures up, so they may break out tomorrow. OIL is probably waiting on the Oil Inventory report after 10:30 a.m. Eastern Time.
It is not possible to say exactly how this choppy rise will play out in Precious Metals, but it does seem that ‘time’ is getting late for this daily cycle in Miners, so a ‘peak’ will come due and we could see that dip into the next dcl somewhere around the Fed Mtg . The Key has been to continue to stay invested with a basket of Miners and hope to catch any surprises to the upside. Also, we can try to remain ready to buy that dip. I will discuss a few things below.
.
For now, enjoy your Thursday trading!
.
~ALEX
.
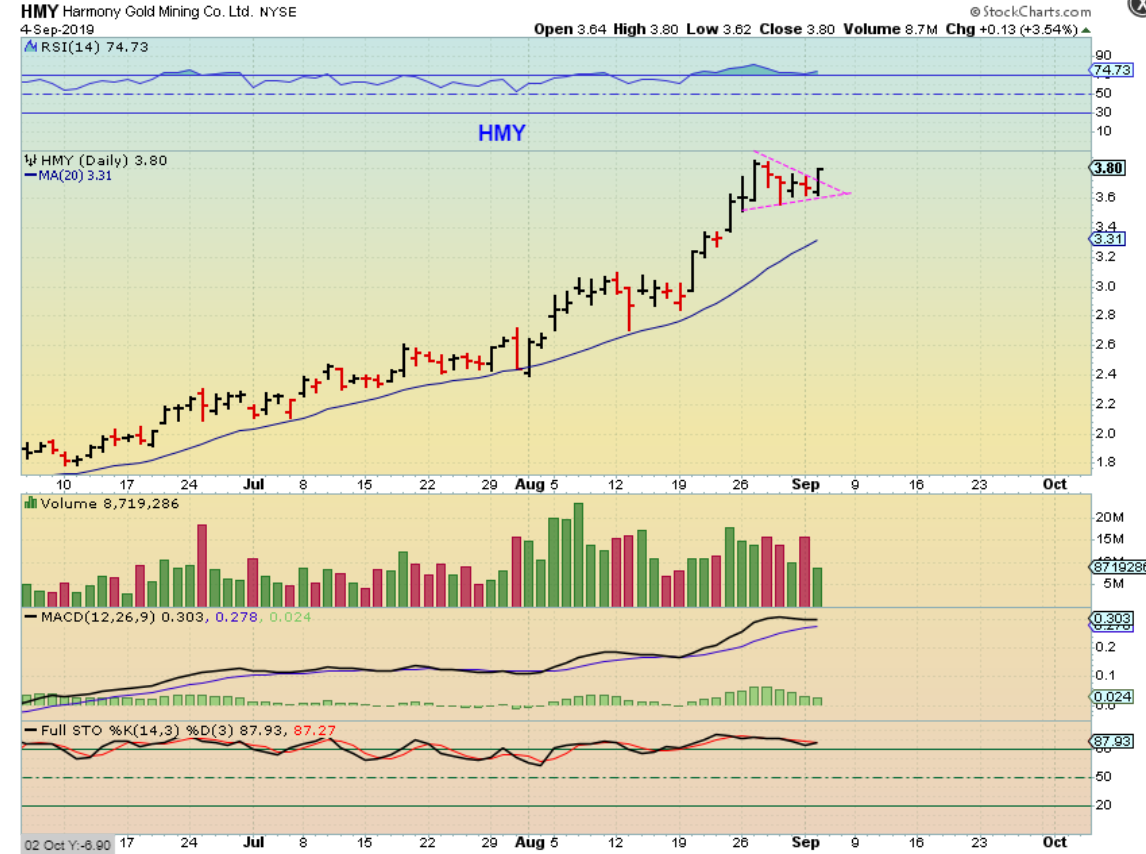
I’ve mentioned in prior reports that some Miners have been pulling back and chopping around sideways, and are NOT near their recent highs, even though Gold & Silver are. They may play catch up if Gold & Silver continue to hold up. I’ve also mentioned other Miners like HMY, EGO, RGLD, DRD, AXU, etc as still moving vertically to new highs, ‘Surprises to the upside’ style. Let’s take a look at HMY & EGO and see what the stronger Miners are still doing….
.
HMY – HMY has hardly pulled back and actually looks ready to break to new highs again, if Gold continues higher or goes sideways. This has been a great ride, easy to buy and hold. Many of us got this in May and have enjoyed this run.
.
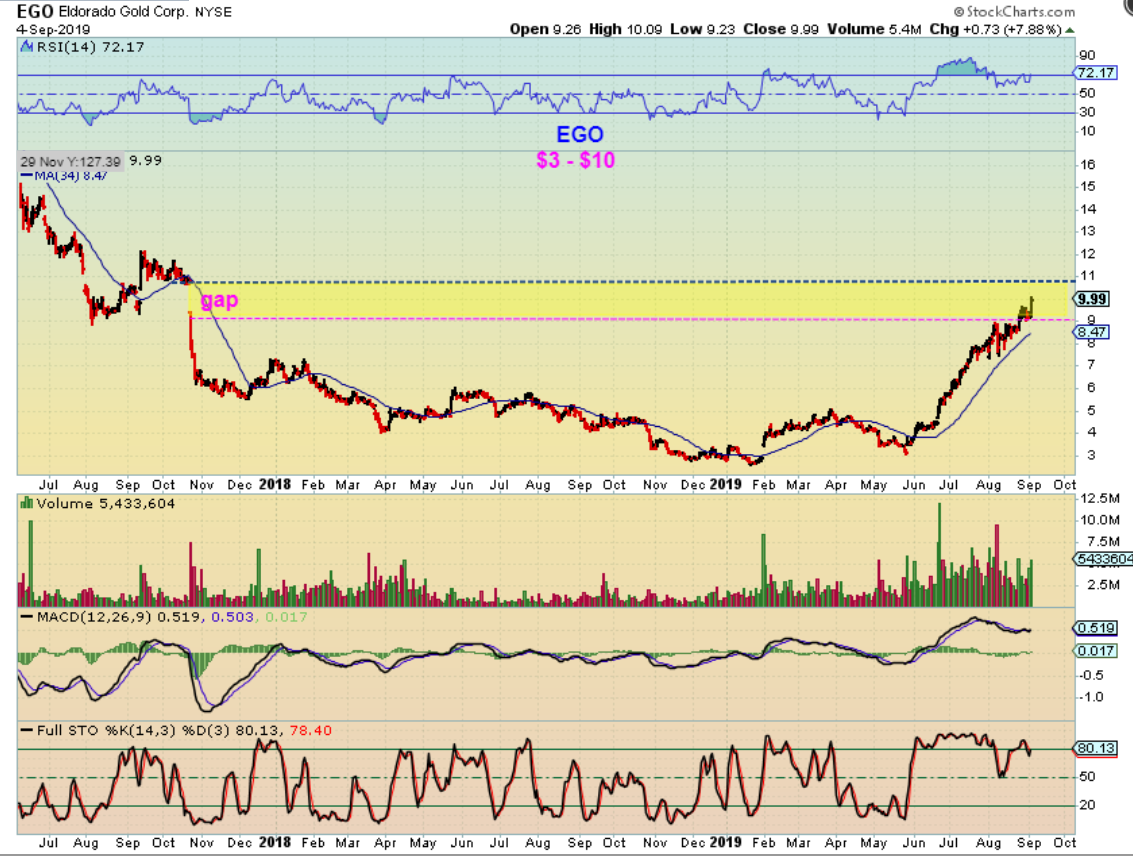
EGO – Speaking of surprises to the upside, look at EGO. It popped 8% higher again on Wednesday, as it fills a gap from 2017. This did get a bit choppy in August after a solid straight up run, but just look at this run! EGO has more than Tripled since the May lows. See RGLD too, what a beautiful 5 year chart.
.
.
Now for a couple more laggards that ‘Might’ start playing catch up
.
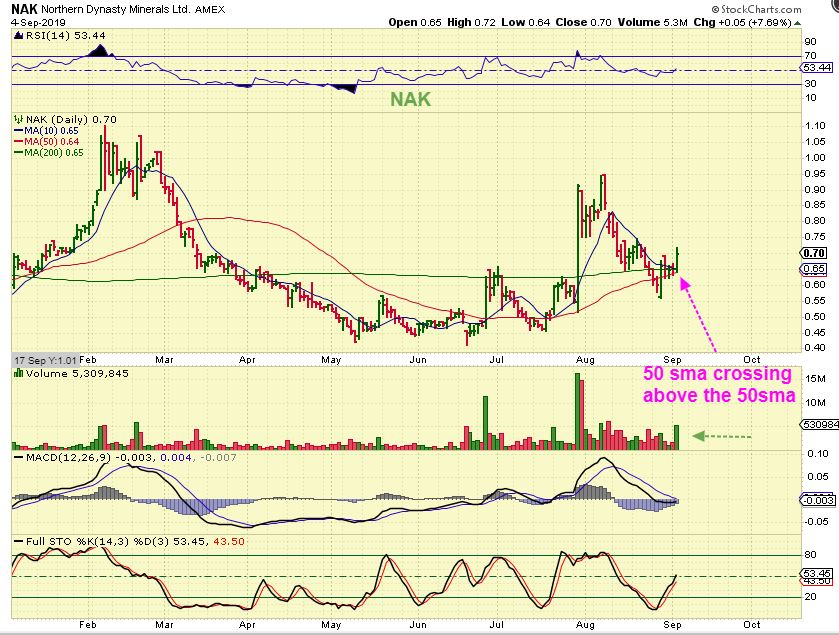
NAK – As you can see, NAK was not an easy ride. It Popped last week and flagged as it regained the 50 & 200 sma. Wednesday saw follow through higher with volume, so I took a chance and bought it. I can use a stop at the 50 & 200 sma, as long as it doesn’t gap down. I also like the weekly chart…
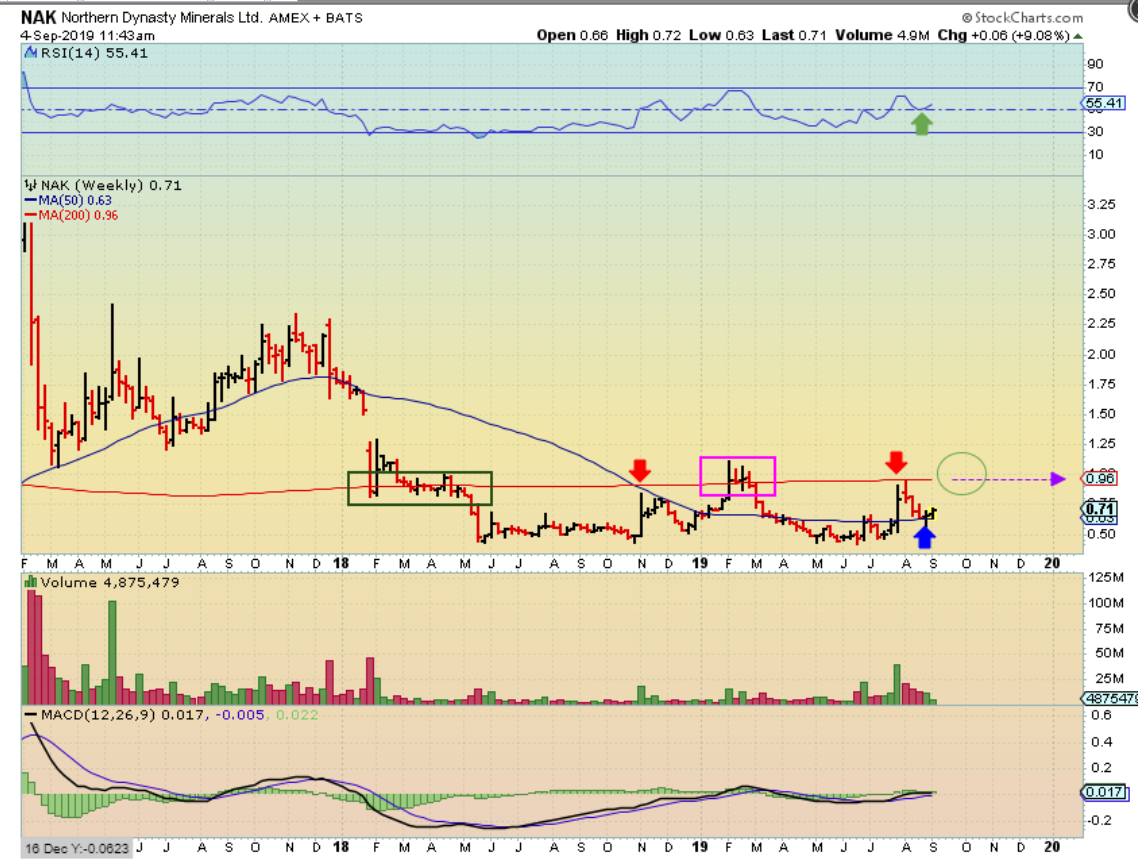
NAK WEEKLY – The weekly chart looks like a large base and price also held at the 50 week ma. Even a run to the 200ma would be a nice gain, but if it breaks out, it could make a great run over time.
.
.
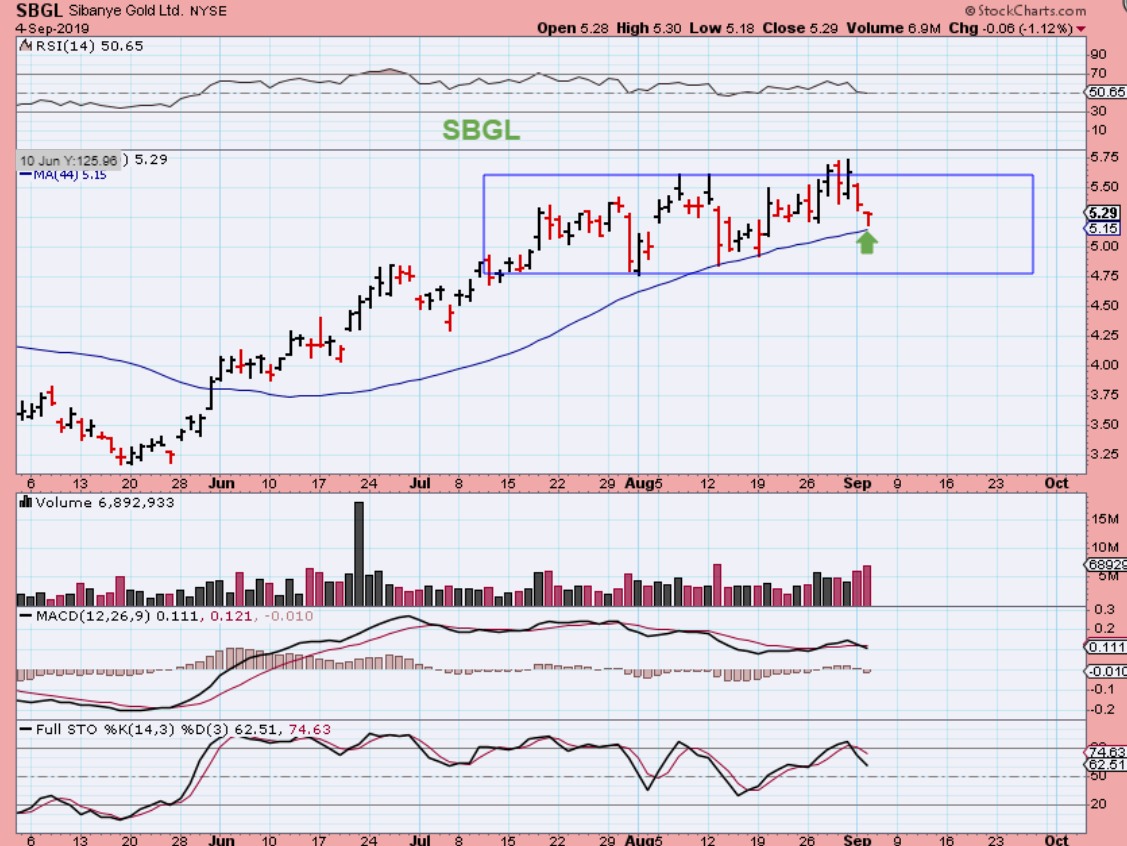
SBGL – Platinum has been rocketing higher, but SBGL is chopping along sideways. At least we have a reversal on the 44 sma, since it reversed there before. Now we see if we can get any more upside.
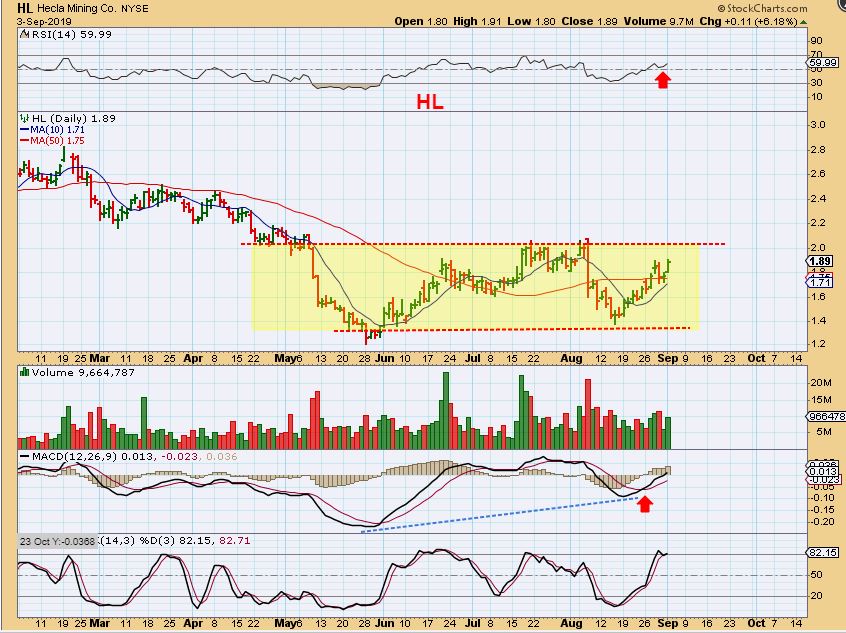
Yesterday I mentioned this base of HL too, moving above the 50sma. Wednesday it was up another 2.5%
.
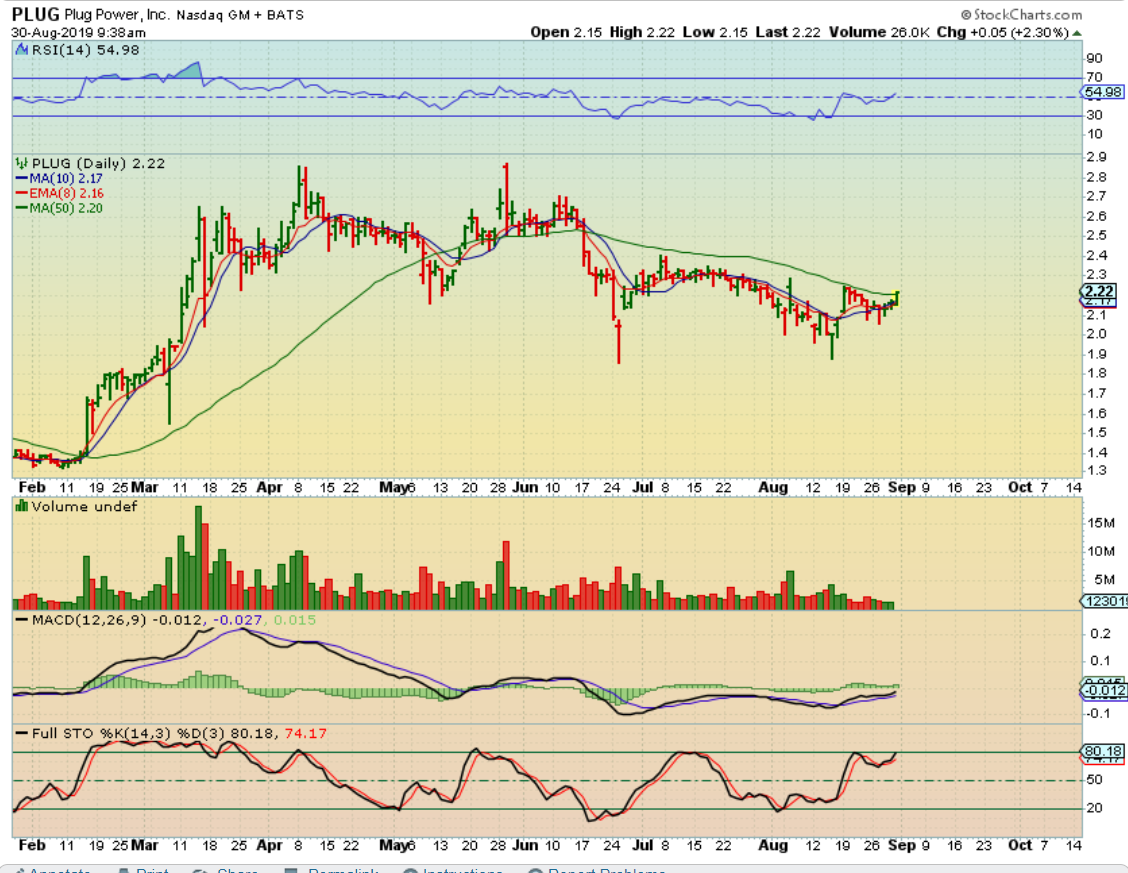
PLUG – I mentioned that I bought PLUG as it crossed the 50sma near $2.20. It then dropped back under it, but I am still in the trade. Why? Let’s review the next chart…
.
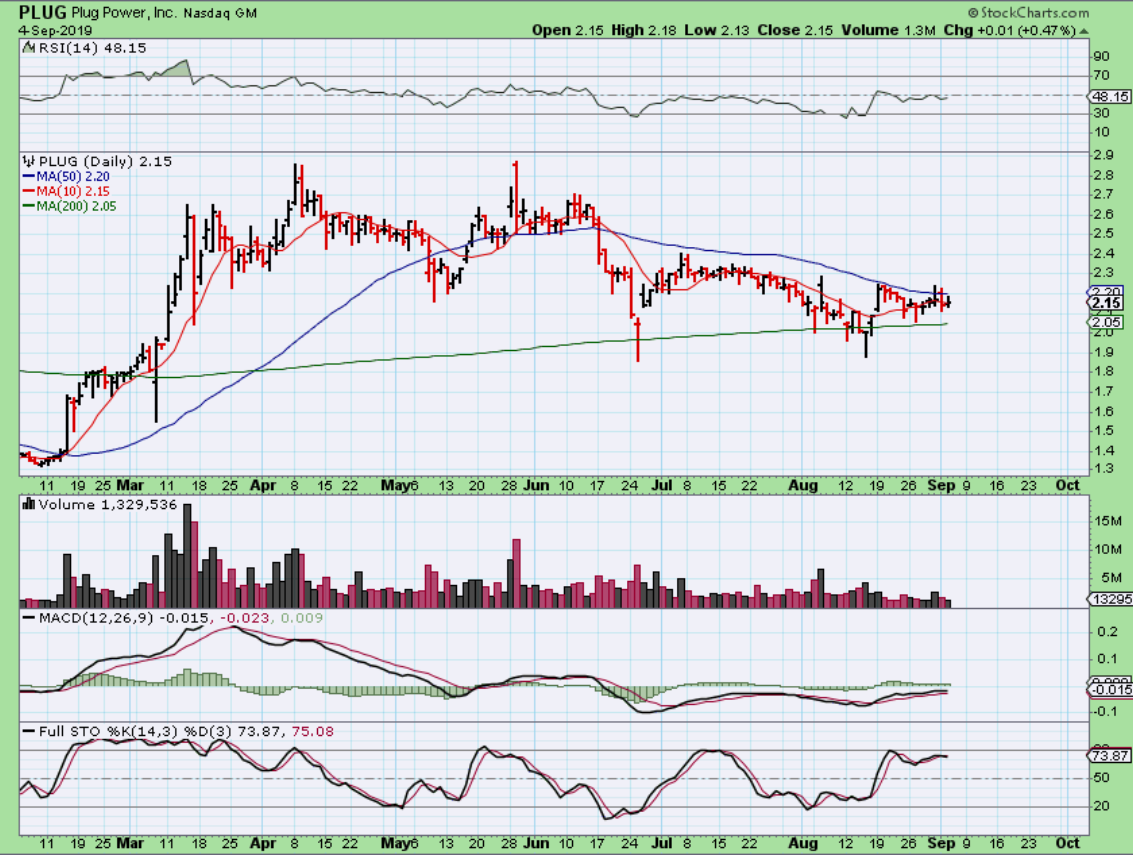
PLUG – PLUG did a shake out at the 200 sma in Mid August and recovered. Now it is pinched between the 200 & the 50. That can be explosive if it breaks higher, so I am waiting a bit longer. If it breaks down, I’m out, if it breaks higher, I might even add.
.
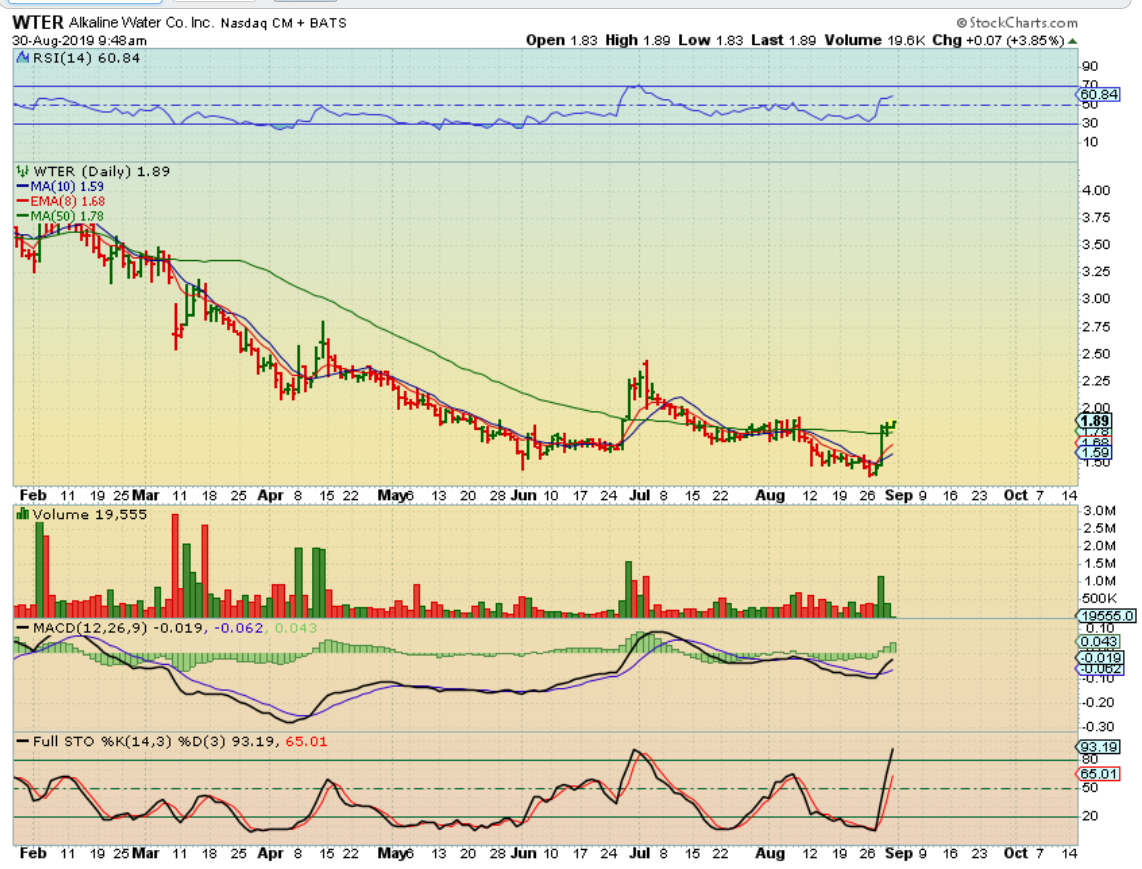
WTER – I Bought WTER at the 50sma in August too. I still own it, it is trading higher around $2.00 as a possible bull flag.
.
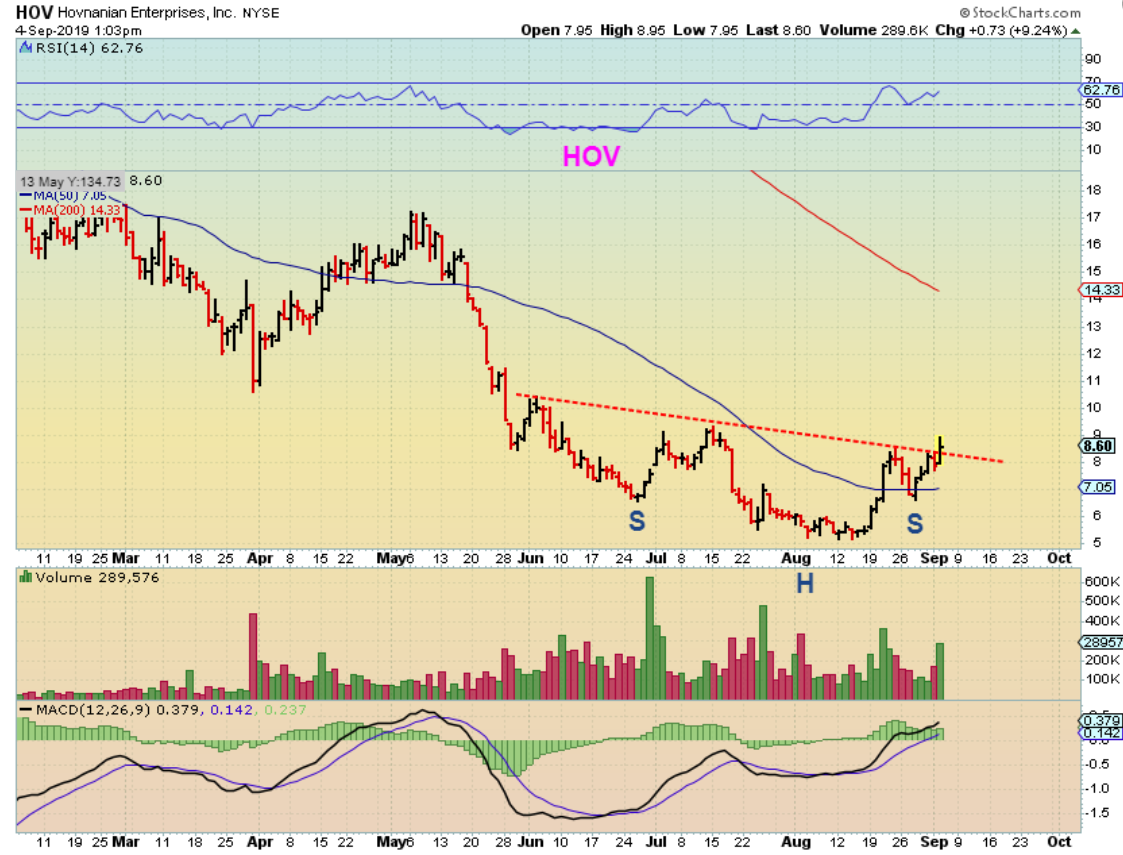
HOV – I saw HOV pop and liked the chart so I captured this, it was up 9%. It is a bullish set up ( Lower interest rates are good for Housing, and other housing stocks look good too). HOV sold off a bit into the close, but I do still like this set up, lets see the current chart…
.
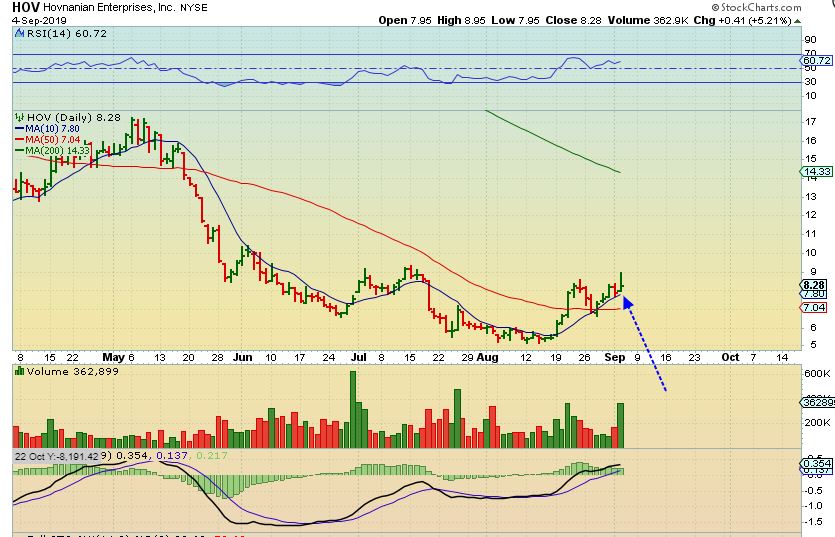
HOV –
So HOV sold off into the close, but was still up 5% on good volume and look at the 10sma. I like this set up, so it is going on my watch list, or I may just buy it here at the 10sma, depending on what it does Thursday. I may just use it for a trade lasting 1 or 2 weeks if it continues to act correctly.
.
WTI – I also do still own WTI, I’m hoping that Oil breaks higher & this escapes from this base / wedge.