Thursday September 25
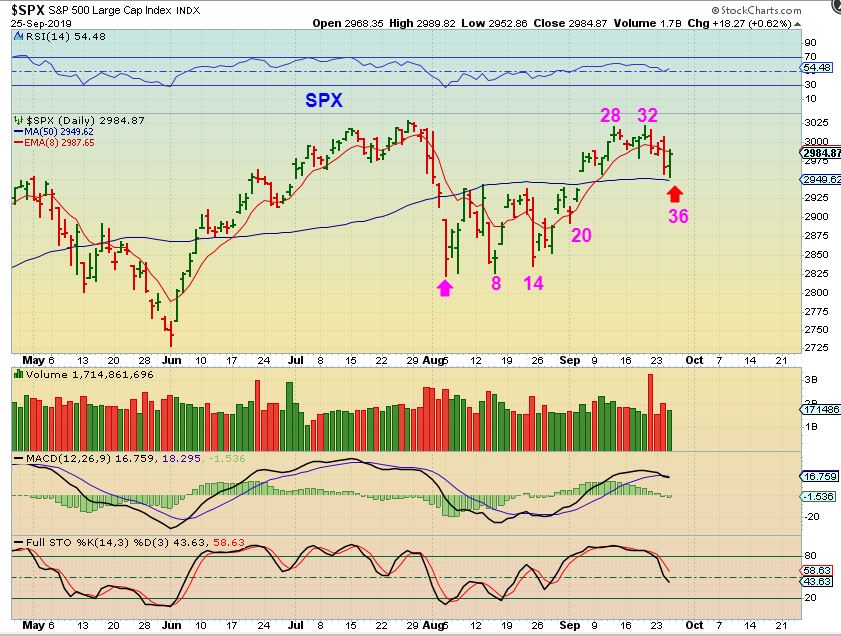
SPX – The SPX had a 1 day plunge Tuesday as the time came for the markets to dip into a dcl. I thought that we could possibly repeat the 4 day drop in August , but then we got a quick reversal on day 36. So…
.
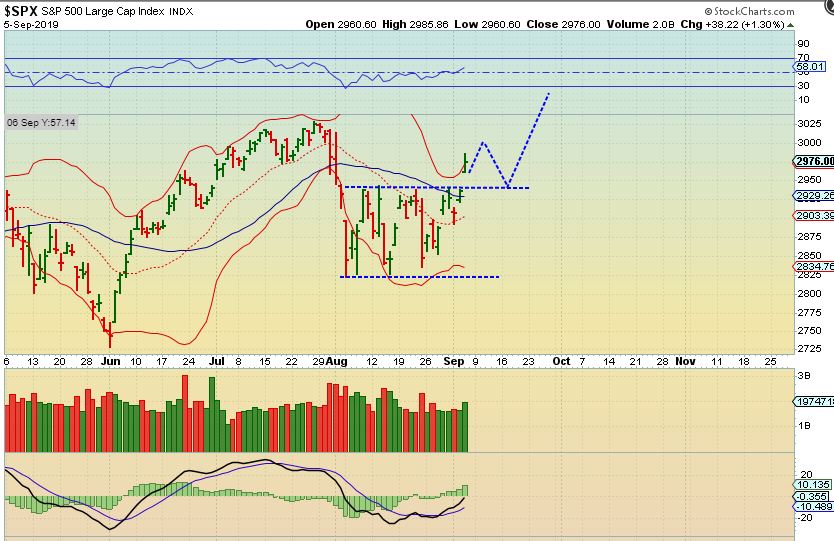
SPX – In early September I thought that we could move higher and then do a back test to the 50 sma as time for a dcl came closer. I drew it here, and that may be what we have here now, we may get the dcl in this area. Look for a close above the 10 sma.
.
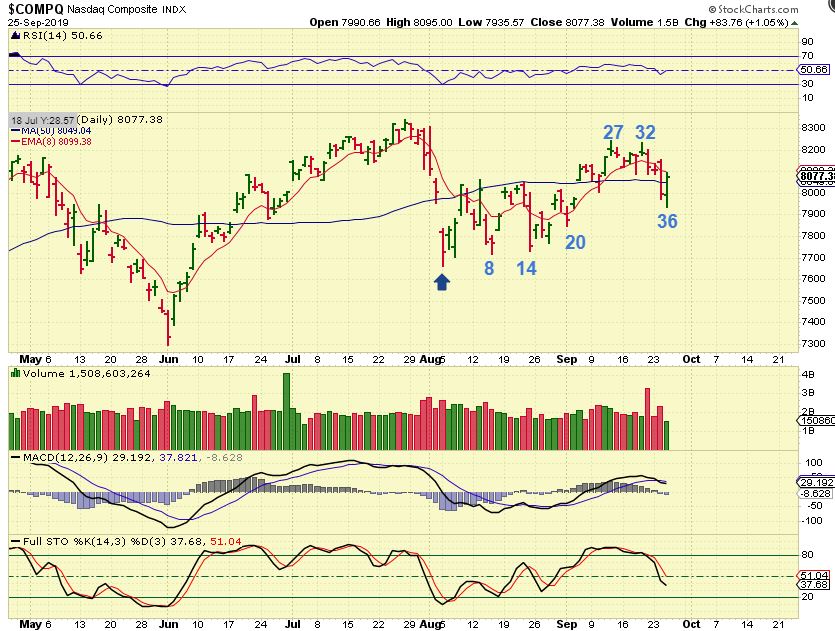
NASDAQ – The NASDAQ lost the 50 sma Tuesday and it looked serious, but Wednesday saw a reversal that recaptured the 50sma. That is often just a shake out. A move higher above the 10 sma would be good confirmation that we had a shake out / dcl. If the dcl starts here, you would think that new highs would be easily attainable…
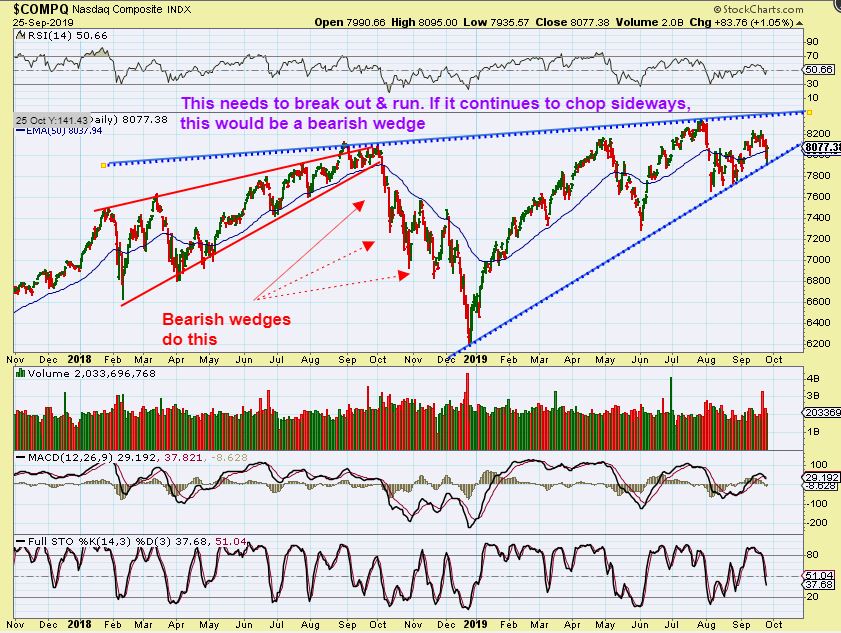
NASDAQ – Breaking to new highs is actually pretty important, because this choppy sideways action is forming another Bear wedge. The last one is shown in RED, and then it Crashed. This needs to break out through the top & run higher to negate it, but we are also getting late in the Intermediate Cycle.
Conclusion: This next daily cycles could form as L.T. this late itn the Intermediate Cycle, and if they then roll over, we will likely be starting an intermediate cycle decline. THAT would be a good shorting possibility.
.
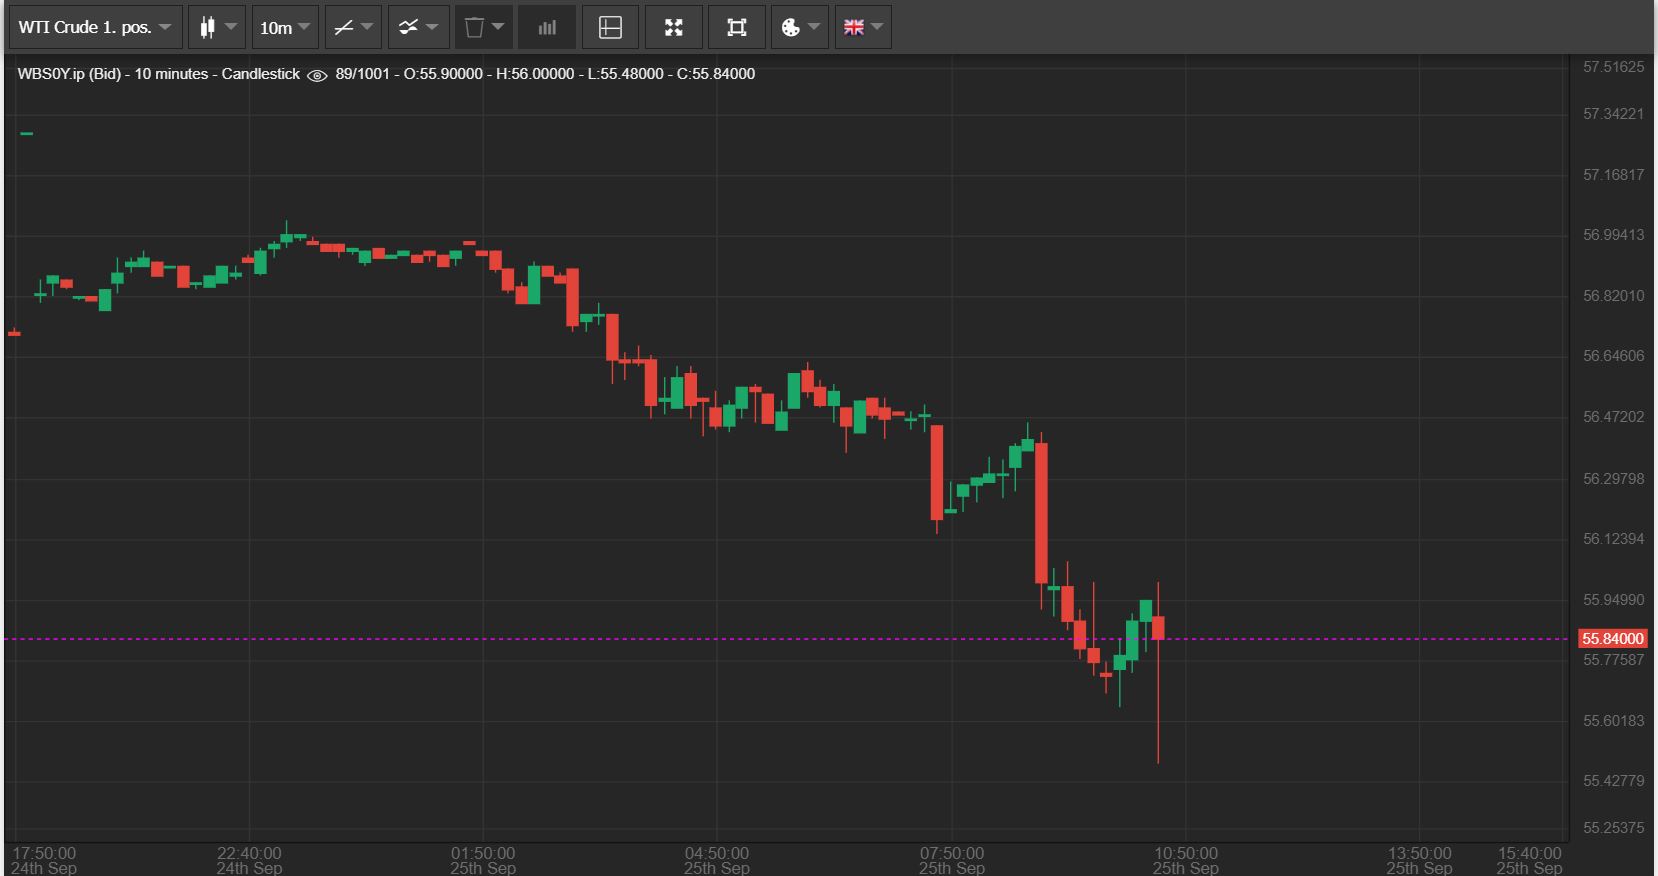
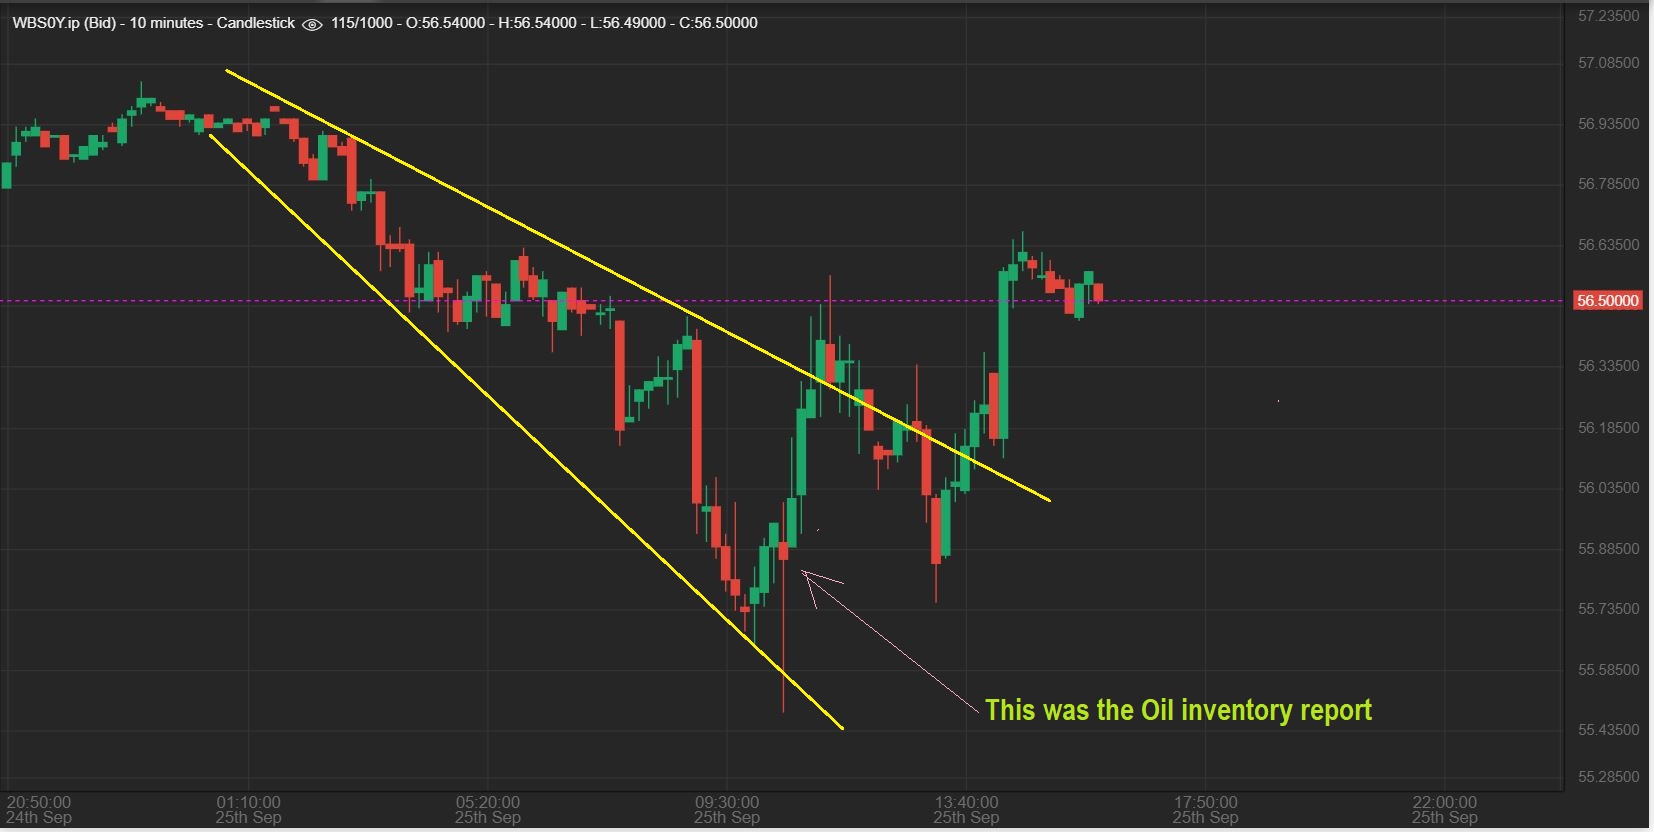
OIL 10 minute chart – This was Oils Inventory Report reaction that I captured for the Live Trading Area. It was a sharp drop & a recovery. So far a shake out / Reversal Candle…
.
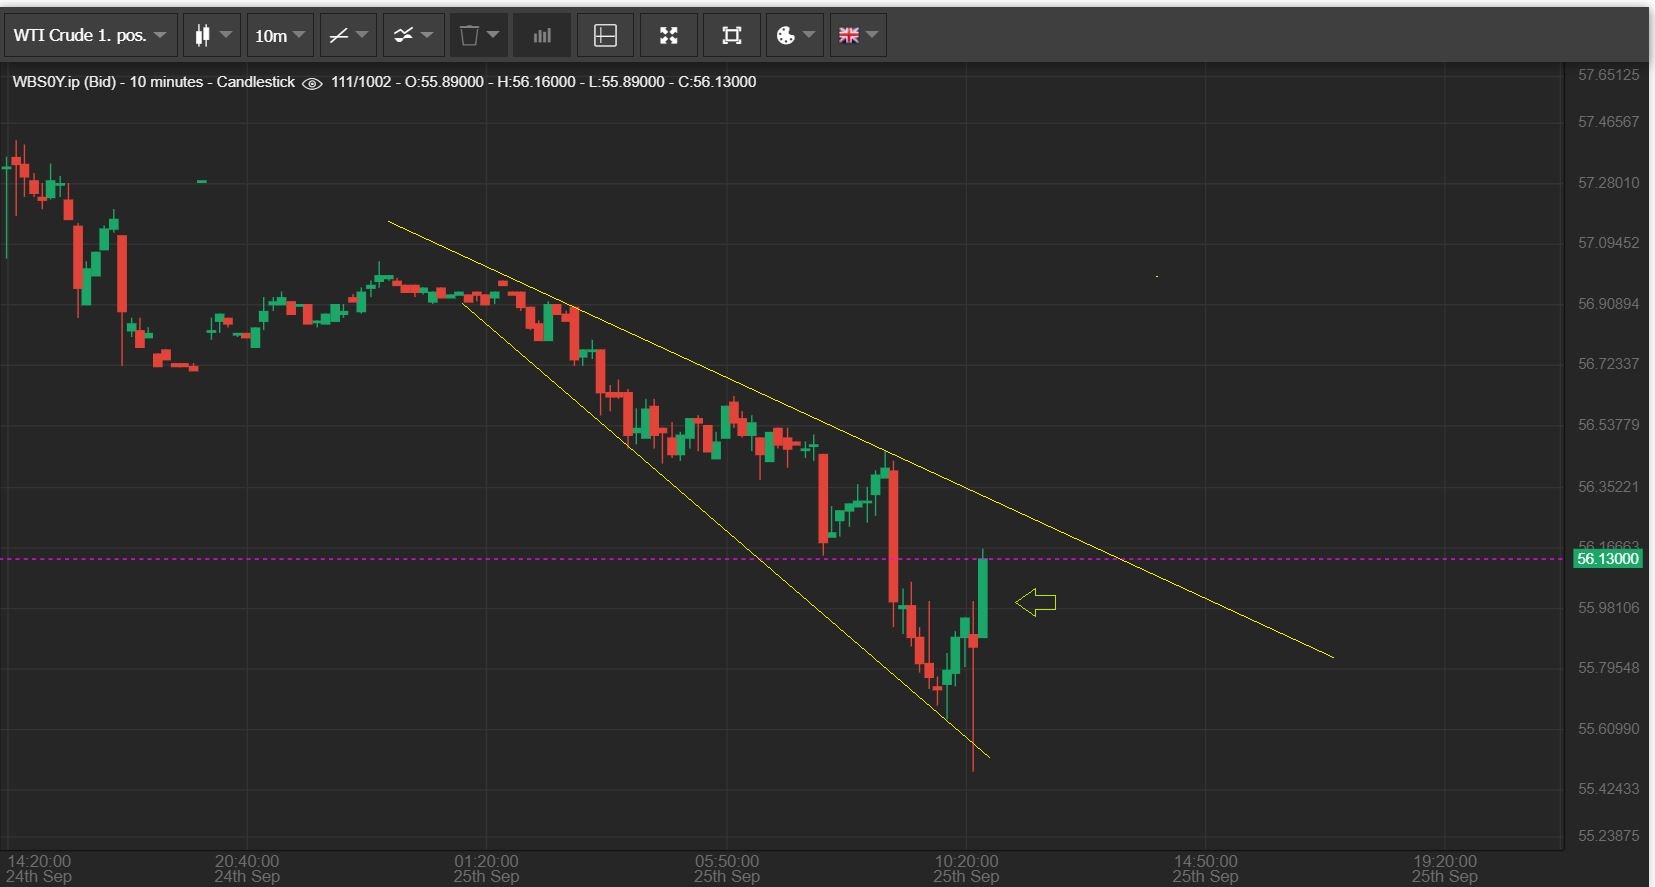
OIL 10 minute chart continued – We then got a follow through push higher & I posted this ( and a few oil stocks) to show the progress. A break above that Yellow down trend line adds to the bullishness.
.
OIL – As the day went on Oil got choppy, but it did push higher to the yellow line. It then pulled back and closed the day with an even higher push upward. MY POINT IS THIS – So far Oils lows were made at the Oil Reports release. Oil then did not sell off below the Inventory Reports release lows all day long. Now let’s go to the daily charts….
.
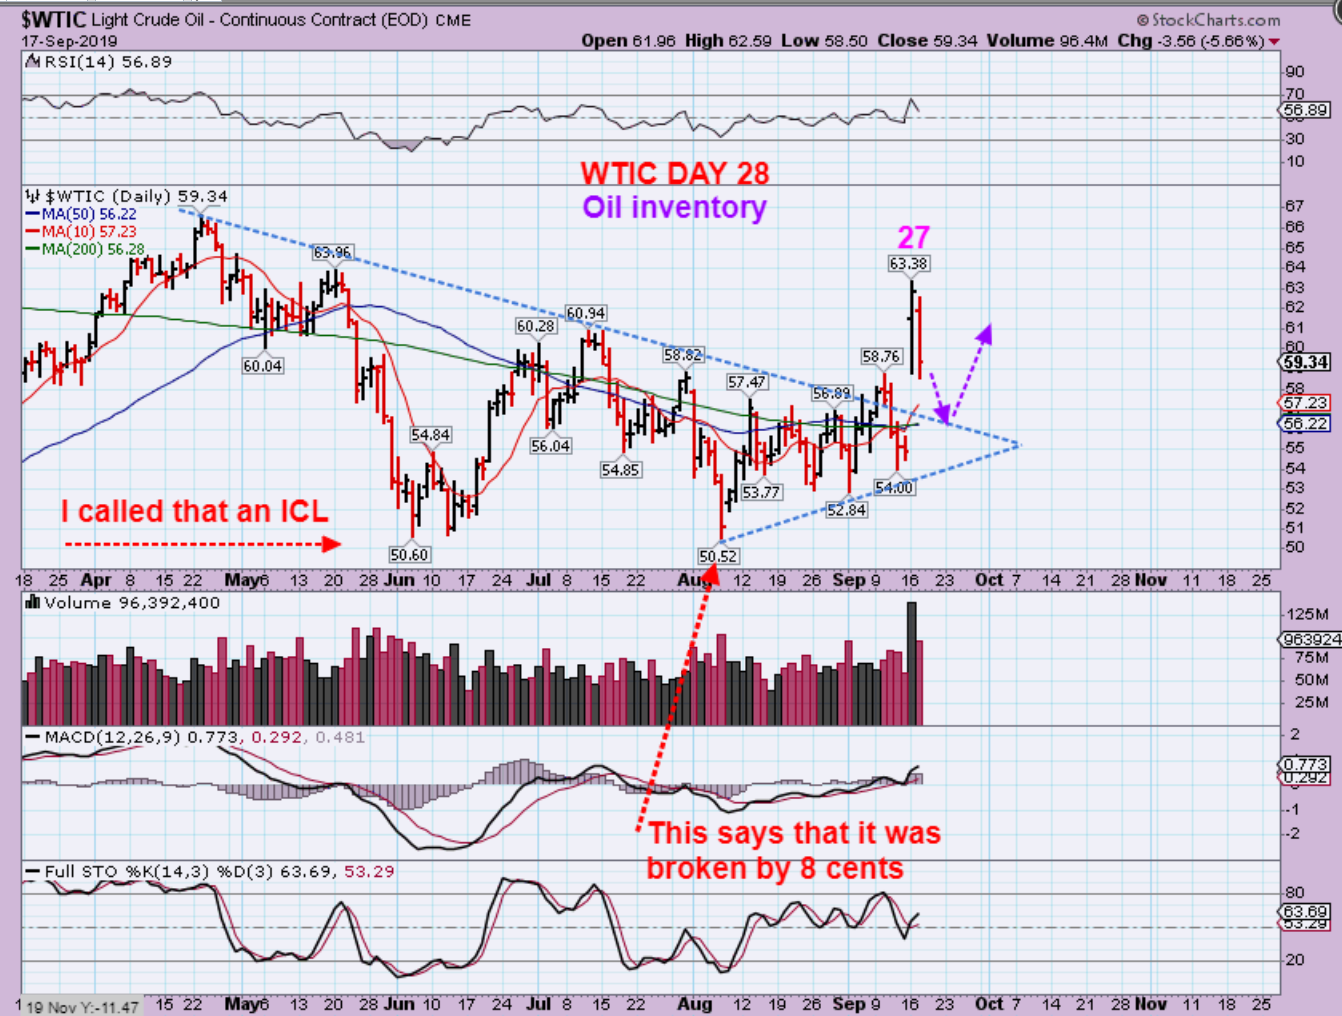
WTIC LAST WEEK – I have been waiting to see if Oils blast higher would simply back test the break out area & reverse as shown …
.
.
WTIC – So Oil dropped to the 50sma and back tested the down trend line & reversed on that oil report. You can see an area just below yesterdays lows would be the upward trend line & down trend line apex, so a bit lower is still ok, but I want to see Oil turn here.
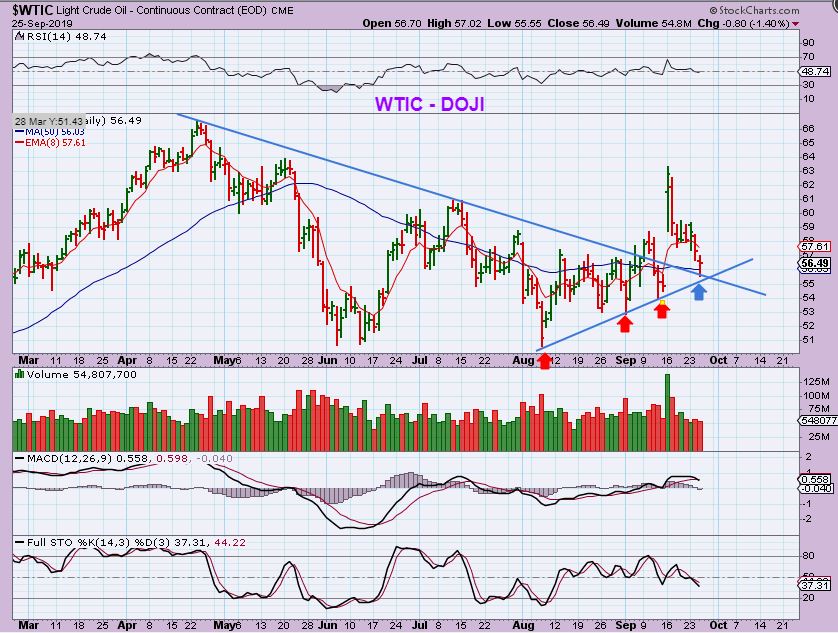
For anyone still thinking that Oils Saudi burst higher was a 1 day event, I was buying before that event because the Lows were in early August. We are at day 34, and an Oil dcl can come from day 30 – even as high as 50, so this can move higher and then drop later, or this could even become a dcl. Time will tell…
.
XOP – I grabbed this after the Oil Inventory Report at 11 a.m. eastern Time. XOP landed on a Fib retracement and reversed back over the 50sma. That looks like a normal pull back so far, as long as it holds into the close. I bought GUSH again with a stop at todays lows and …
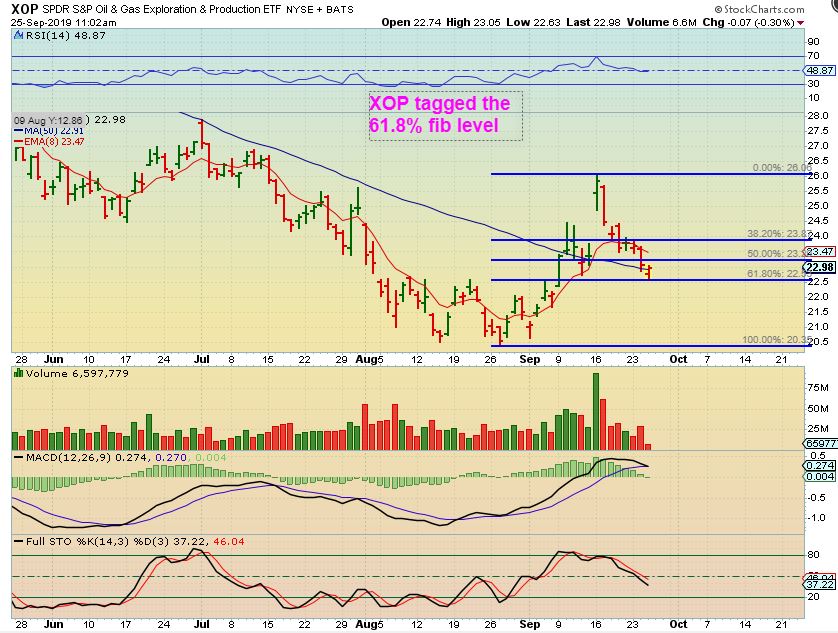
XOP – We closed a bit higher. I do worry that I may be early, because it is not fully oversold on the stochastics. It could crawl down the 50sma for a few days to get oversold, but I am able to have tight stop with this reversal.
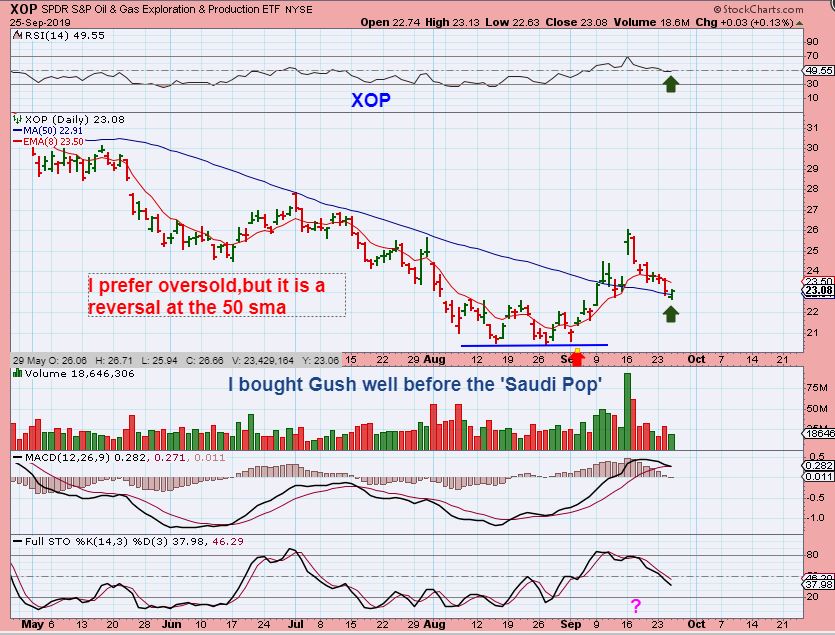
Be careful with leverage – I am a trader and being in front of the screen allows me to watch these positions closely.
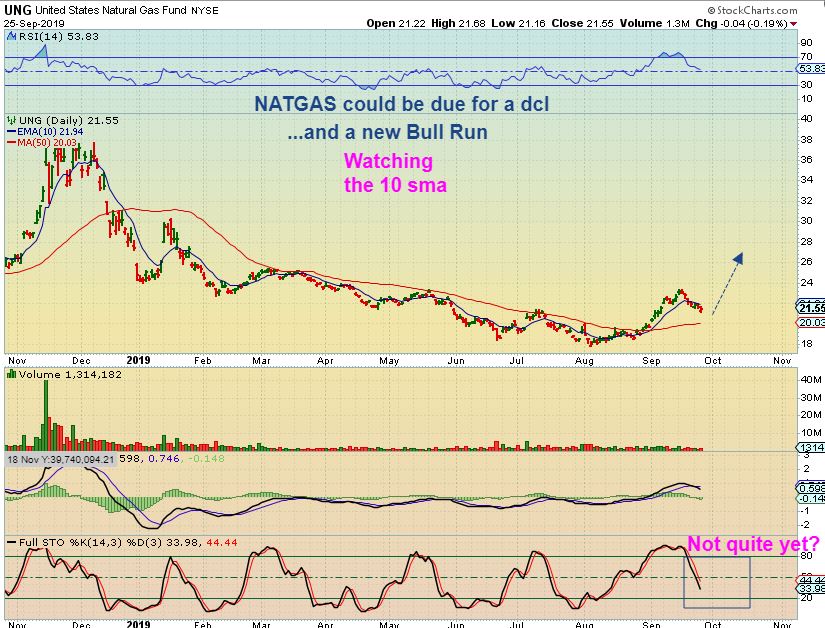
NATGAS – Natty had a strong run out of a long sell off base. It may be starting a new uptrend, so I am watching for the next dcl.
.
GOLD – We have enjoyed a nice quick run out of the dcl, but I have also mentioned that if this is to form as a left translated daily cycle, we need to be aware that it could top out on day 7 – or – Day 9 – or – Day 15. So we could enjoy the ride higher out of a dcl, but remain alert…
.
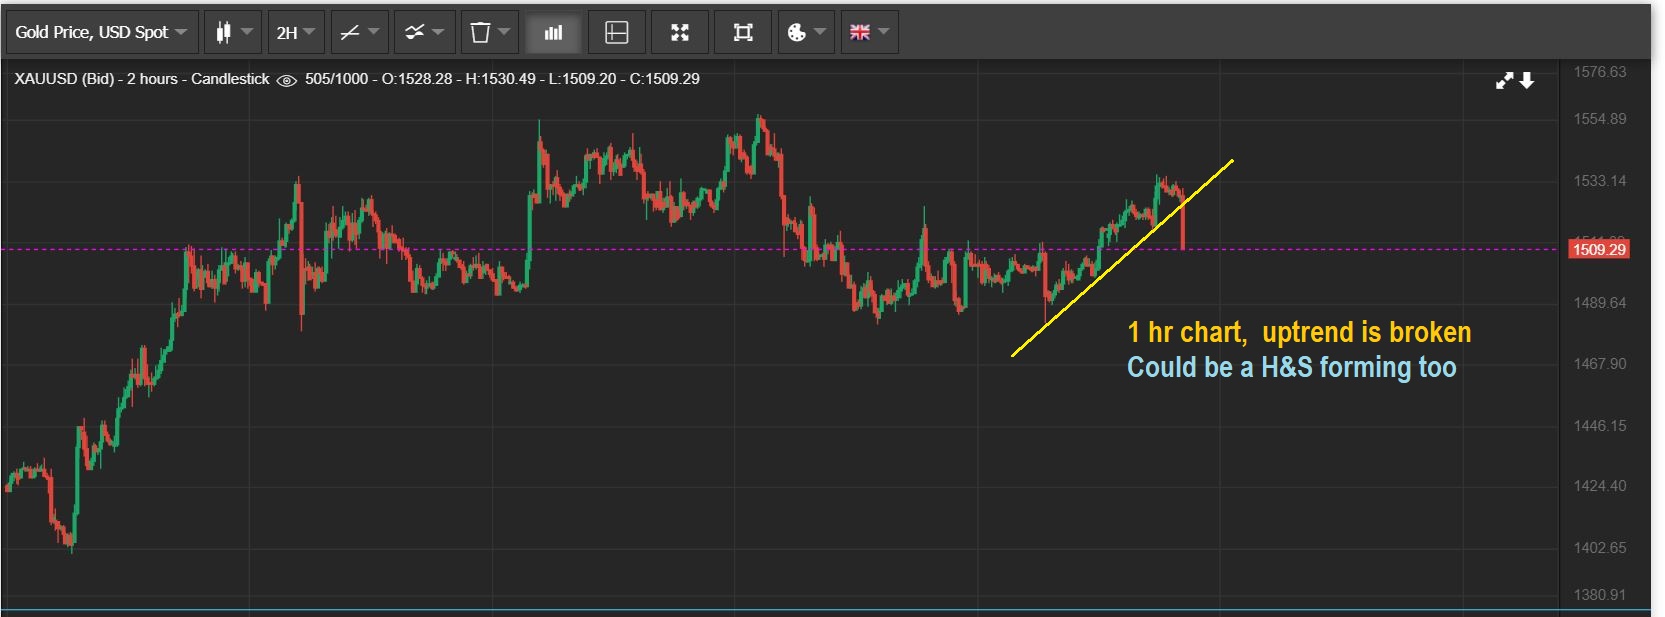
GOLD 2 hr chart – Gold started to break down intraday, and the uptrend on this 2 hr chart was broken. Eventually this could become a H&S, so caution was warranted…
.
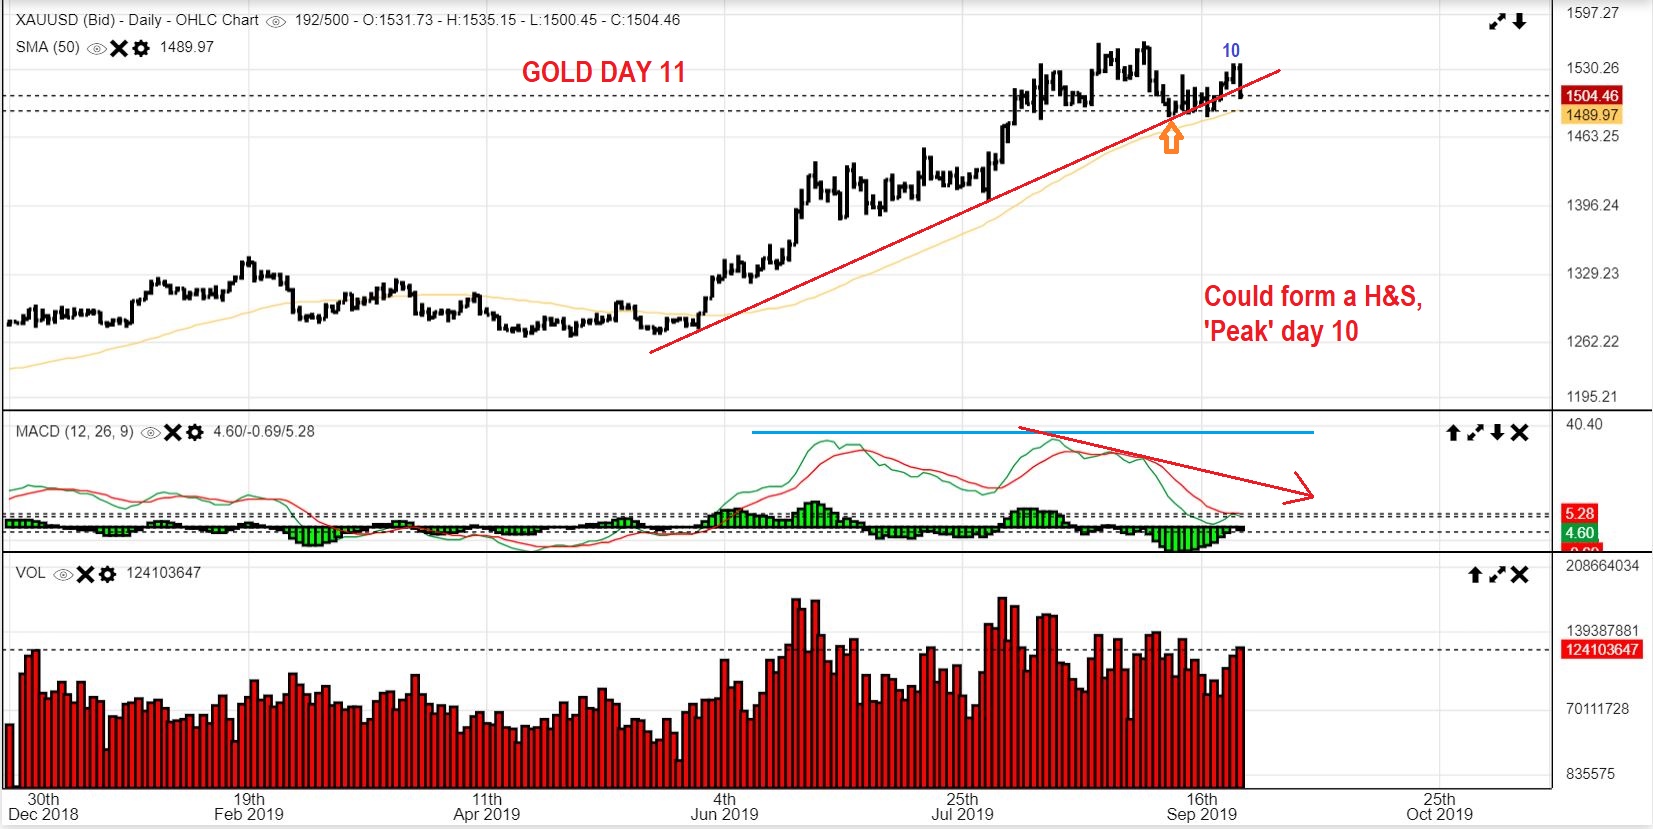
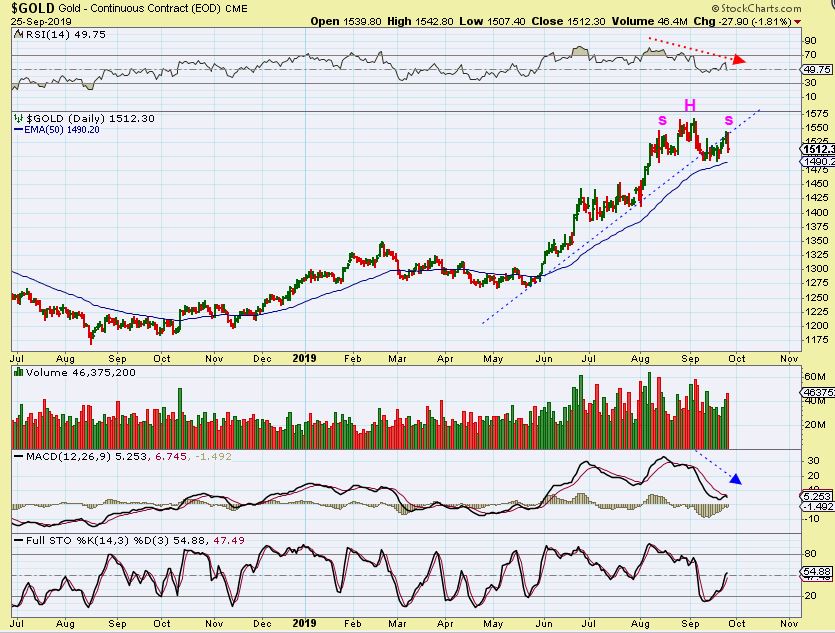
GOLD DAILY #1 – Gold is on day 11 and this could be starting to ‘peak’ if it will become L.T…
.
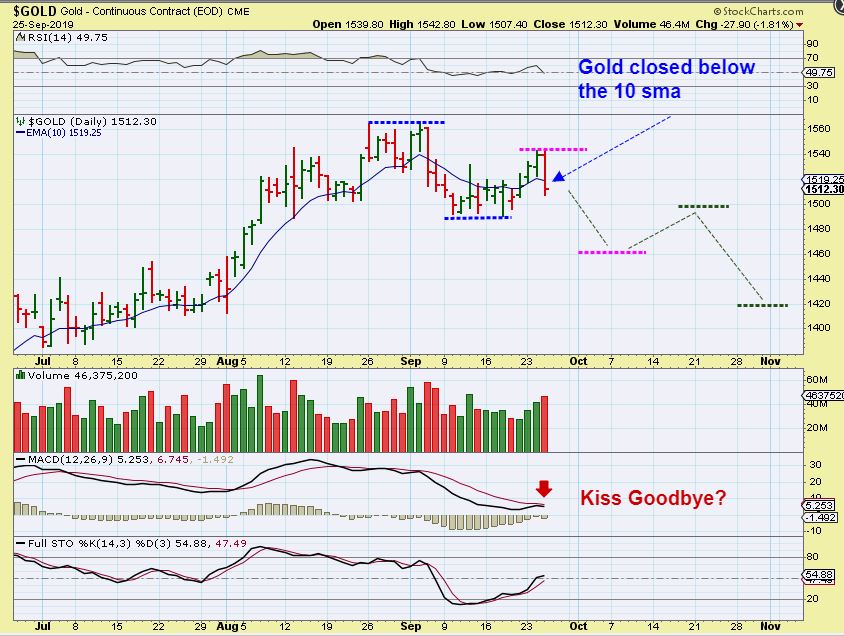
GOLD DAILY #2 – Look at the MACD as Gold rolled over. That is a sign of weakness. Gold also closed below the 10sma, so this could be starting to drop into the next dcl and if so, you’ll see lower highs and lower lows. What I drew is just a rough visual, not a prediction.
.
GOLD DAILY #3 – You can see a possible head & shoulder forming if this breaks down below the 50sma, and since Gold closed below the 10sma, this could be the start of a drop into a dcl. Gold can still chop around and not take out the day 11 high, so shorting may be tough, but it is possible.
.
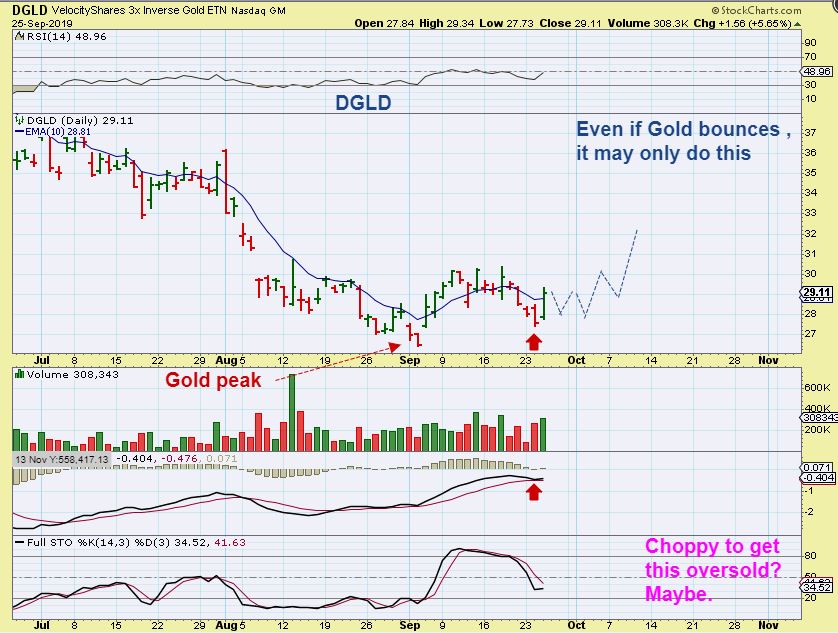
DGLD – DGLD is a way to short gold 3x leveraged. ( ETN not ETF). Gold being choppy would make DGLD look like this, so it may take time before this daily cycle really gets moving to the down side .
.
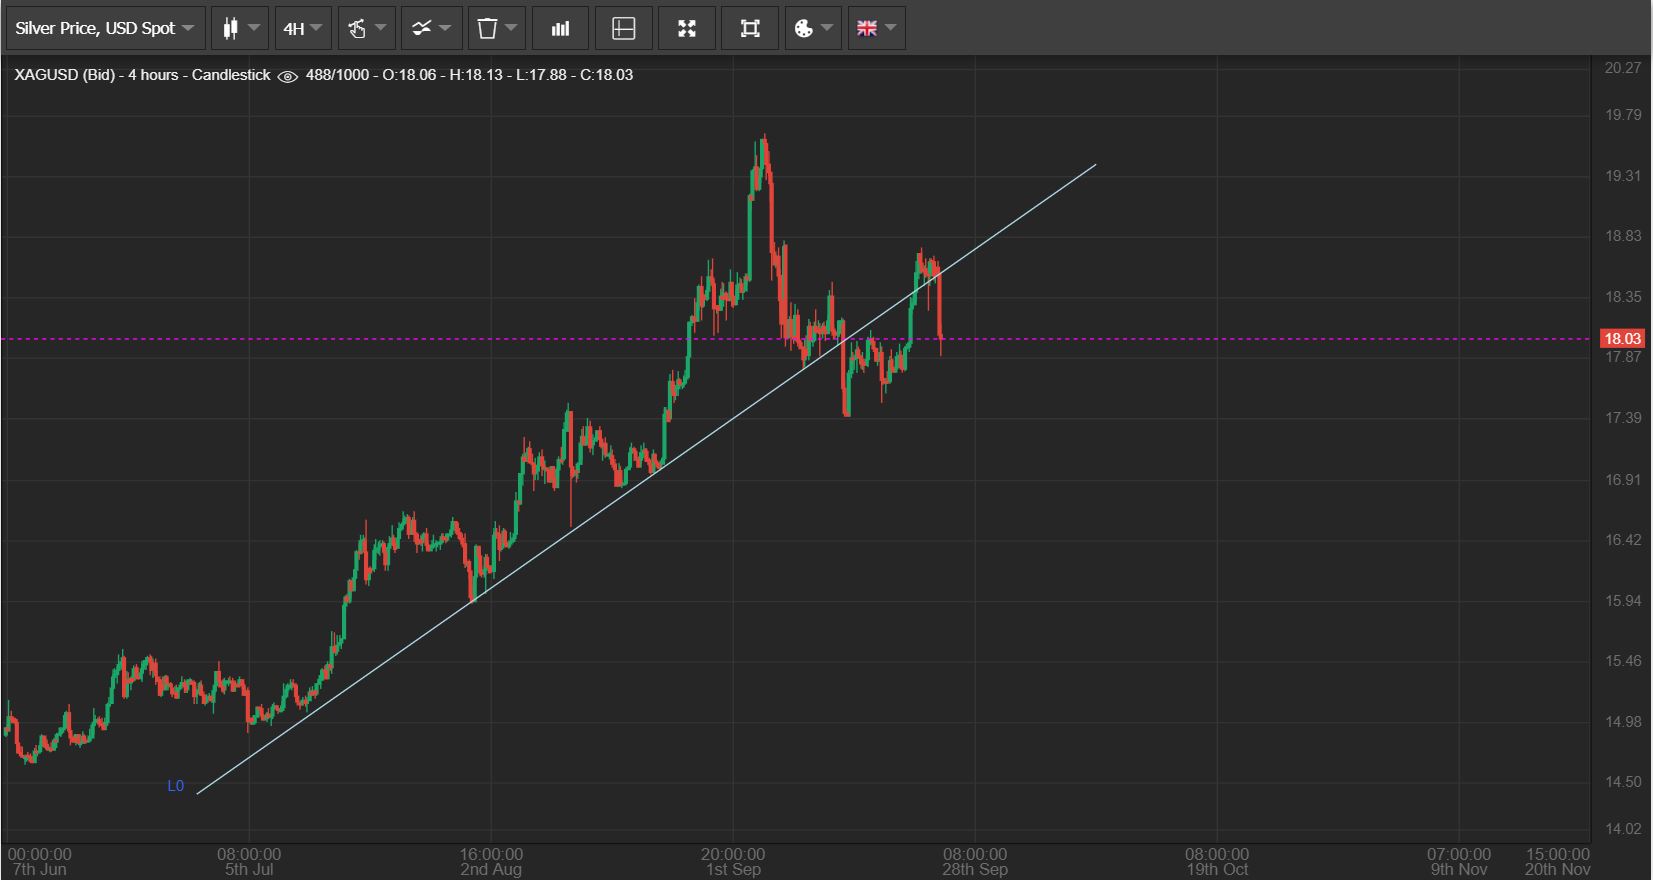
SILVER -Silver quickly sold down too.
.
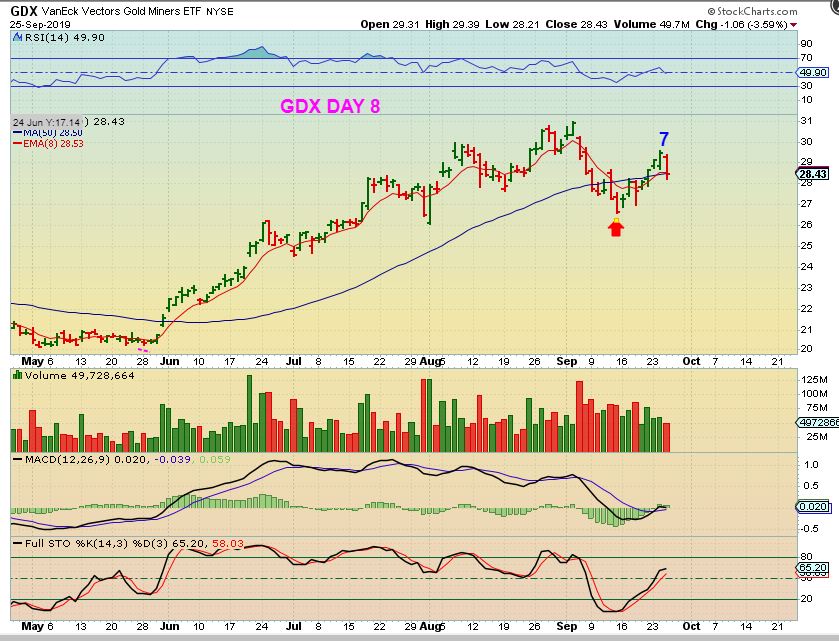
GDX #1 -Here we see GDX looking very good up to day 7. Day 8 brought a 3.6% drop that broke the 50sma. This could be a peak on day 7 as left translated …
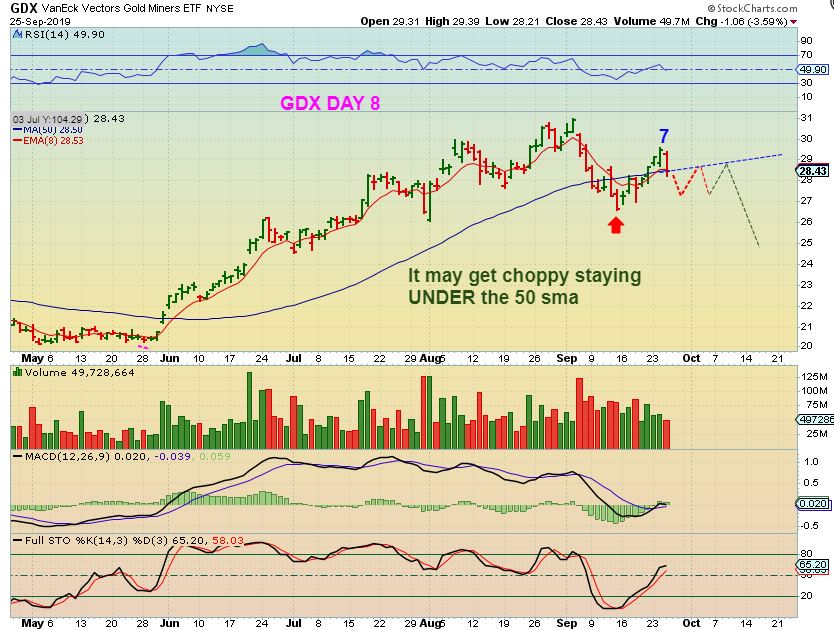
GDX #2 – Like I mentioned with Gold- It doesn’t have to sell off straight down yet, it can just chop around as shown, so going heavily short may be a bit tricky. A ‘starter position’ may work out if this drops below that 50sma. Also it has not closed below the 10sma, so this could bounce…
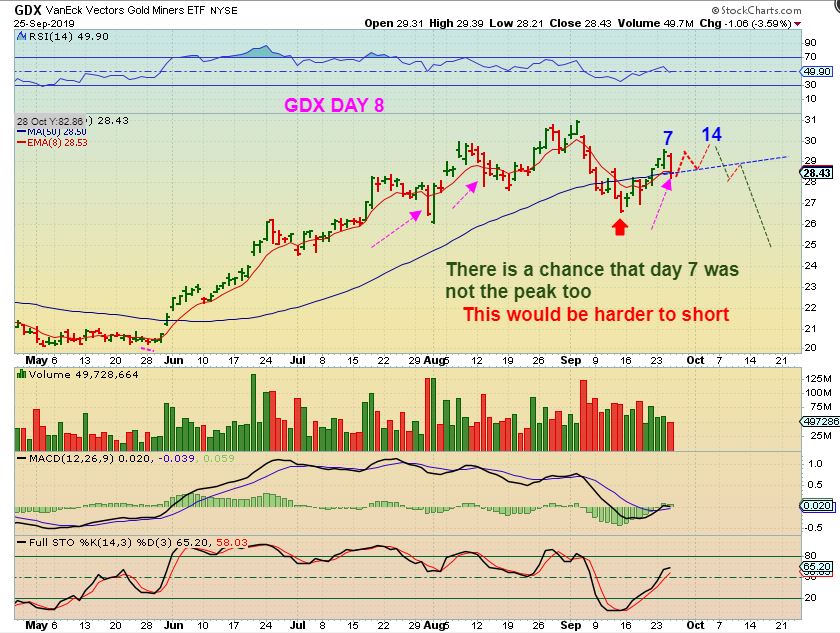
I am pointing this next chart out because if I say that I think we peaked on day 7, I don’t want anyone to automatically think something like, “Wow, a peak on day 7 means 20+ down days until we get to the next dcl, I should go heavily leveraged short”. It may not be 20 ‘down days’, since it can chop or…
GDX #3 -Since GDX has not closed below the 10 sma, this could be just a 1 day quick drop like we’ve seen in the past that recovers for a little bit longer, like a 1/2 cycle low. Day 8 may be too early to get HEAVILY short, so if you short a close below the 10 sma, it may be best to go lightly at first.
.
The General Markets could have a dcl forming on day 36.
I am hoping that Oil and Energy Stocks are finished pulling back so that we can get a 2nd leg higher. I’m seeing reversals near support, so I will put a couple of examples below.
Gold, Silver, & Miners are likely peaking on this late daily cycle. Gold has a MACD Kiss and closed under the 10 sma. GDX & GDXJ broke the 50 sma and several Miners looked bad all of a sudden. Many people are looking for a news event or a reason why the drop occurred, but we know what happens at this stage of the game, it is just getting late, an ICL is coming due. I cashed in all of my Miners except for EXK & BTE, but I bought a JDST hedge and will sell them if the Miners drop tomorrow. I may even sell them on a weak bounce and add to JDST, or add a Miner on a strong surge higher & cut JDST ( Less likely at this point). I take it one step at a time without a Bias.
.
NOTE: I recommended buying & holding Miners & even leverage right out of the ICL. I then mentioned holding your Miners for the first few daily cycles, just adding on dips. The run was strong so I even rode my Leverage all the way to the top. After cutting leverage, I still recommended holding a basket of miners through out the Bullish Run of the Intermediate Cycle because in a good bull run, surprises are to the upside. I also mentioned possibly buying stronger Miners like DRD, HMY, CDE, etc as individual performers. At this point, I now feel that this run may have peaked, so I cut my positions. I was able to lock in great gains, and will now wait for the next ICL if nothing changes. I even sold DRD, HL, CDE, etc., because it just feels like the end of the run. Surprises could be to the downside now in a drop to an ICL, and some of the losses in that kind of a drop can hurt. We can see bounces along the way, even as soon as Thursday, but as I watch things unfold, it looks like the peak of this daily cycle could be right here in this area.
.
Enjoy your Thursday trading!
.
~ALEX
.
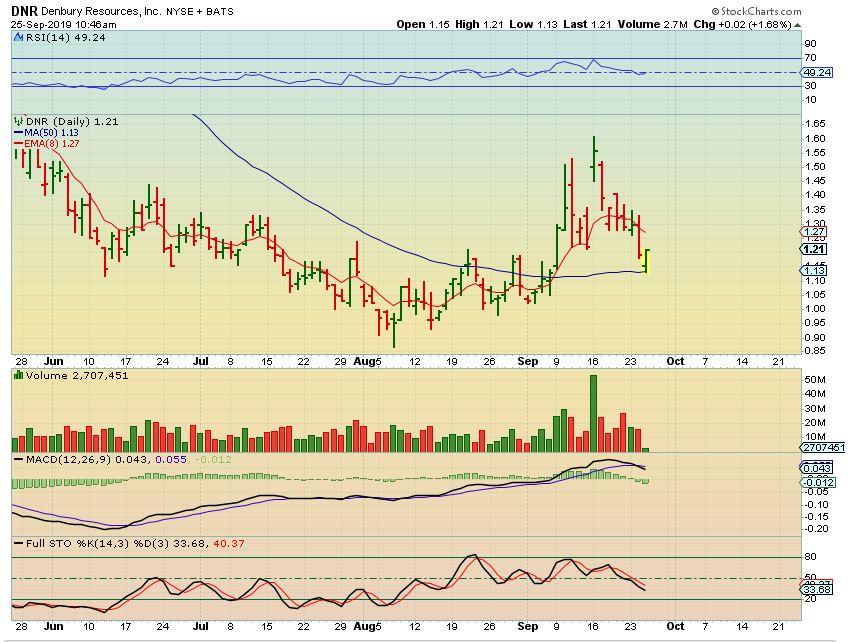
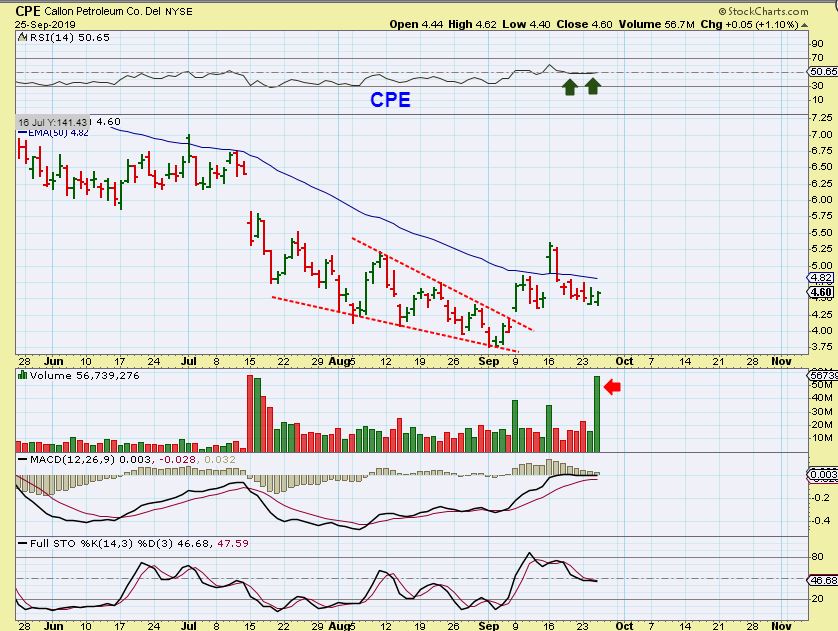
DNR – DNR reversed on the 50sma. If you start to see this or other Energy Stocks recovering their 50sma, the sector may be ready for another run higher. You can watch the oil stocks on your energy list like OAS, WTI, CPE, LPI, etc etc.
CPE – I thought that this was an interesting looking chart, with the higher volume pops. A move above the 50sma would be bullish, but I might take a position here if it continues to act correctly.
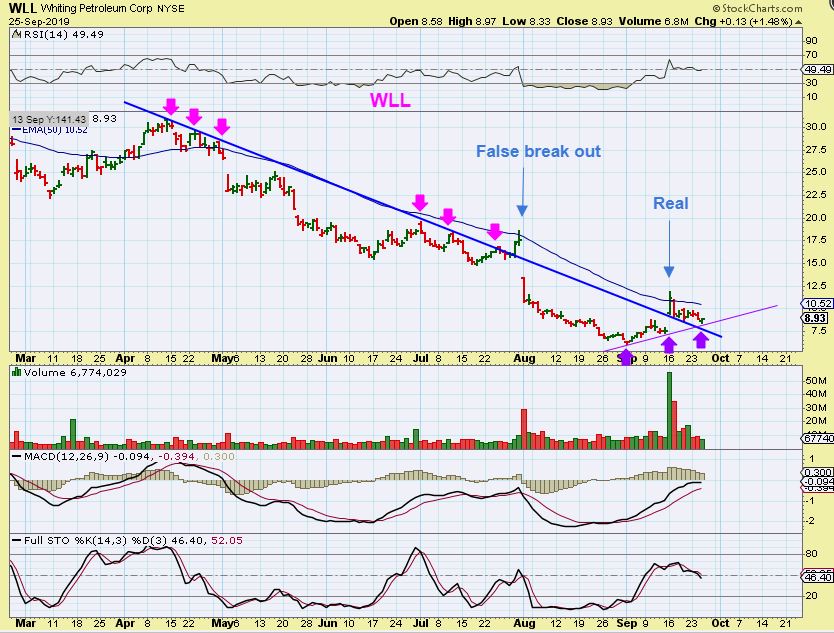
WLL – look at WLL with the 34 sma, which was previously acting as resistance. It broke out Sept 16th, and reversed right on that 34 sma twice. Buy with a tight stop if Oil holds up. And…
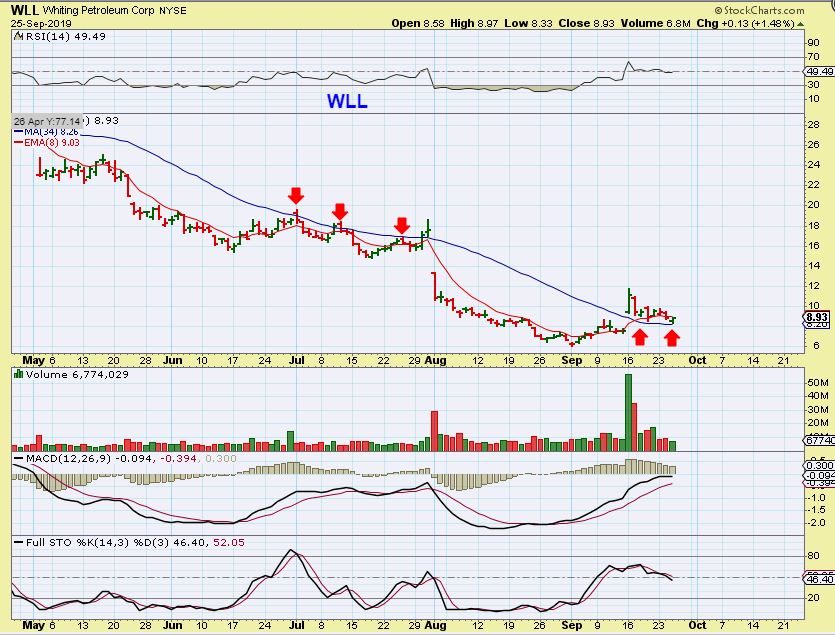
WLL – This is a more detailed view showing that it also broke above a down trend line & has held above that line on the pull back too. We also see a lower trend line in purple as support.