
September 1st Weekend Review
Thank you for your patience this weekend as we updated and performed some maintenance on the website.
.
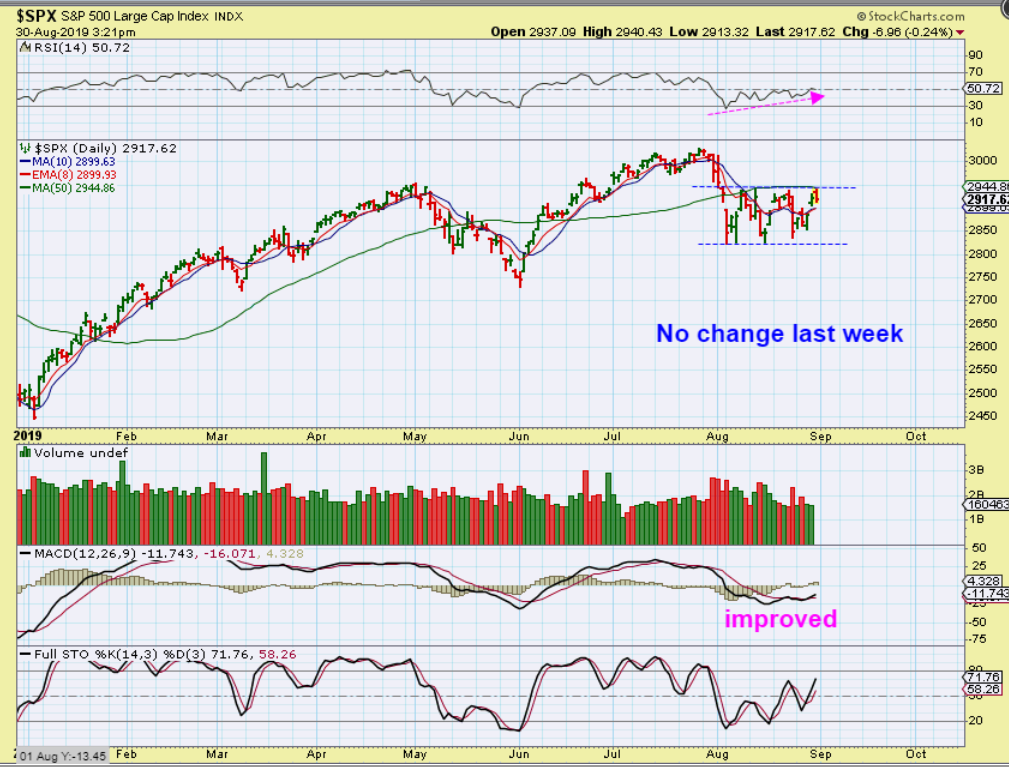
SPX – The SPX was again rejected at the 50 sma & top of this trading range. Slowly I am seeing signs of improvement, so we’ll see if this drops all the way to lower support this time, or can it even break higher next week.
.
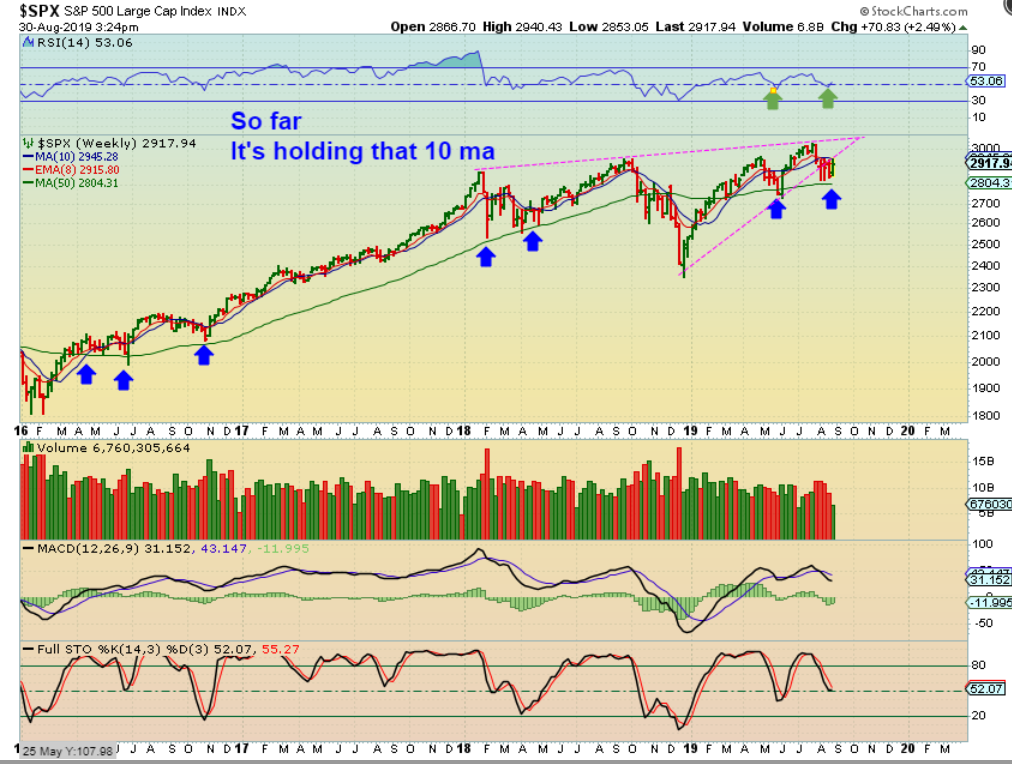
SPX WEEKLY– Price is climbing the back test so far, but notice the Green Line & Blue arrows. That lower green arrow is a support for this trading range , so that range is important going forward.
.
TRAN – The Transports are actually under that green line that was support (blue arrows) and trapped in a large wedge.
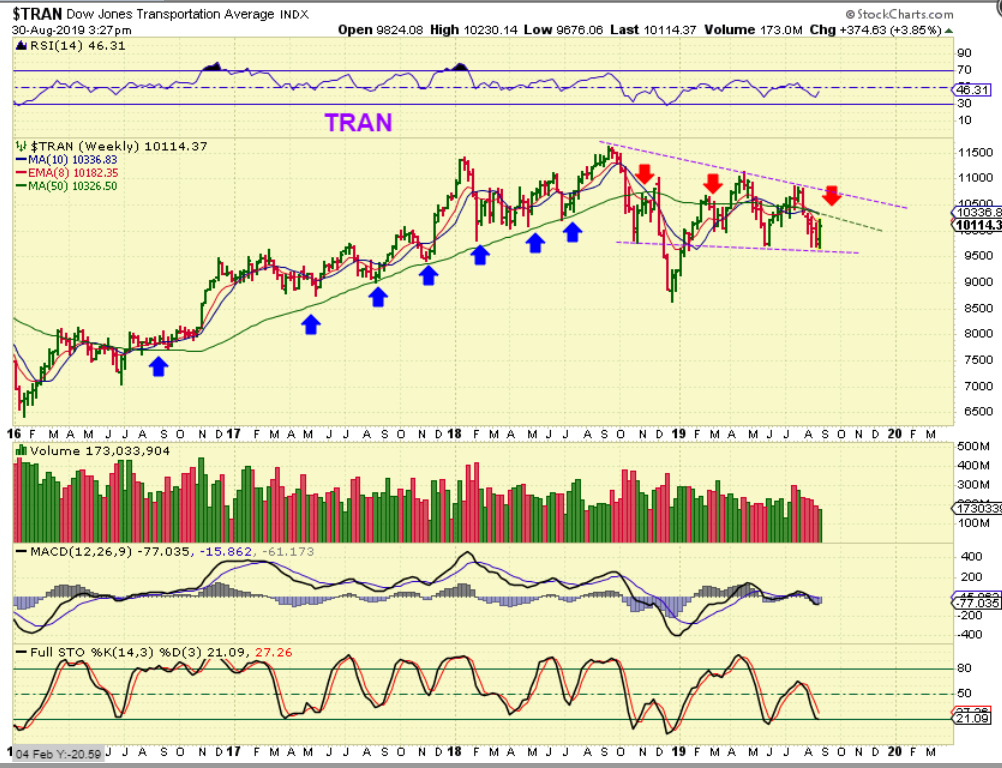
The next FOMC Mtg is 2 weeks from Wednesday. and we MIGHT just stay choppy and range bound until then.
.
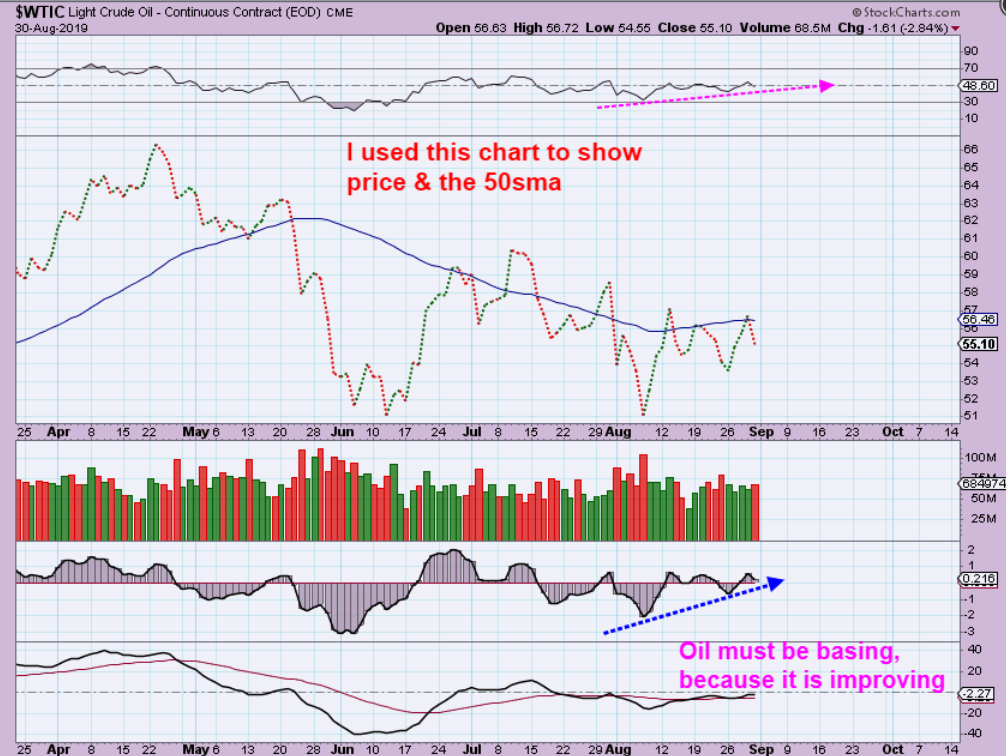
WTIC – Oil looks good one day, and bad the next, breaking above & then back below that 50sma. The indicators do look to be improving here though, so overall it seemed more Bullish than bearish, but choppy markets are often frustrating for buy & hold trading. Read the Chart
.
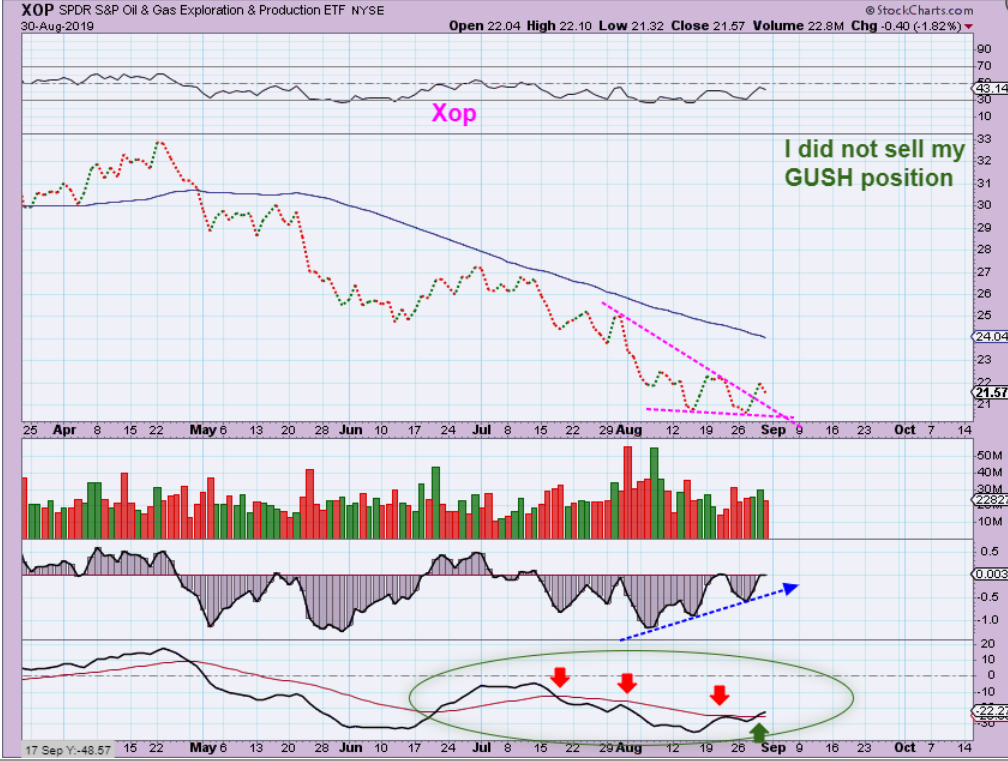
XOP – I said that I sold some Miners ( at least partially on some) and started looking at the Oil /Energy sector for opportunity. I bought GUSH at $3, and it rallied Thursday, but gave it almost all back Friday. I did not sell, but using the line-chart below, this looks like it could possibly triple bottom lows on a back test. Again, I like the internals so I held on.
.
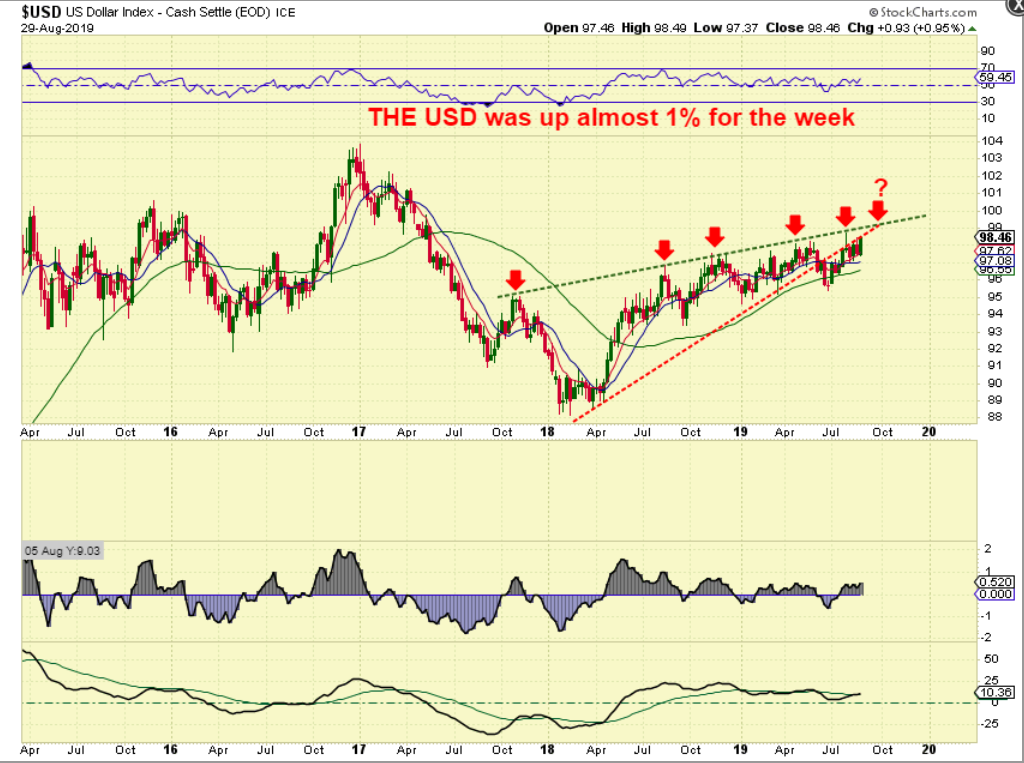
USD #1 – The USD has actually been bullish. I have drawn this wedge, and I want to point something out. THIS WEDGE shows a break down & back test- but it can run higher ( see the chart).
.
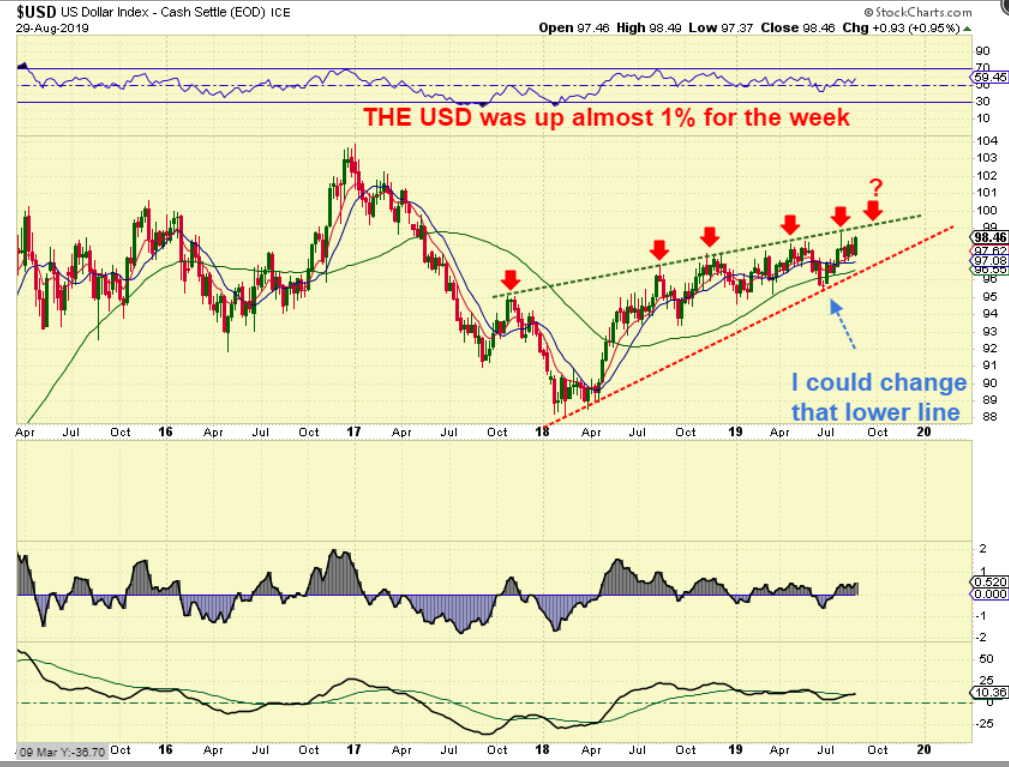
USD #2 – I dropped that lower trend line down and this wedge is also possible. It is bigger at the apex and could drag on. EITHER WAY It is noteworthy that the rise in the USD has not hurt the precious Metals.
.
I’M LONG TERM BULLISH- BUT LAST WEEK I MENTIONED THAT IT IS TIME TO BE A BIT MORE CAUTIOUS:
.
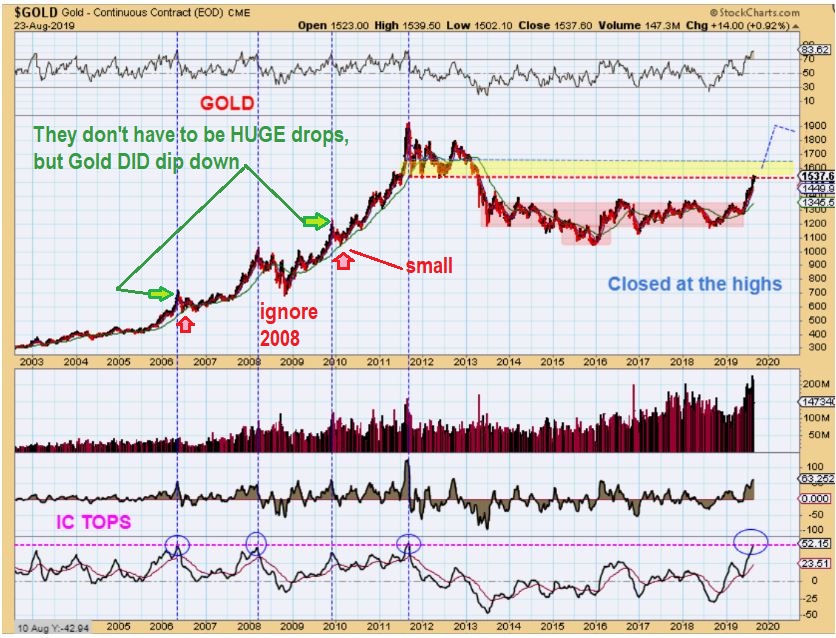
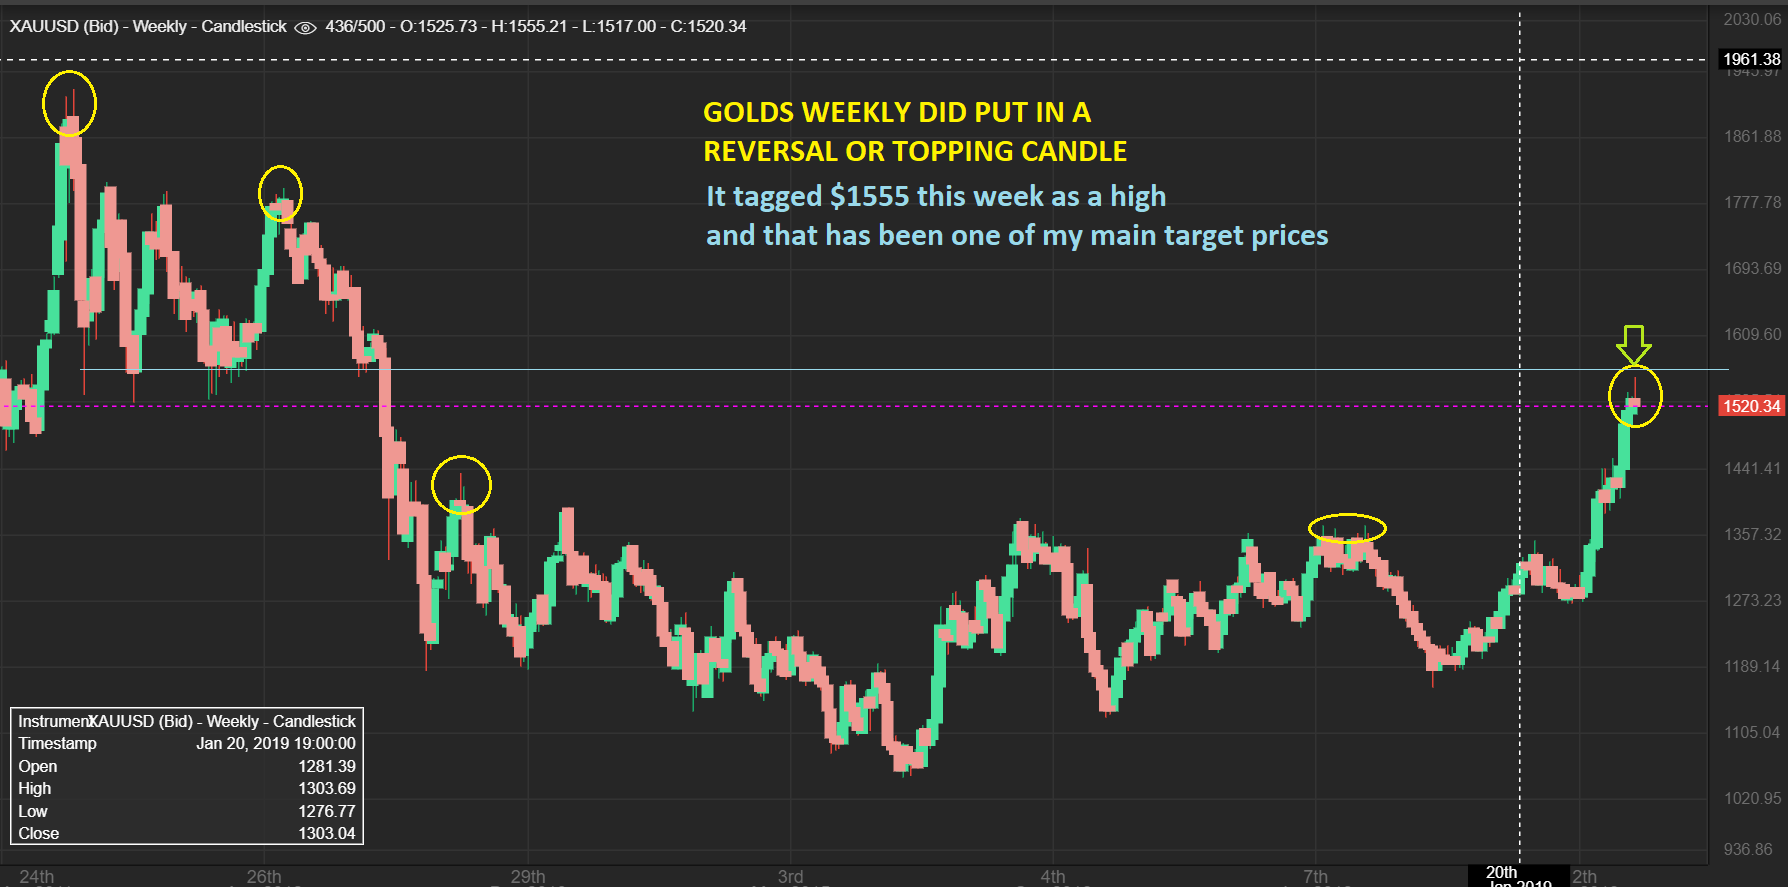
GOLD WEEKLY – Last week I used this chart and I mentioned that Gold could have another up week, but I thought that it was near a temporary ‘peak’, due to these indicators now tagging out where prior highs did (Bull market highs) .
.
GOLD WEEKLY -This week Gold tagged the $1555 target ( I’ve been calling for $1550 to maybe $1600 for a long time) and price tagged it & reversed. That MIGHT be a temporary top. Please read the chart.
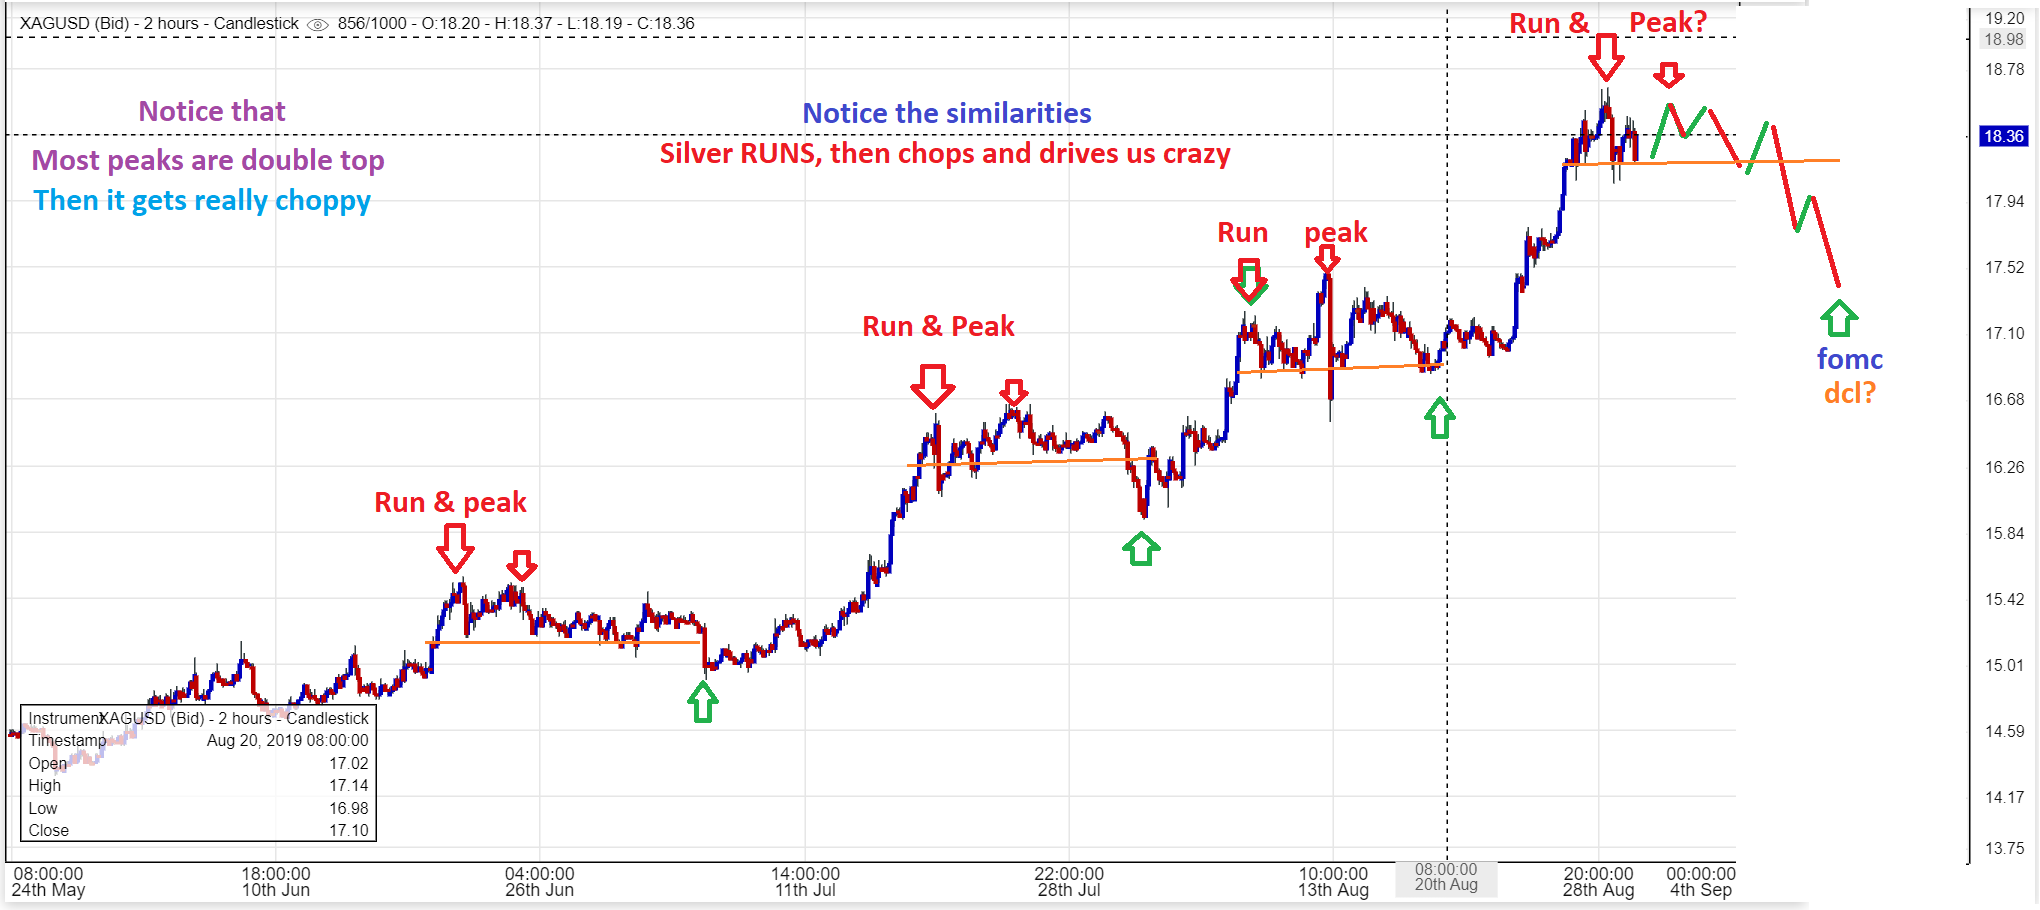
SILVER – The 2 hr chart of Silver looks very similar in areas where it has topped ( short term top). Notice the Run to a peak, a little double top forms, & it goes sideways & choppy. Read the chart…
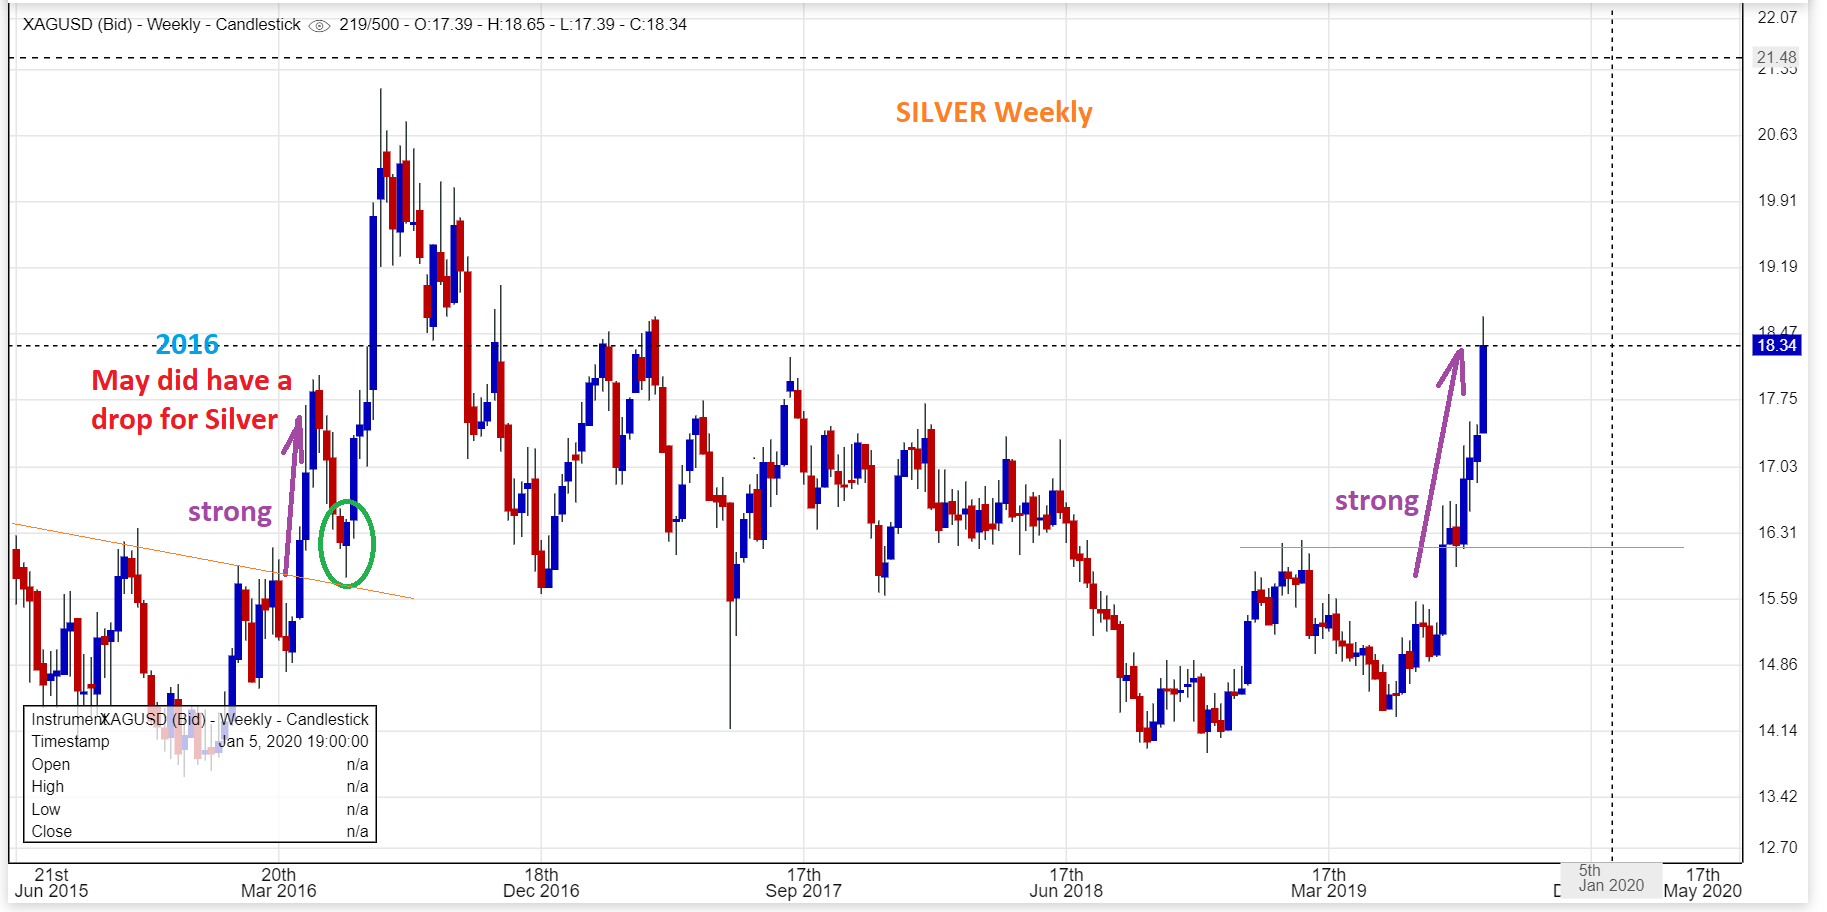
SILVER WEEKLY – The weekly chart has a wick. The body was Long , so it may not be a topping candle, but the wick may indicate that the sideways choppiness in the above chart is coming.
.
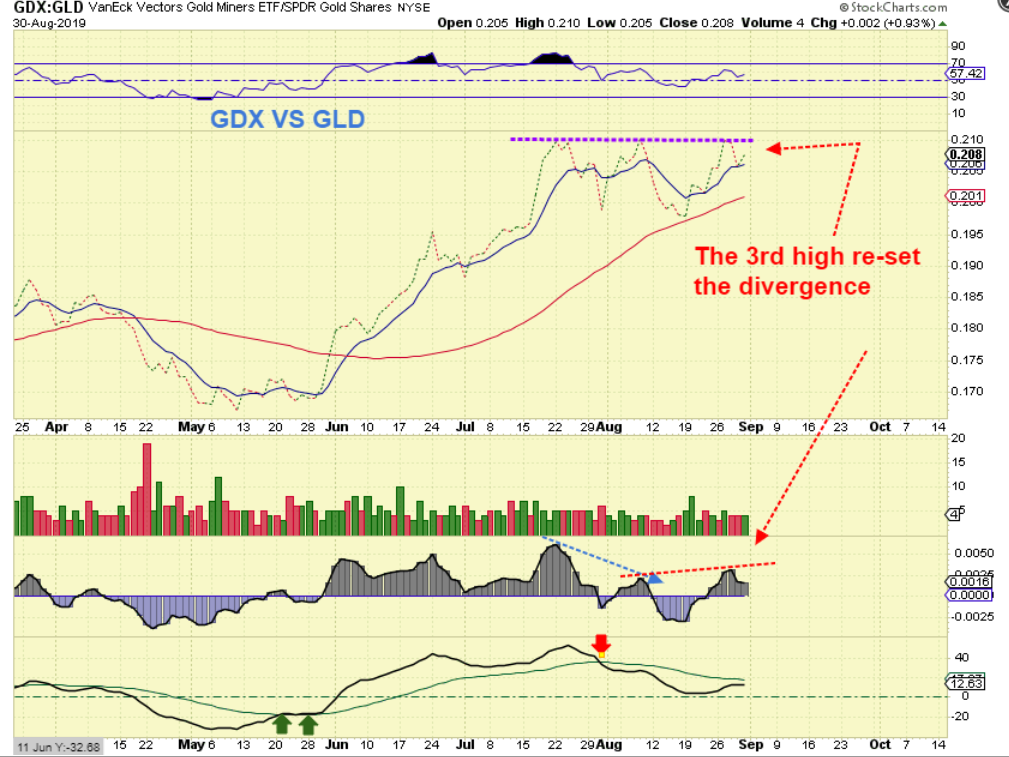
GDX / GLD – The GDX/ GLD ratio has chopped sideways. I thought that it may be topping with the double top & divergence, but so far it is just showing up as sideways consolidation.
.
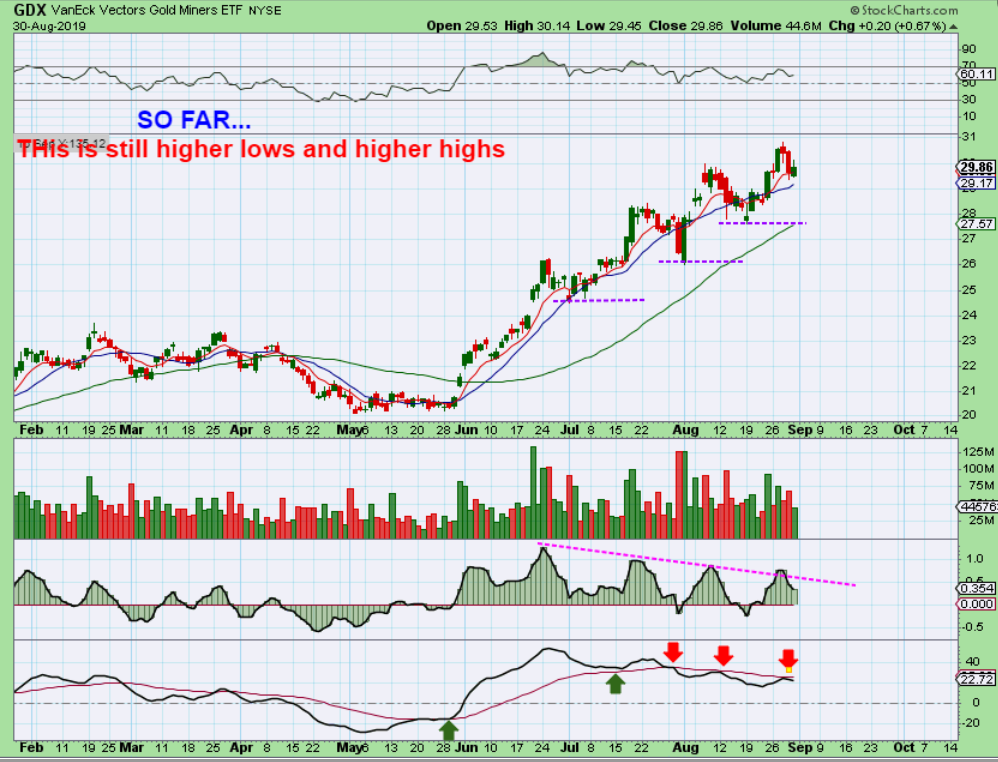
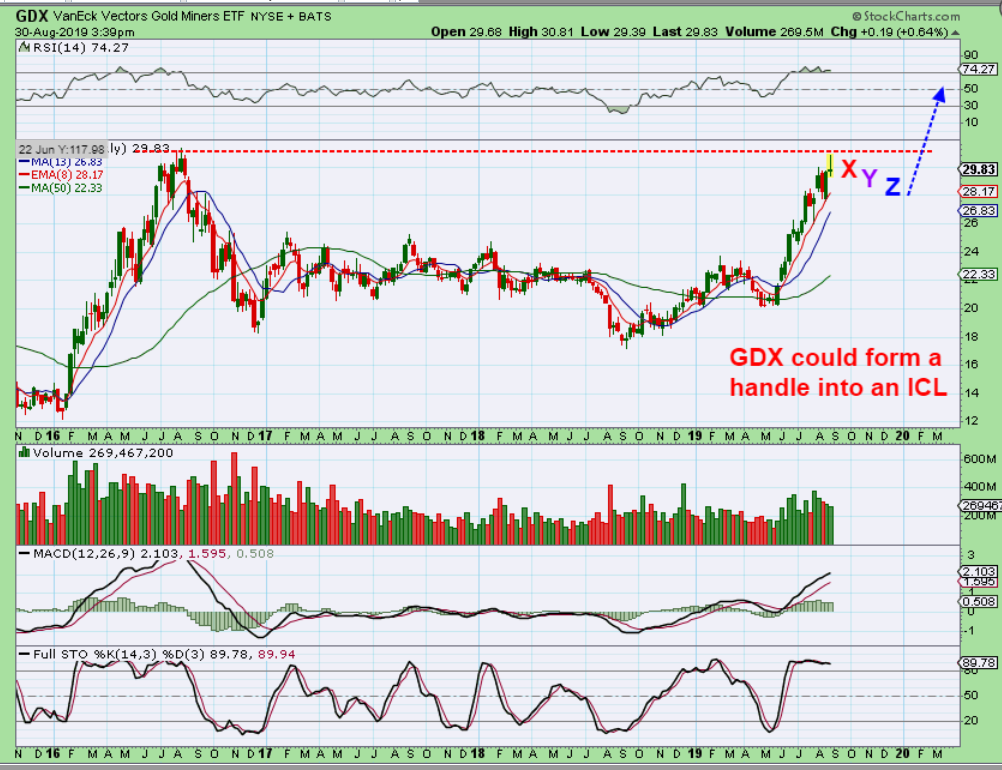
GDX #1 – This a a basic chart where you would ” Raise your stop to the last higher low” , but I want to dig a bit deeper than that though..
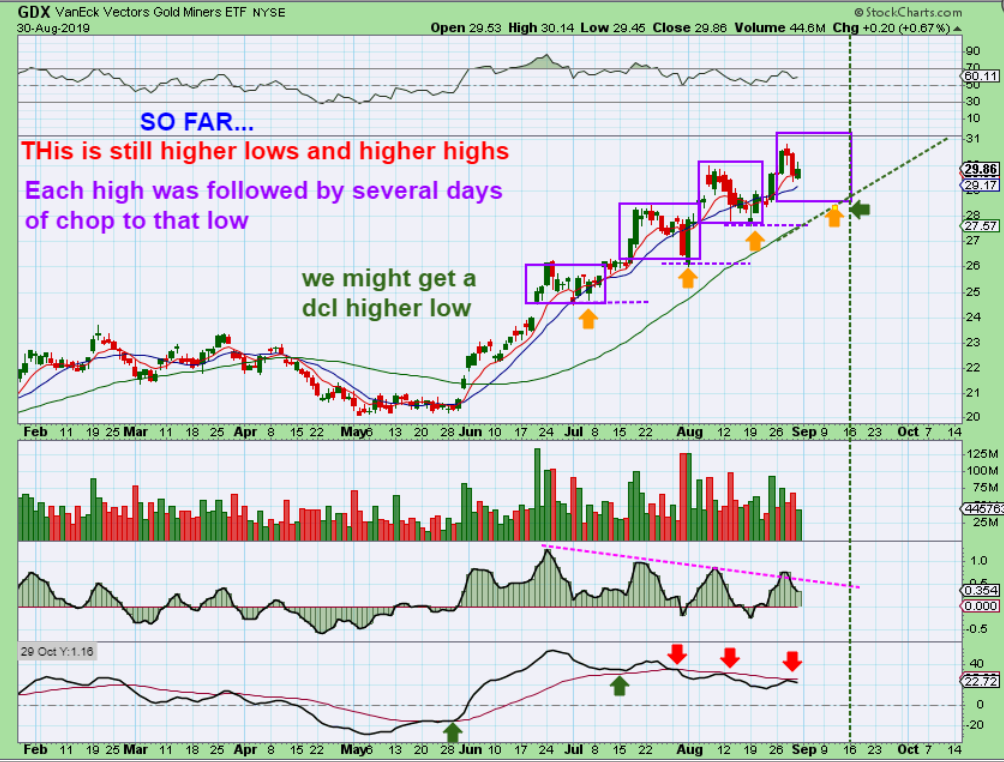
GDX#2 -Notice the box formations of consolidation. We may see a consolidation to our next dcl, it is hard to tell.
.
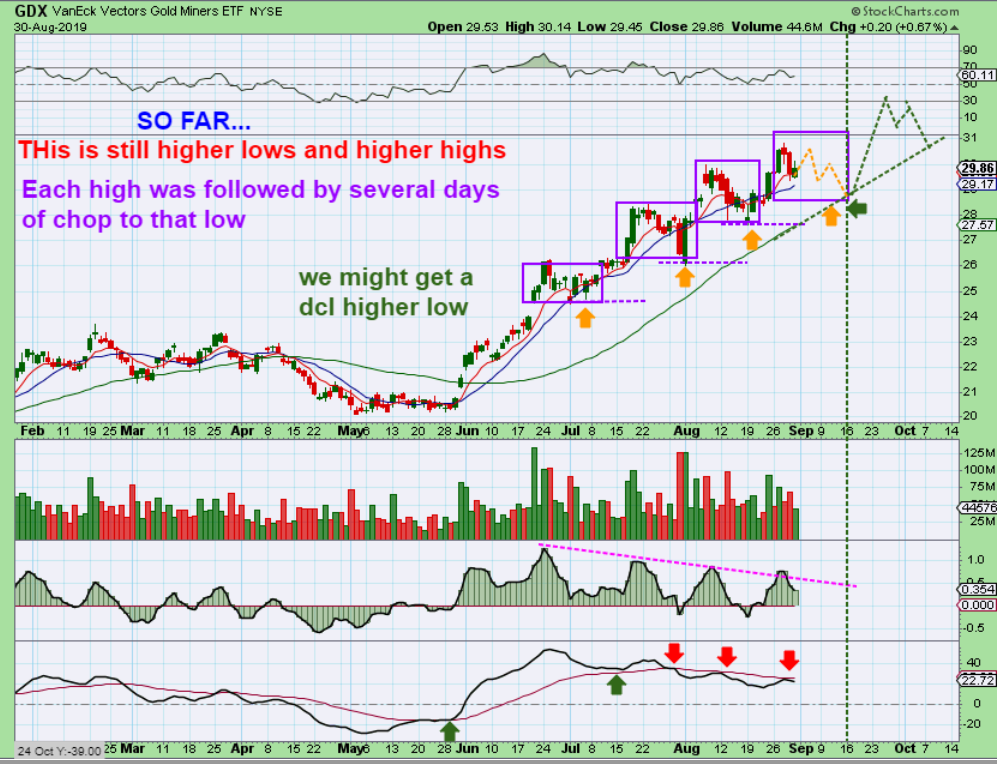
GDX#3 – Though I think we may have seen a top short term, if we are only dipping into a dcl and not an ICL, GDX can just chop sideways & downward to the FOMC Mtg ( The vertical line on the chart) , without breaking the last higher low. This is why I hold a basket of Miners, HOWEVER…
HOWEVER, BE PATIENT THIS TIME BUYING THE DIPS, THE WEEKLY CHART LOOKS LIKE A TOP. LET’s DISCUSS THIS…
.
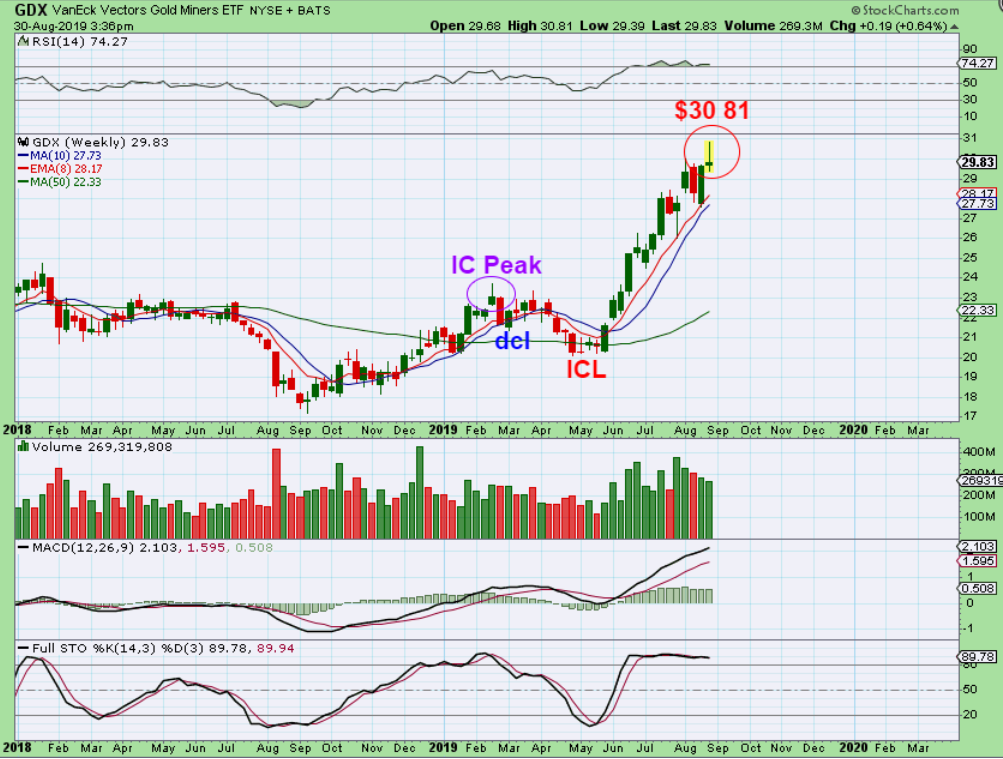
GDX WEEKLY #1 – For me, GDX hit my $31 target last week and this could be the top? GDX hit $30.81, so it was 19 cents below $31 and that is a weekly reversal candle too. A DROP to the red & blue line would be similar to the Feb Peak & drop into a dcl/. That’s $27.50-$28.
.
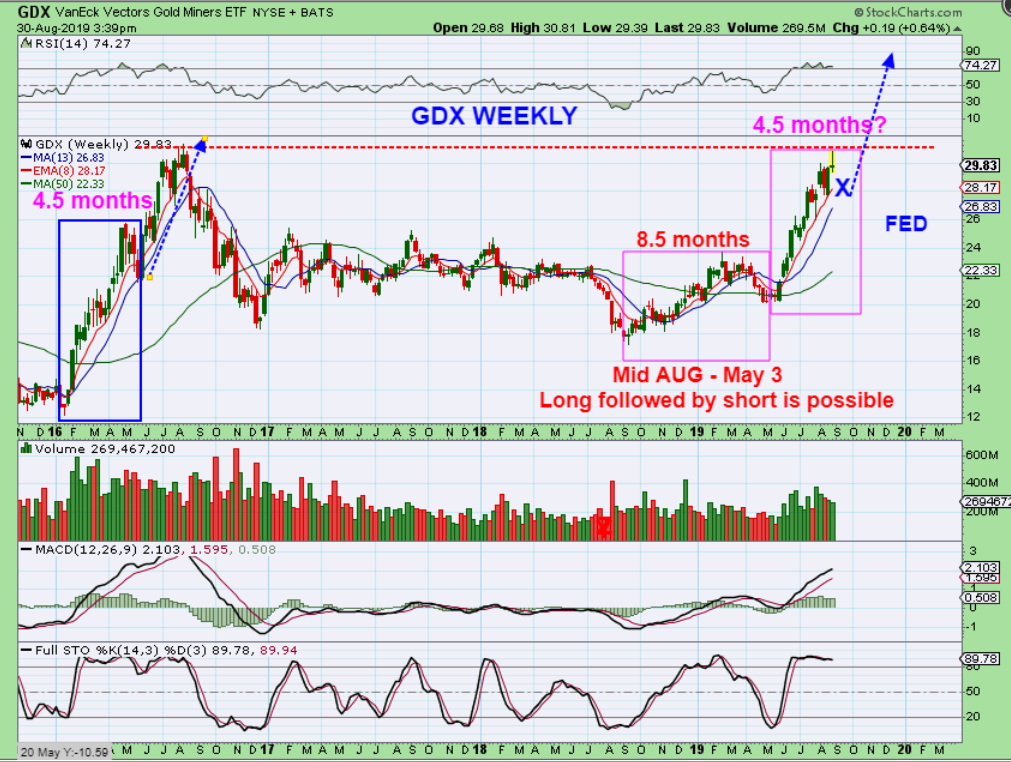
GDX WEEKLY #2 – A drop into a dcl, and then an ICL later could give us a handle like this. So this is a valid idea, but what If I compare it to 2016?…
.
GDX WEEKLY #3 – When we look at the ICL in May of 2016, GDX peaked & dropped for just 2-3 weeks into an ICL (that was 4.5 months blue box). The FOMC MTG is 4.5 months from the May ICL and we also just had a very long intermediate cycle of 8.5 months, so is this next one a shorter one to balance that out? Quite possibly, so I will be watching for that.
.
As I write the report Sunday night, GOLD has popped up $10 at the open. That seems great, but it is still only at $1529, and that is still $26 below the peak. The markets are closed on Monday in the U.S., Canada, and possibly other areas that I am not aware of, so our Miners will not gain the benefit of this initial push higher at this point.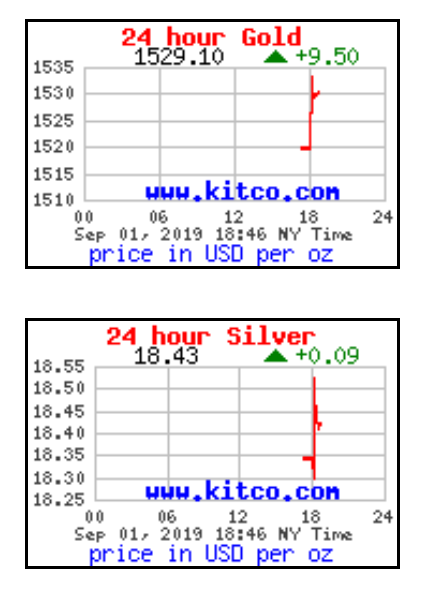
We all know that a lot can happen in the markets between now & Tuesday, so we’ll just have to wait and see where things are at that point, as we near the open for trading.
.
Enjoy the rest of your weekend!
.
~ALEX
.
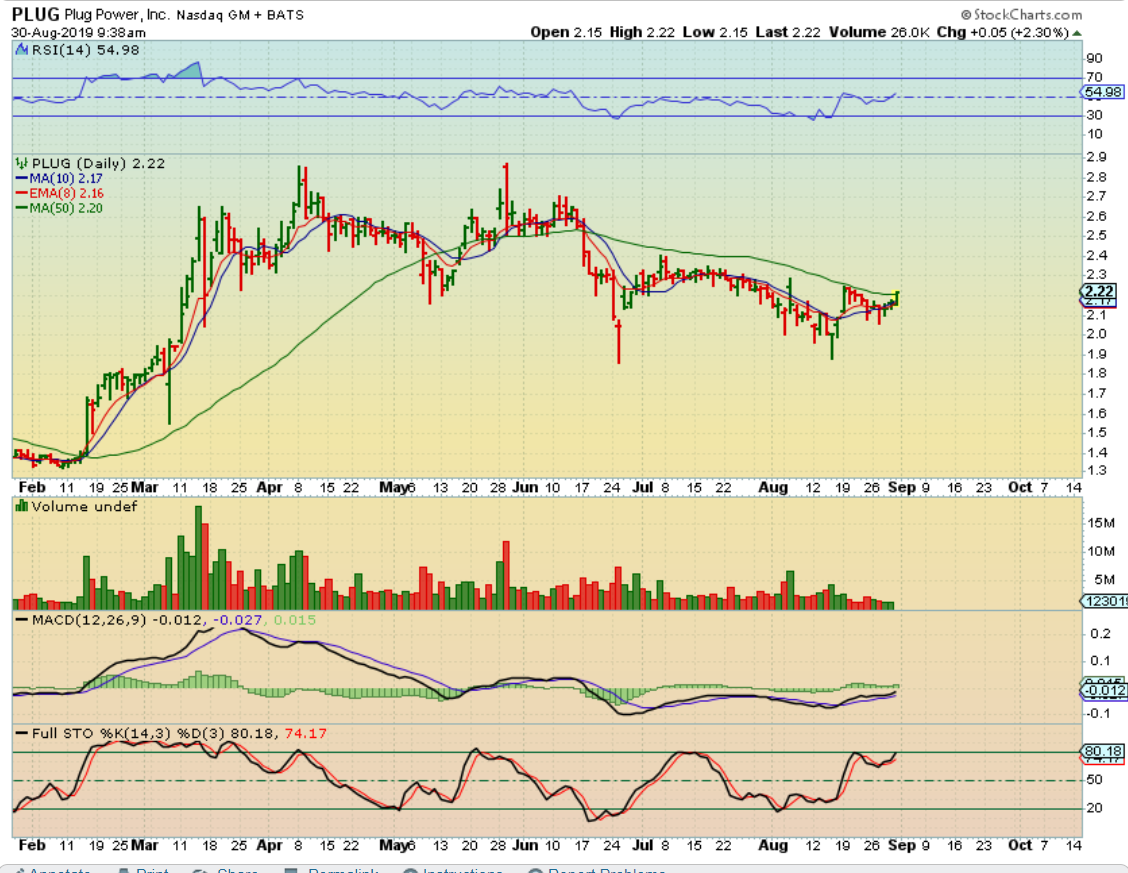
PLUG – I bought PLUG as it broke the 50sma, and then it closed UNDER the 50sma. I didn’t sell. I like the set up enough to give it another day or 2.
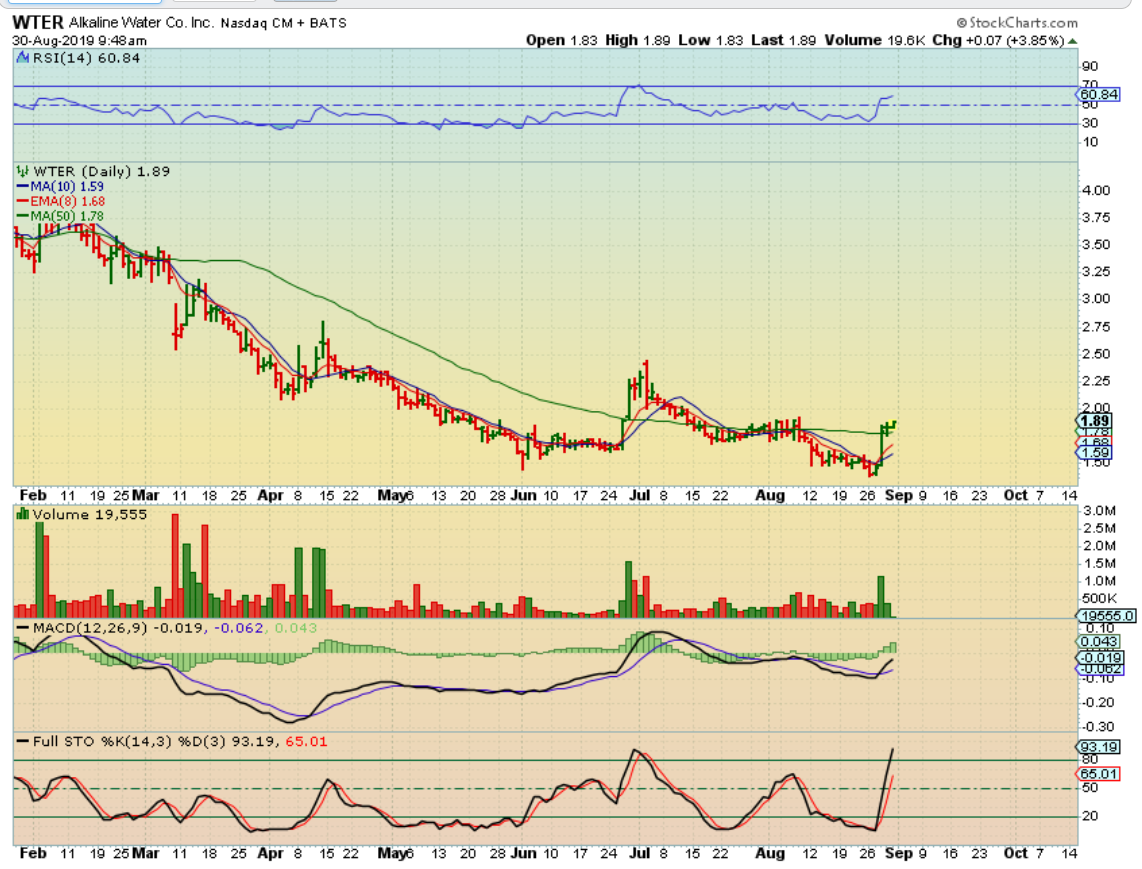
WTER – I also mentioned that I bought WTER flagging near the 50sma . THIS ONE moved higher by 10% , and I didn’t sell.
I also own WTI, GUSH and need to see some improvement in those if they are to stay in the portfolio. Cya Tuesday morning!

