Friday Sept 6th
Today is Friday and this is the last trading day of the week. I’m going to start the report with 3 charts from yesterdays report, and then we’ll see what happened as Thursday played out.
.
In yesterdays report I mentioned…
.
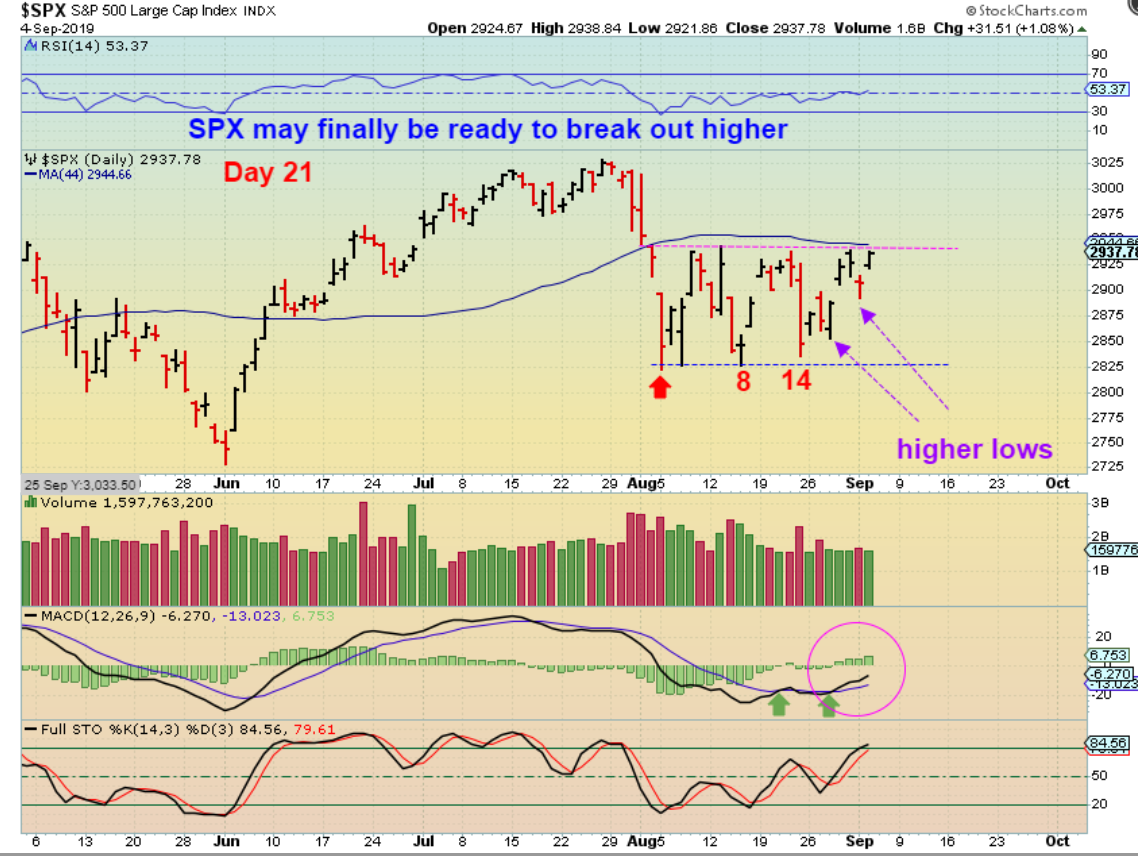
SPX – The MACD is bullish and we are no longer dropping to the bottom of the trading range, so with mini-higher lows, this could be preparing to break out. As day 21, I’m not sure how high this run would be able to go before a dip into a DCL would come due. ( Fed Mtg?).
.
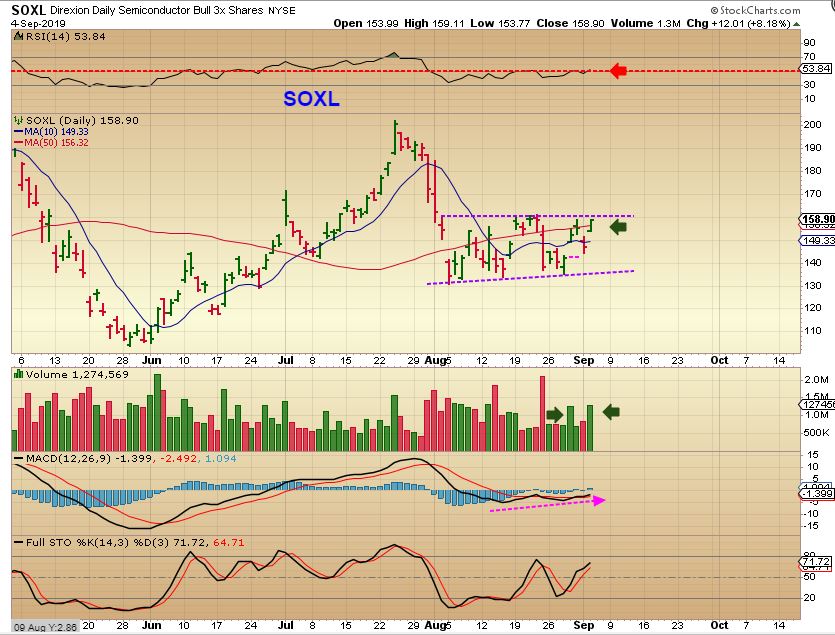
SOX – With the volume increasing on the upside push, the SOX ( SOXL used for volume) may be leading the way, after dropping to a gap fill Tuesday and breaking above that 50sma Wednesday.
.
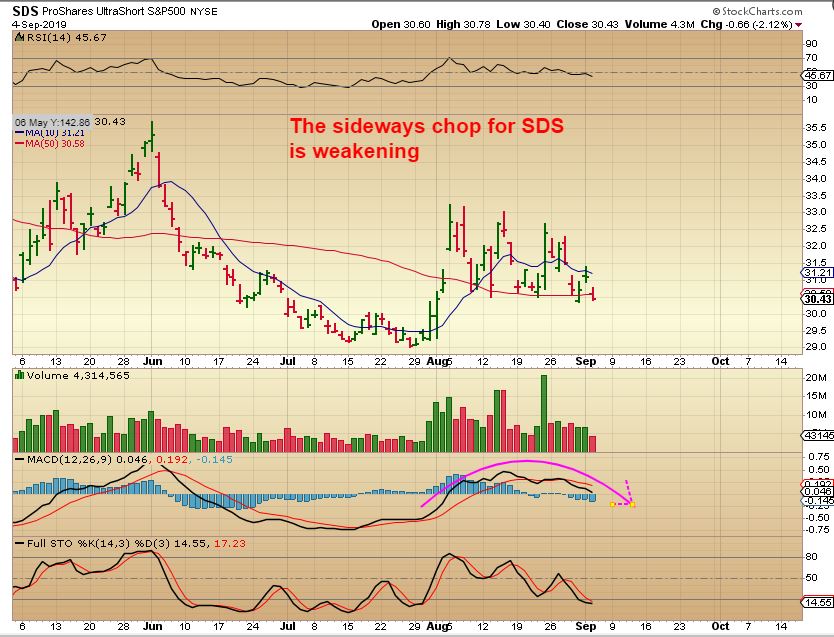
SDS – Also we have the inverse S&P 500 , an it looks like the sideways consolidation here is weakening. This could double bottom and the SPX could double top.
.
So we would expect a break higher and that could become a trigger to go long, HOWEVER…
SPX – With a Gap open, it becomes difficult for many to just go long. If you went long ahead of time with the ‘higher lows’ & slow improvement that I was mentioning- you did great. If you didn’t go long yet, the concern can become, “Will the gap fill or not?” Well, here on this chart I am pointing past Gaps that did not fill right away, and this gap may not fill right away either. With that gap, I did not go long the Market ETFS ( SOXL, TQQQ, UPRO, etc).
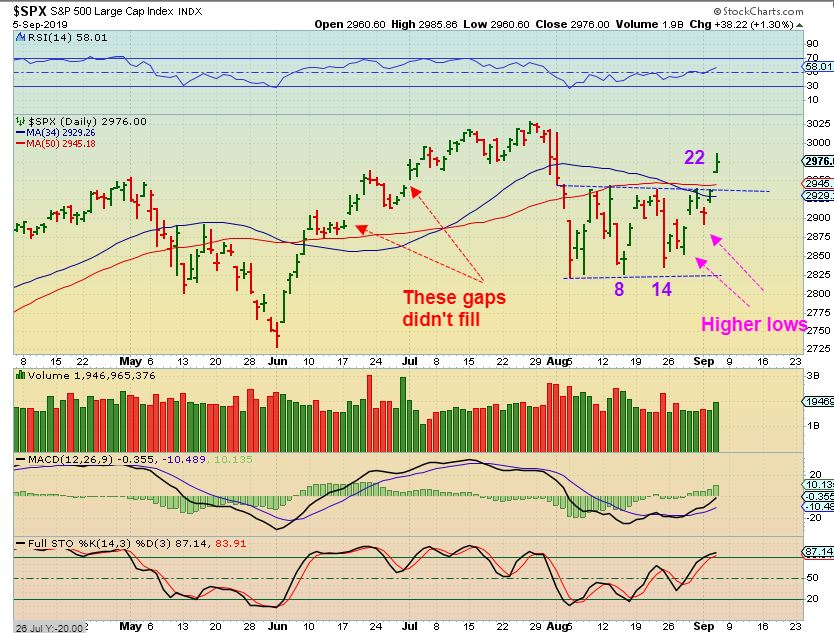
So that gap is making it tough to enter unless you entered the trade ahead of the break out. Some stocks may be long candidates, but that gap made it difficult for me to just jump in, since I didnt take position ahead of time with the improving set up. You still could buy with a stop under the gap or the break out, but I chose to stay with ‘Energy’ and my ‘basket of Miners’ for now. I am also keeping in mind that a nice buy opportunity should come up in Miners next dcl or ICL.
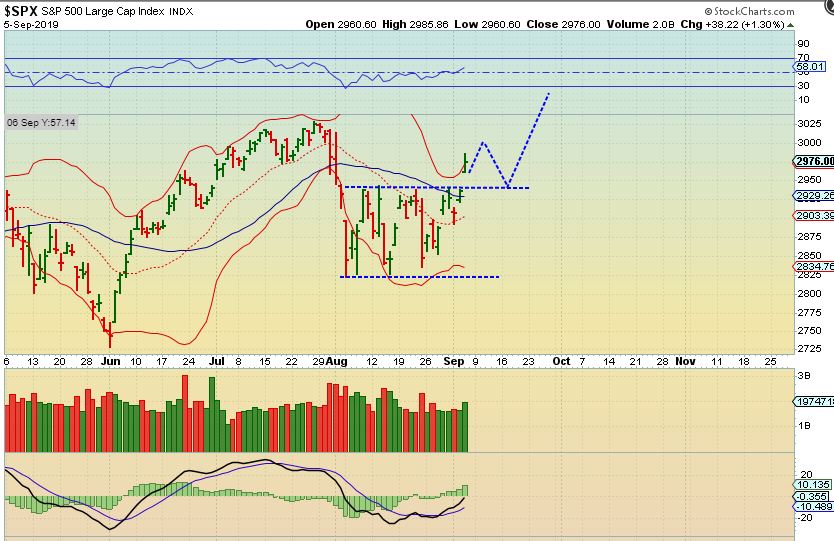
SPX – If I see something like this next week, it may offer a low risk entry into too.
.
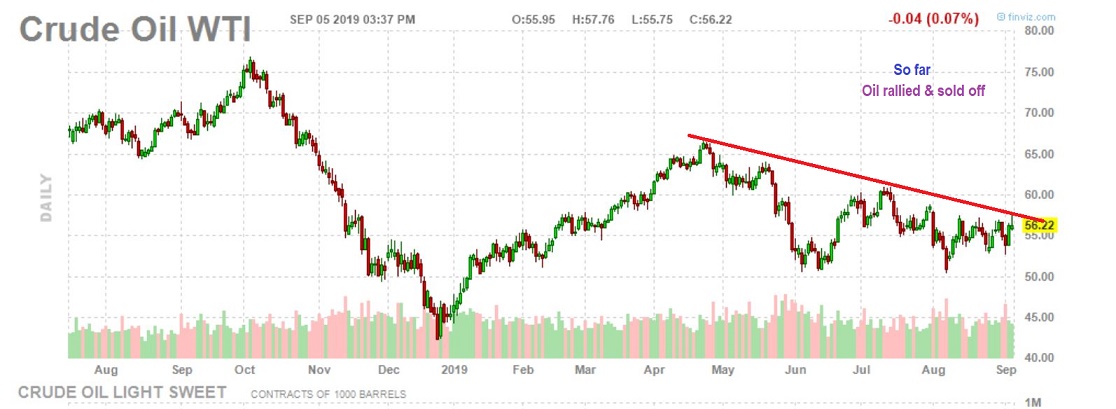
WTIC – I was watching for Oil to break out and after the inventory report was released, Oil ran higher, AND THEN REVERSED AGAIN. 🙁 I posted this in the comments…
.
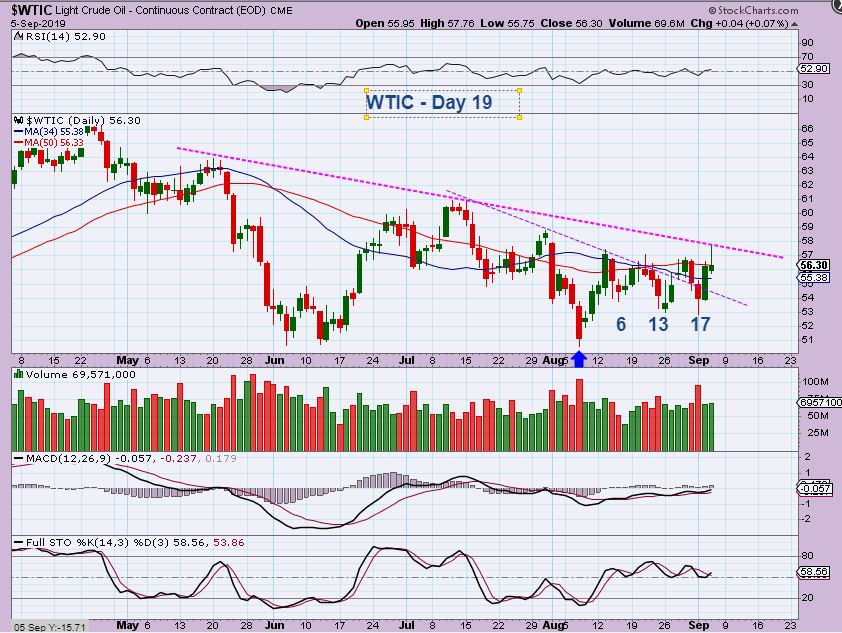
WTIC – Oil could not hold gains and I was long GUSH from $3, so I stated in the comments that I was selling around $3.50 to be safe & lock in gains. I still hold WTI, PLUG, and . for now. I want to see if Oil can break out, but it may just continue to bounce around in this base.
.
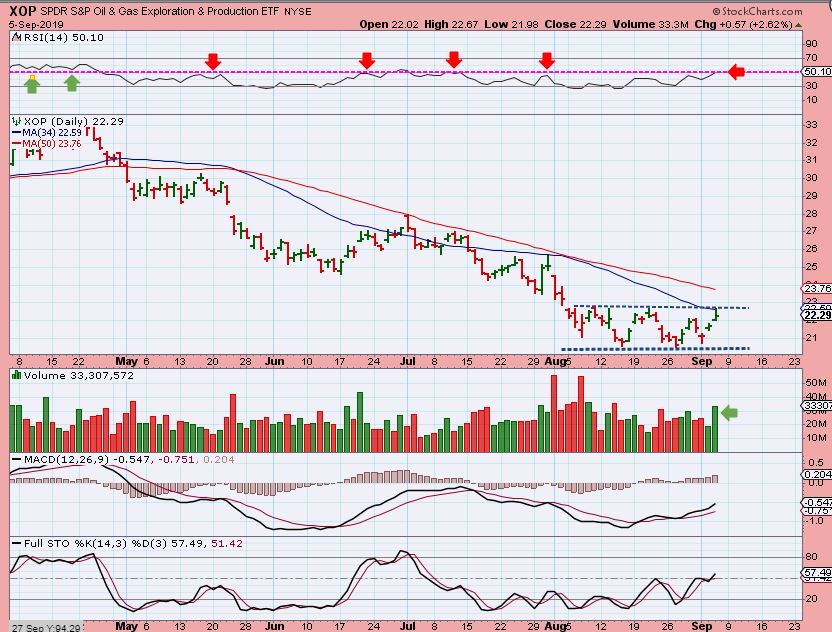
XOP – XOP ran to the 34 sma & sold back down a bit. It also has a trading range possibly forming a base. I sold my GUSH here and may re-buy later.
.
THIS CHART IS FROM WEDNESDAY NIGHTS REPORT:
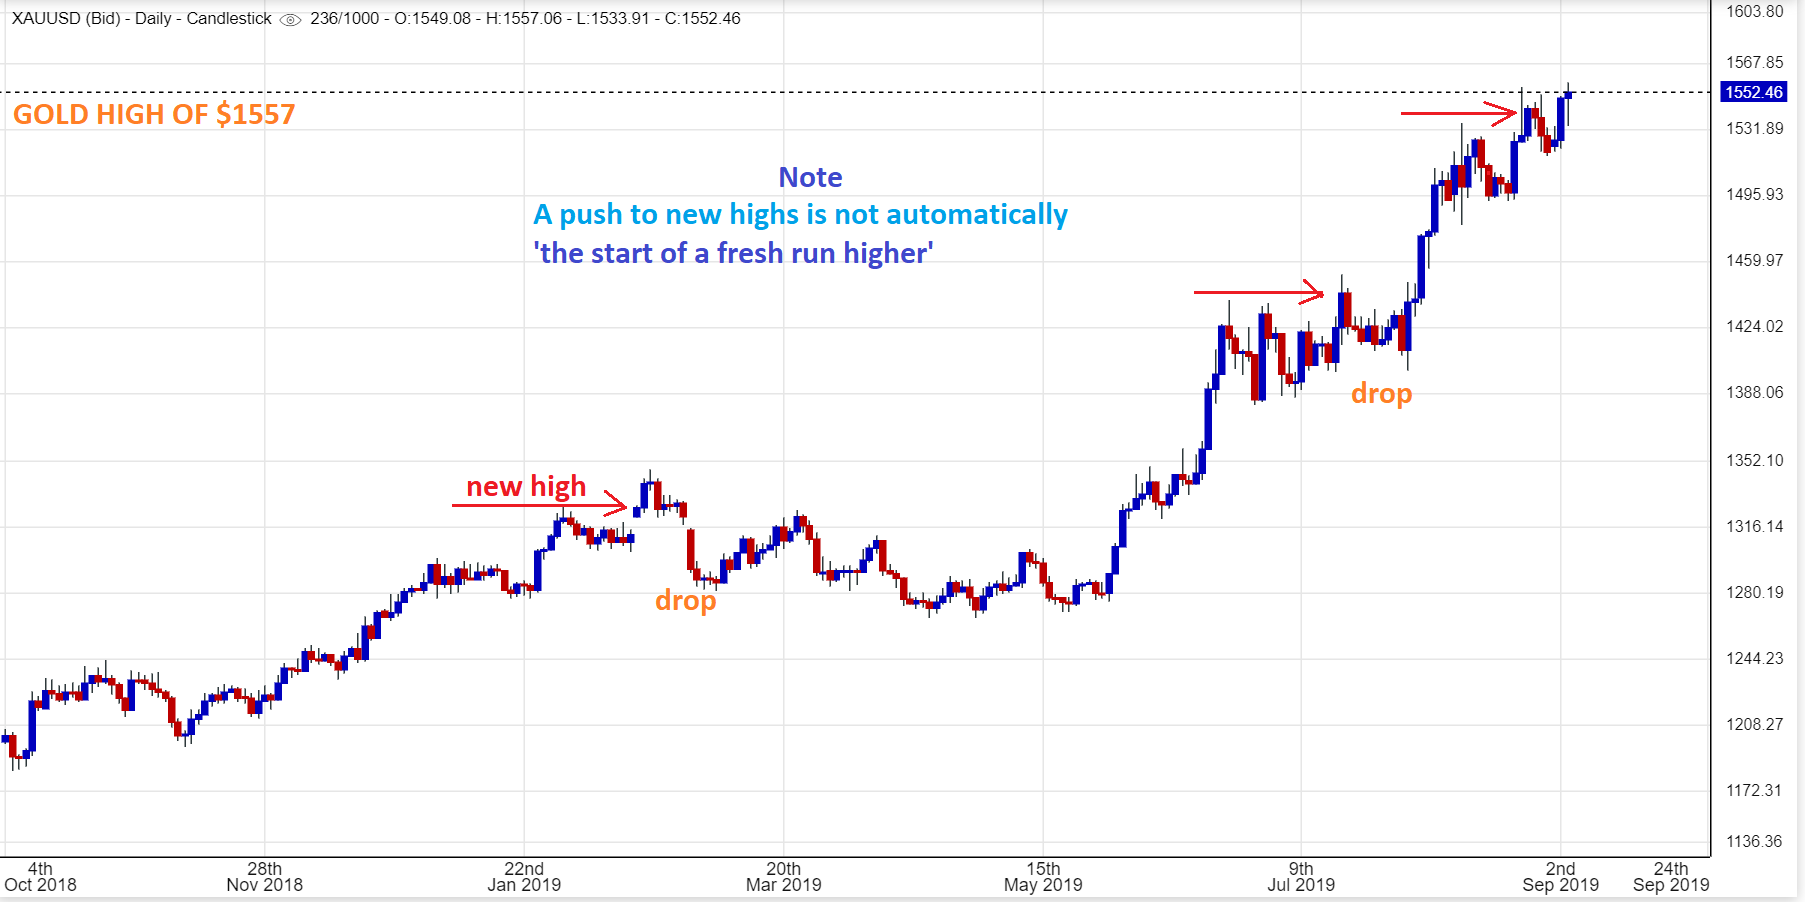
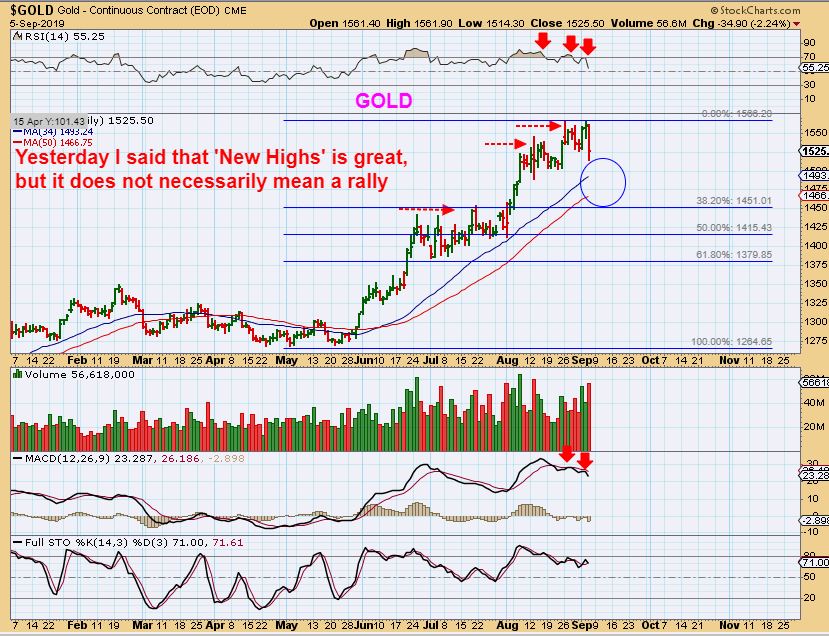
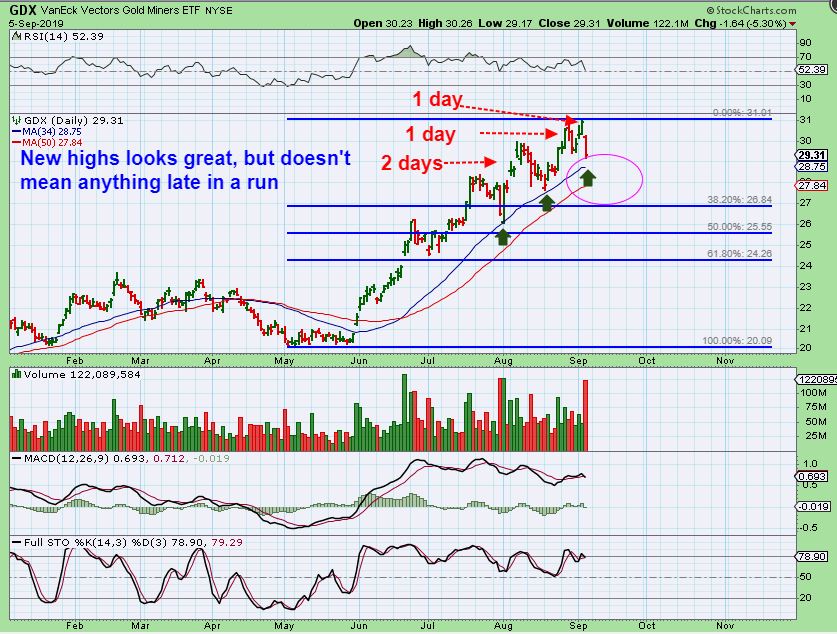
GOLD – Gold & Silver pushed a bit higher to new highs on Wednesday. I know that that is exciting, and this COULD keep climbing, but I am just pointing out here that a push to new highs does not automatically mean that it will just keep going. In the past, we’ve seen New Highs Pop & Drops. See the chart…
.
GOLD – After breaking to slightly new highs Wednesday and getting everyone all excited, Gold dropped about $50 from those highs. Volume was big and Gold could keep dropping because it looks to be …
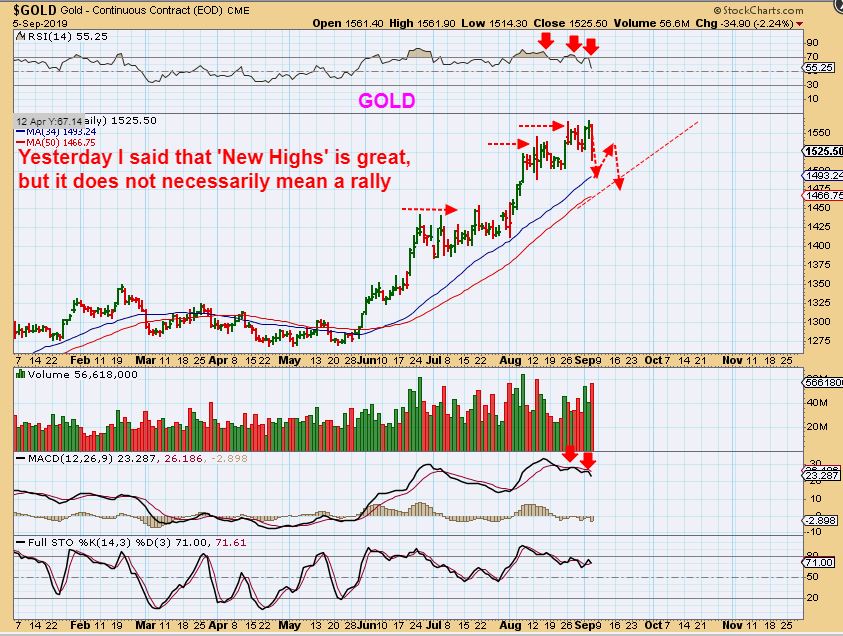
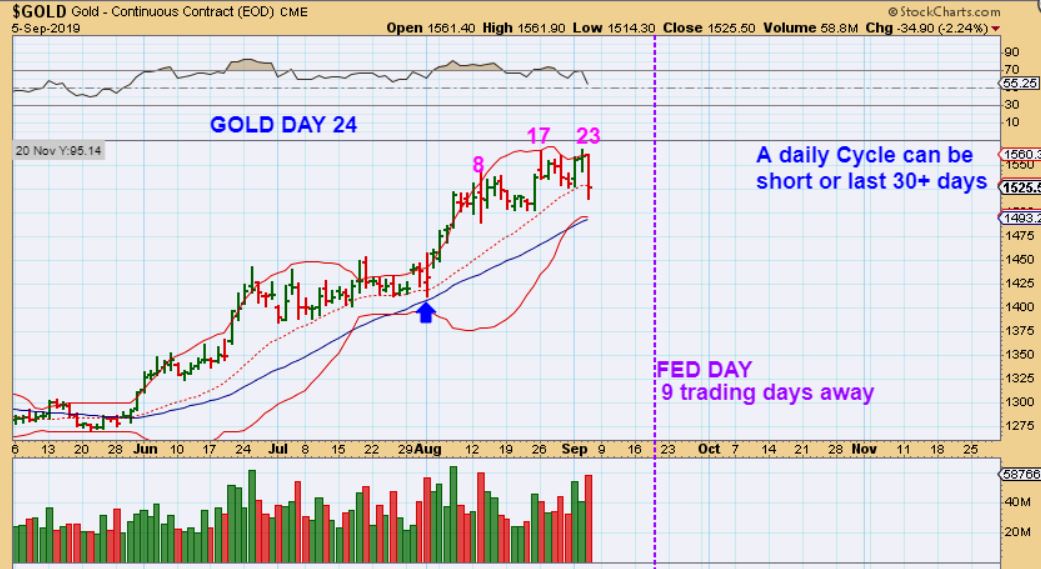
GOLD – Gold looks to be on day 25 as of Friday. This can chop & drop into the next fed Mtg, since a DCL can be anywhere between now & then timing-wise. This drop caught many off guard, but look at the chart and you’ll see big pops and big drops. Gold is chopping at this area.
.
GOLD – I am always being asked, “Where is price going?” Honestly, that is an unknown, since Gold can chop & Pop & drop at any time. If we get a ‘sell off’ into a dcl though, this is an idea of a price target. Maybe the $1450-$1480ish area?
.
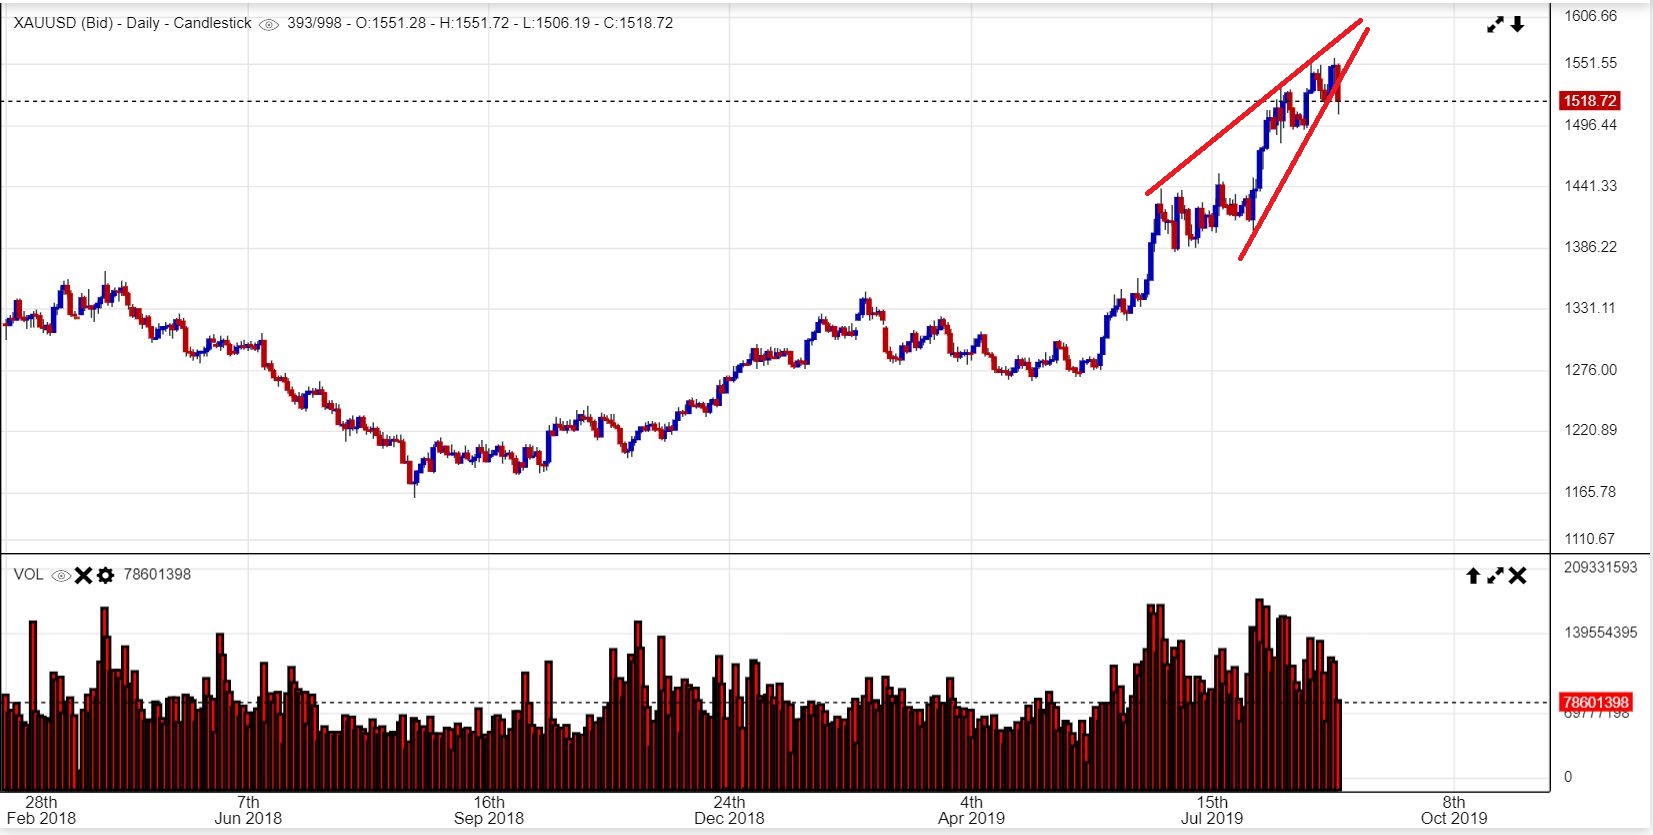
GOLD – I drew a wedge yesterday and the wedge seems to have broken to the downside ( which is expected for a bearish rising wedge. That said, it does NOT men we just topped for good…
.
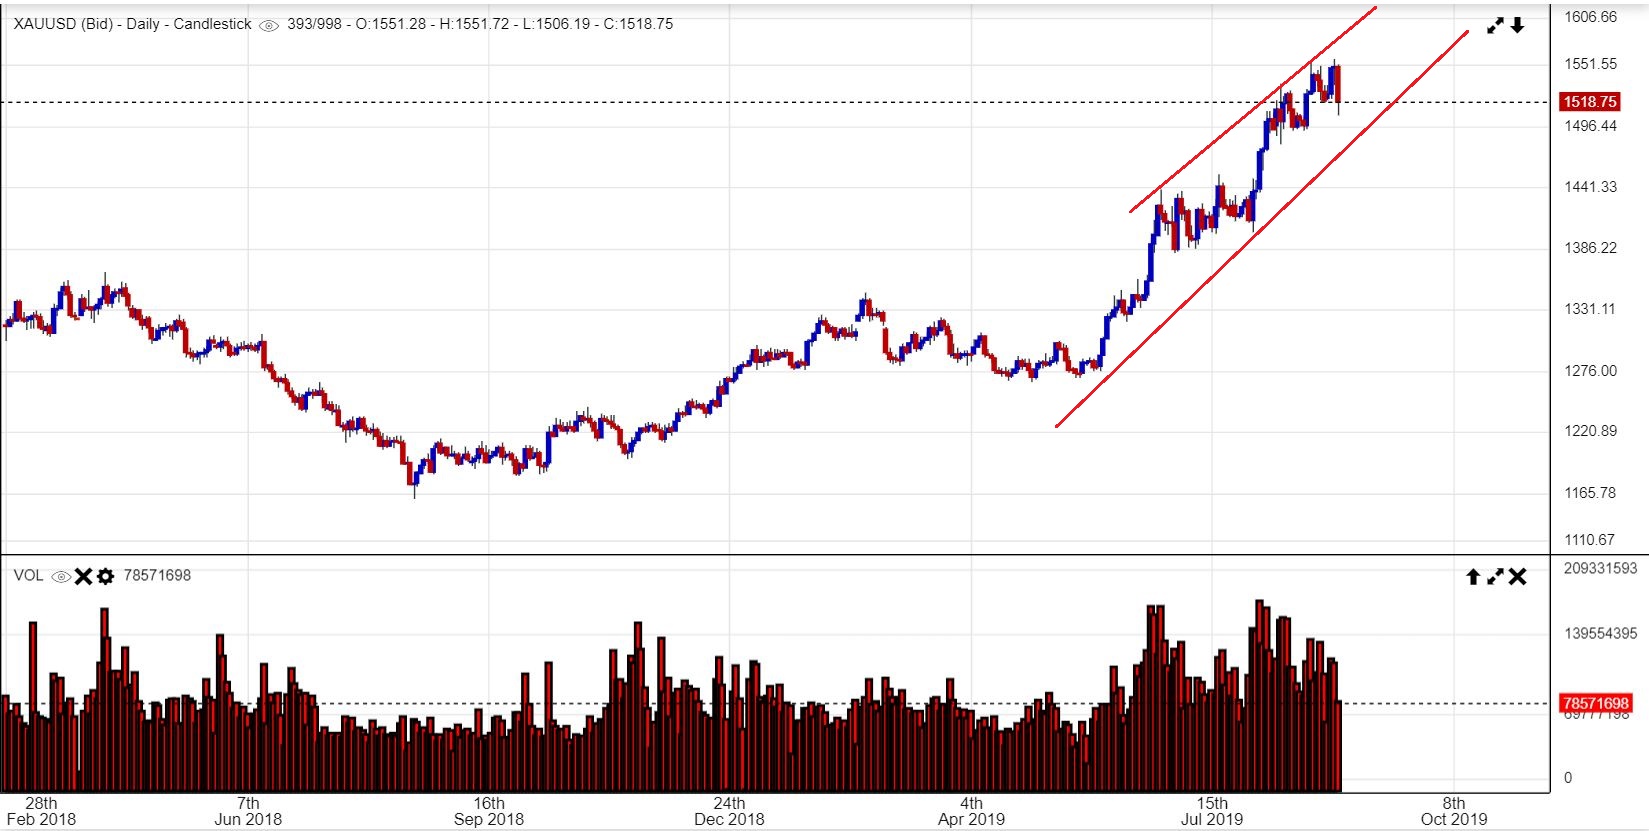
GOLD – A bearish rising wedge forms when a rise gets overheated and dips become rare. They can just drop to form a normal channel. That only looks like the $1490 area.
.
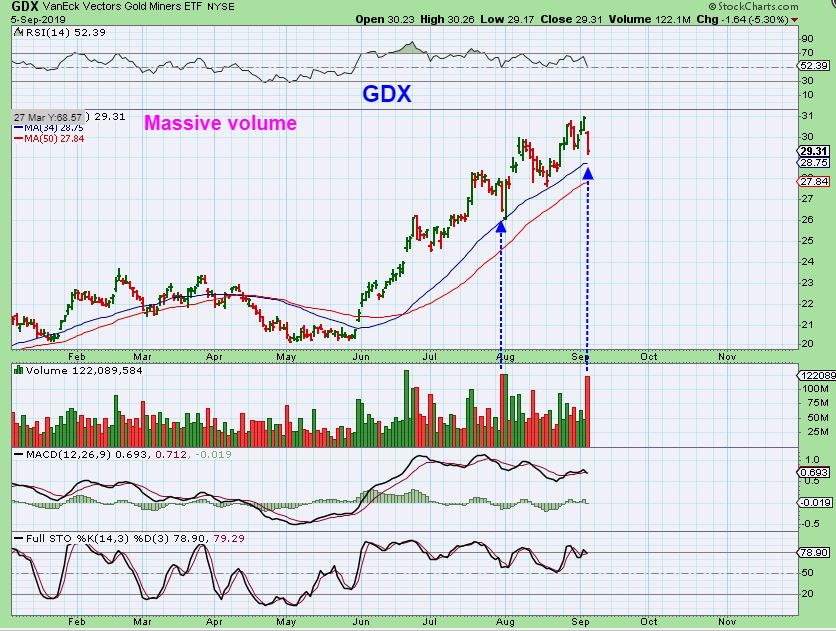
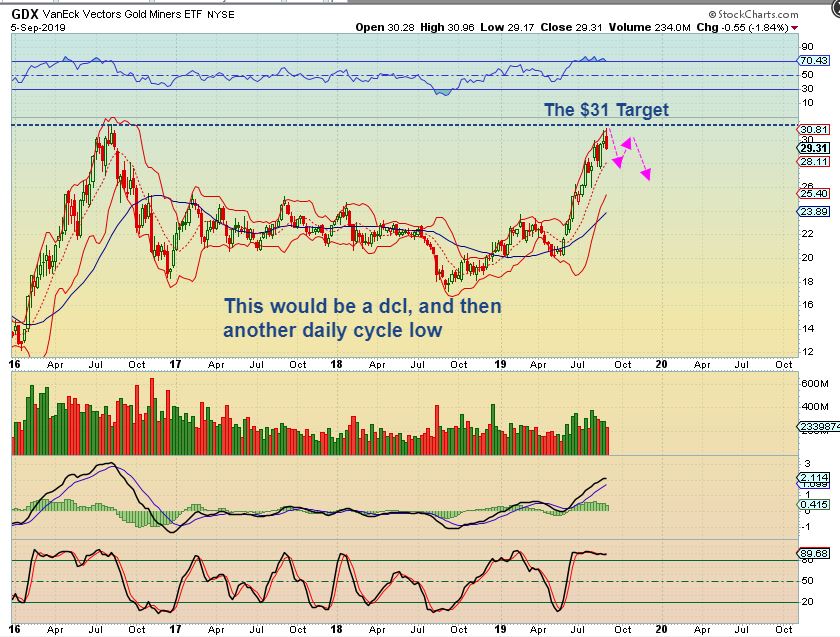
GDX – GDX had large volume on that drop, but we also saw that on the last day of July and it immediately reversed after a lower low the following day. We could see that too ( 34sma).
.
GDX – So GDX made ‘new highs’ and many got excited that the Bull was going to RUN AWAY! Then the Bull did what all bulls do when there are too many happy riders on board, it buck & kicks & knocks a few off. That drop was also similar to the July/Aug drop and reversal. This could reverse too, or Price may stay inside of that Magenta circle & form a dcl over the next week or so.
.
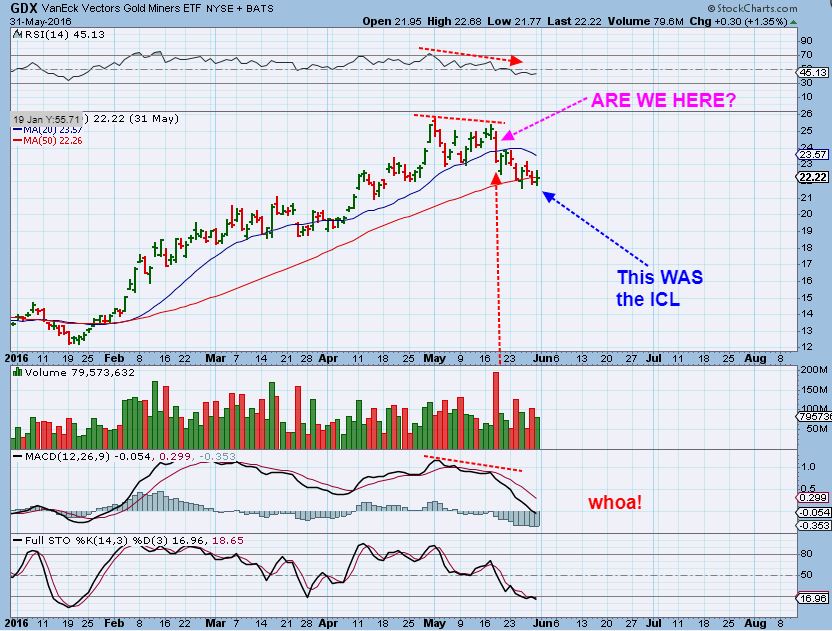
GDX 2016 – Look what I found. A sharp drop in 2016 with a choppy top looks a lot like right now. This became the ICL the following week as it chopped lower and lower little by little. Notice that the High Volume drop was not ‘The low’. Price reversed higher the next day( Everyone probably bought it) and then it slowly made buyers nervous as it dropped even lower…
.
GDX 2016– Stepping back, it was a small double top, a choppier period of trading that dropped into that ICL. It became the A-B-C drop that I look for.
.
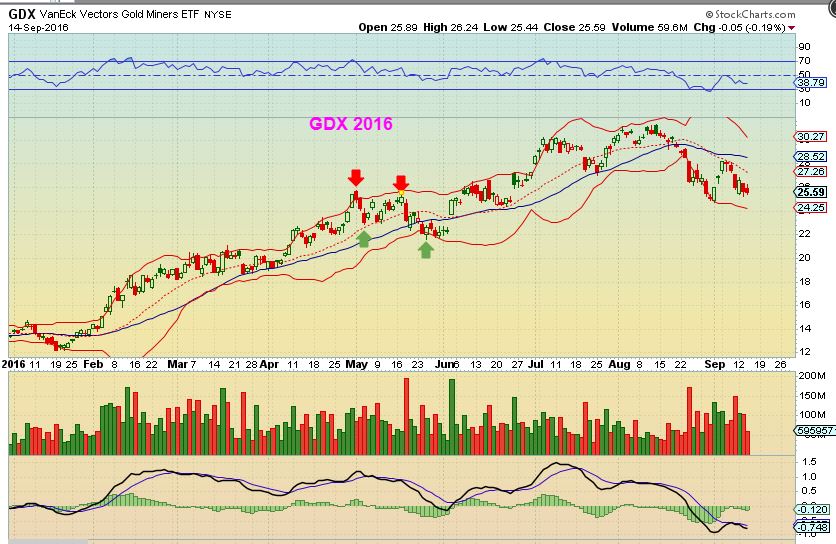
I DO NOT EXPECT THIS MOVE TO BE EXACTLY THE SAME AS 2016, that is even considered unlikely, but I see people get a bit emotional when a drop comes and their accounts dip down too, so this chart helps us to stay focused on how a Bull may act.
.
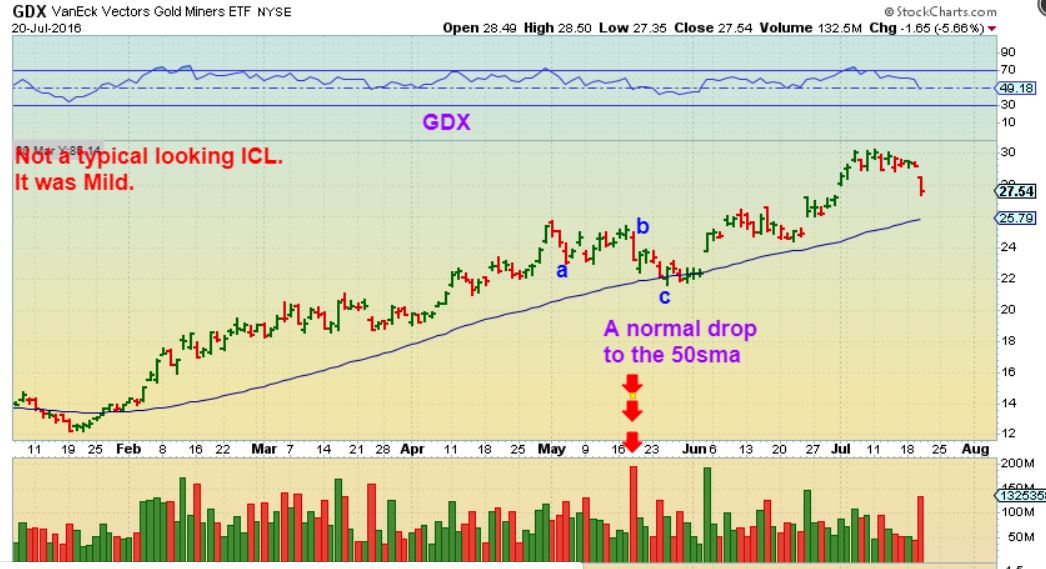
GDX 2016 bigger picture– We see that 1 day high volume drop similar to yesterday. Notice that the lows came in roughly 5 days later. If we got that now, it would be a low as the Fed week begins. We’ll just have to wait and see how this current dip plays out, but it may be helpful to again see that the drop is a normal dip in a Bull Market.
.
So I hope this little additional research and review shows you were we MIGHT be in the timing of the precious metals. That 2016 Choppy a-b-c Drop in May 2016 frustrated people too. We just have to let things play out, and if yesterdays drop was bothersome to you and your account, stay light, holding just a basket of Miners ( reduced in size) until a discernible low (dcl) presents itself. As for The General Markets ? I’ll look for opportunities as time goes on, and Oil & Energy are still ok, but yesterdays pause at resistance again prolongs the basing process, if that is what we are seeing. I will be in & out of the live trading area today, I have a chiropractor appointment midday, so If you own energy stocks or trades, just remember to Stay Frosty!
.
Enjoy your Friday trading
.
~ALEX
.
GDX – If we get a prolonged sell off, even after the Fed Mtg and a dcl, it could be an a-b-c handle on the large Pan. I mentioned this in the weekend report, but wanted to post this as a reminder. I always follow it daily, step by step, looking for clues along the way. Really, that is all that anyone can do.
.
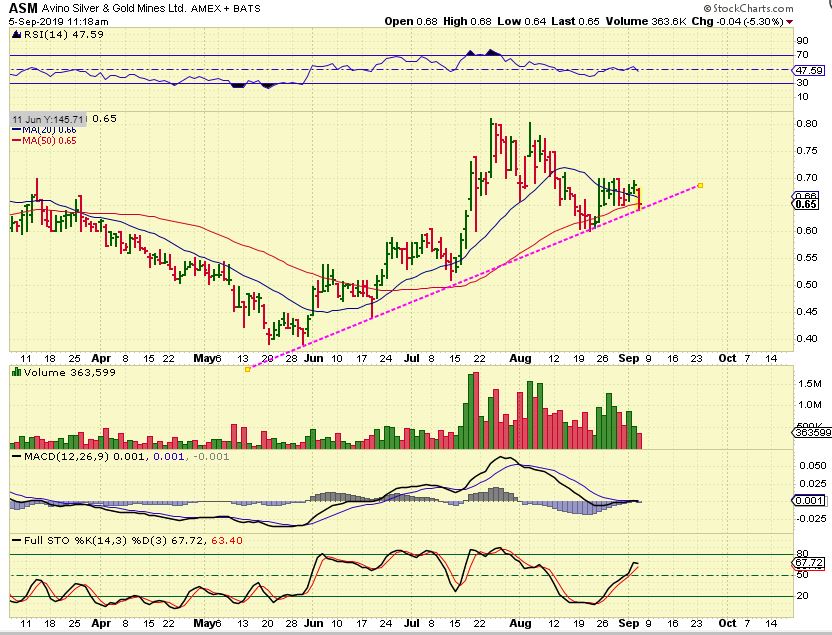
ASM – ASM held the line, but these are areas where someone could get stopped out right before a move higher.
.
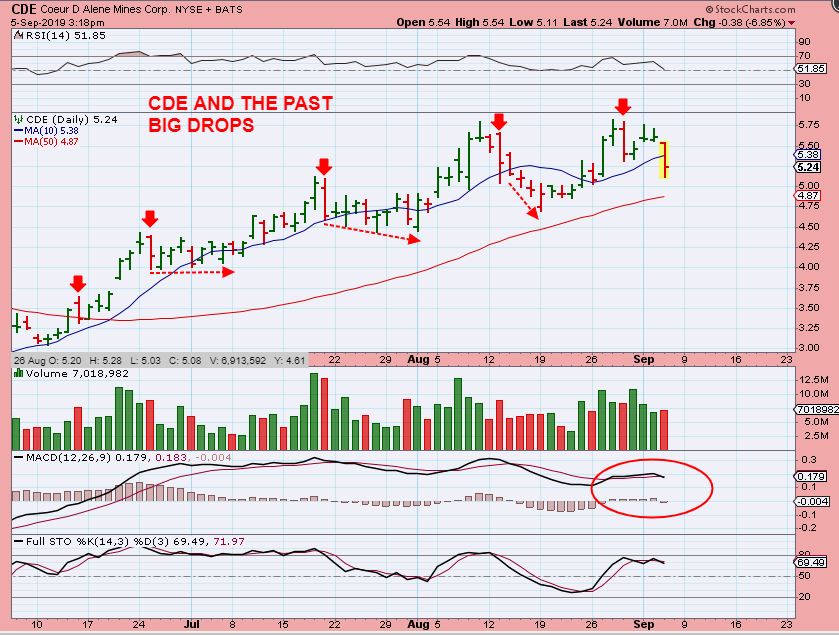
CDE – It may be helpful to see that we have seen large drops in the past. CDE didn’t then go into a massive sell off, though it did get choppy day after day . Bull Market action shakes off its riders ( though you do need to use stops just in case something changes).
.
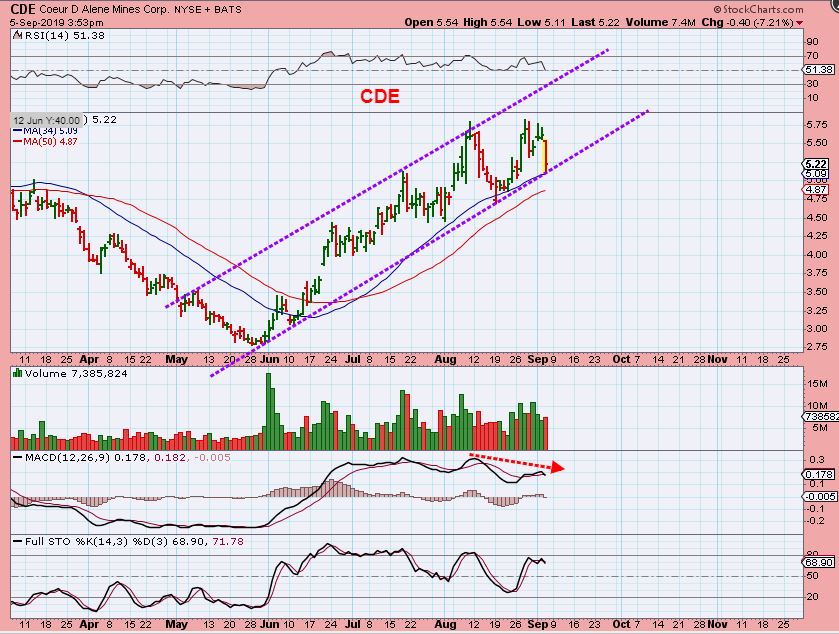
CDE- So we step back and it looks like this. A false break down & recovery at the 50sma could take place. That recovery could even be the lows for the next move higher. Step by step.
.
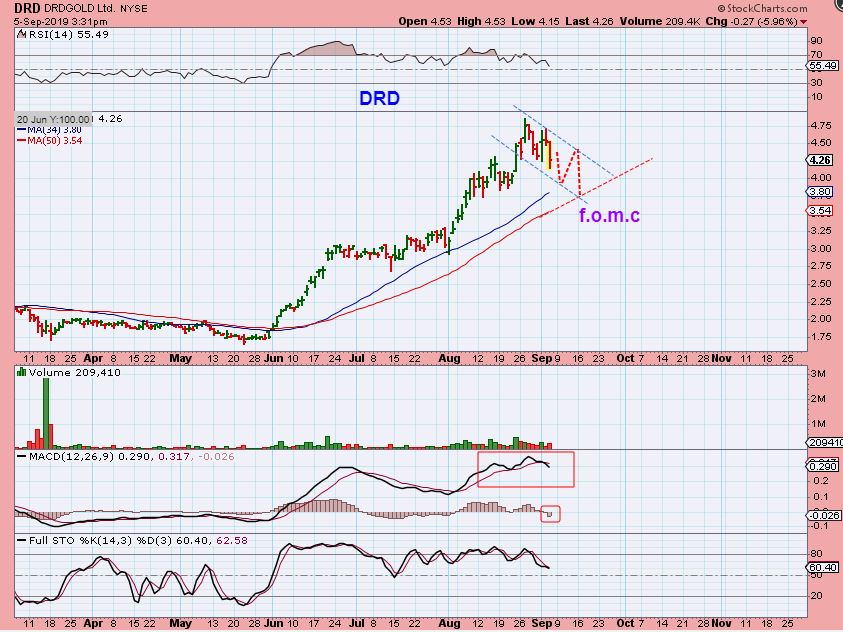
DRD – For some of those runaway stocks that left people behind, we may get a buying opportunity in the next 2 weeks.
.
.
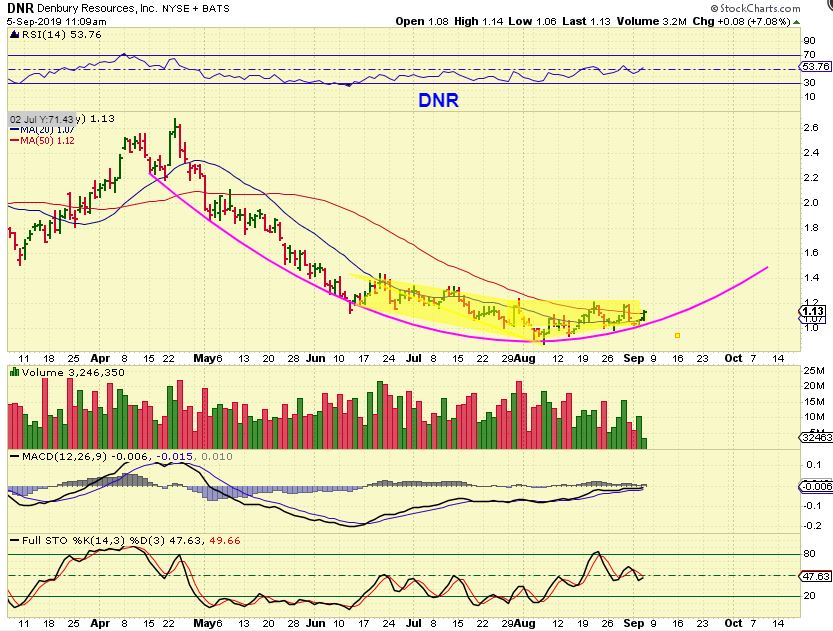
DNR – I bought DNR, and if Oil & Energy can continue to improve, a cup formation here would be rather rewarding (over 100% over time).
.
Interesting set ups :
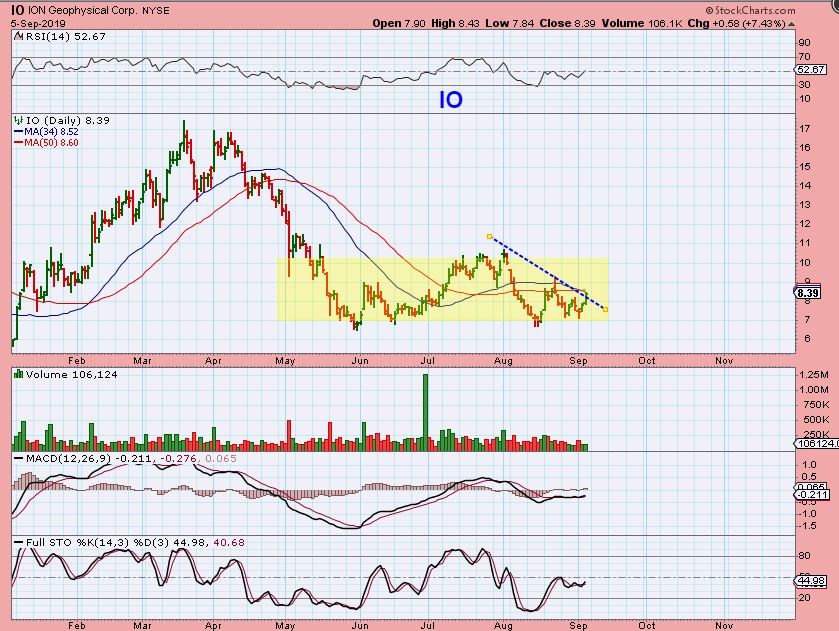
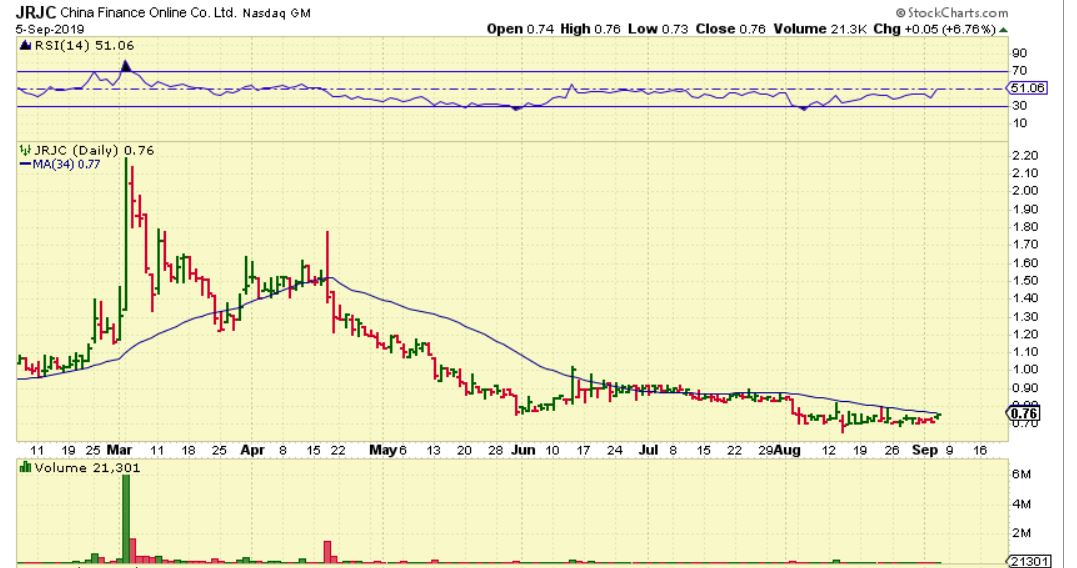
IO – This base in the $7 area is a formation that I often buy. It is a ‘complex base ‘ formation and setting up to break out ( a buy) . I had this stock in my Chinese list, with HUYA, VIPS, JRJC, etc., and many of those look to be basing…
JRJC – Speaking of JRJC, this is a very interesting base to me. Note: JRJC used to trade near 1 million in volume, but it has gone dry, that is the only problem at this point. The MACD is rising and it could be a buy above the 50sma shown, or…
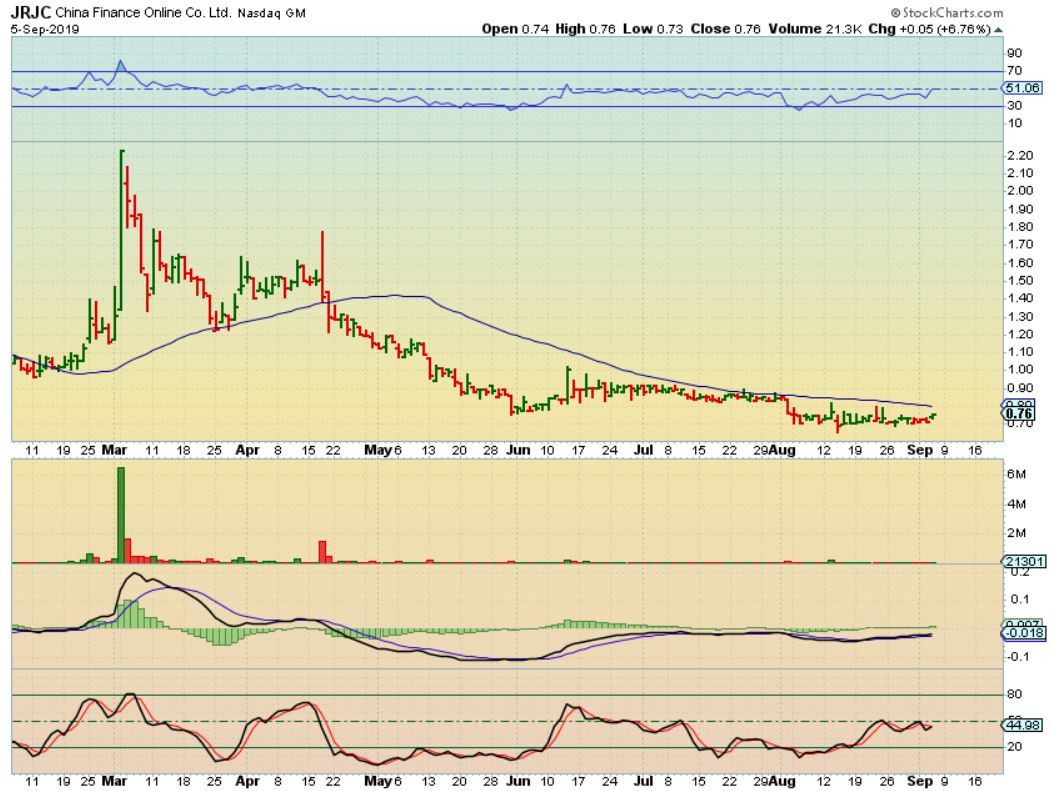
JRJC – It is pushing on the 34 sma now. Again, volume is too light for me now, but it could improve, so this is good for a watch list or maybe buy above the resistance 34 or 50 sma.
.
VIPS – I used to trade VIPS and that has improved too. Many of these sold off hard with the China Tariff talks and these bases could lead to good gains either with the General markets moving higher or when the China talks settle down. VIPS just ran from $6 to $8.50

.
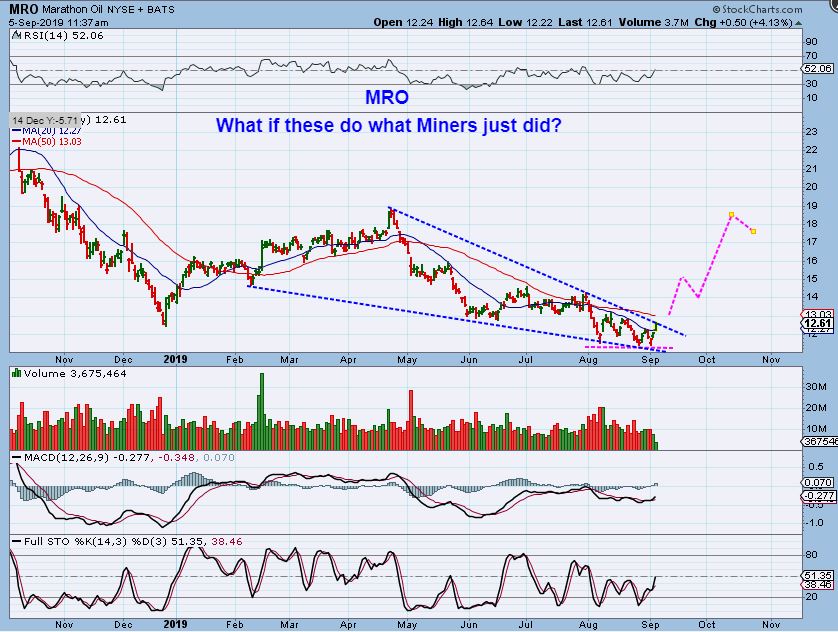
MRO – With energy, MRO has been discussed as a buy candidate. Put this on a watch list if you are interested, it is a buy with a stop ( macd divergence at recent lows) or a buy after it breaks above the 50 sma.
.
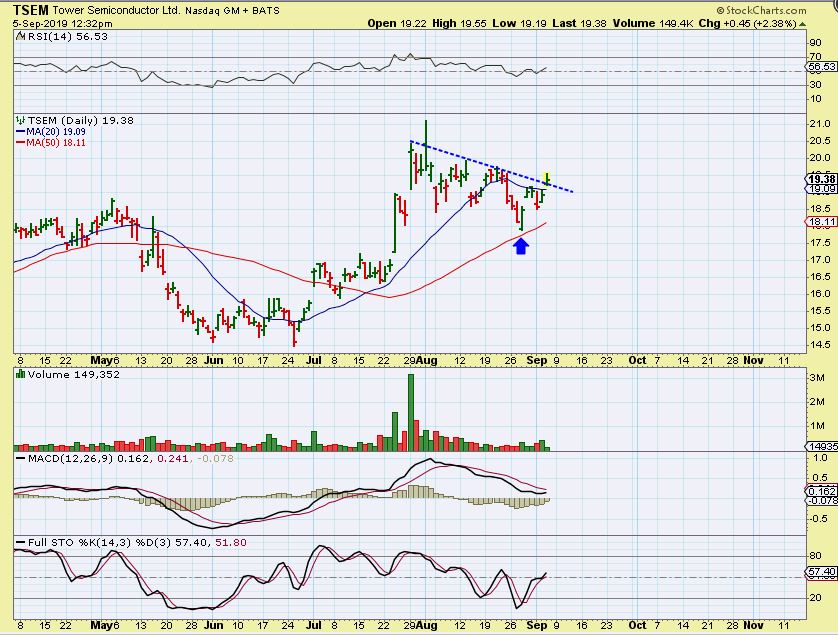
TSEM – A semiconductor looking ready to move higher. Other semi’s have already reached prior highs ( INTC, MU for example).
.
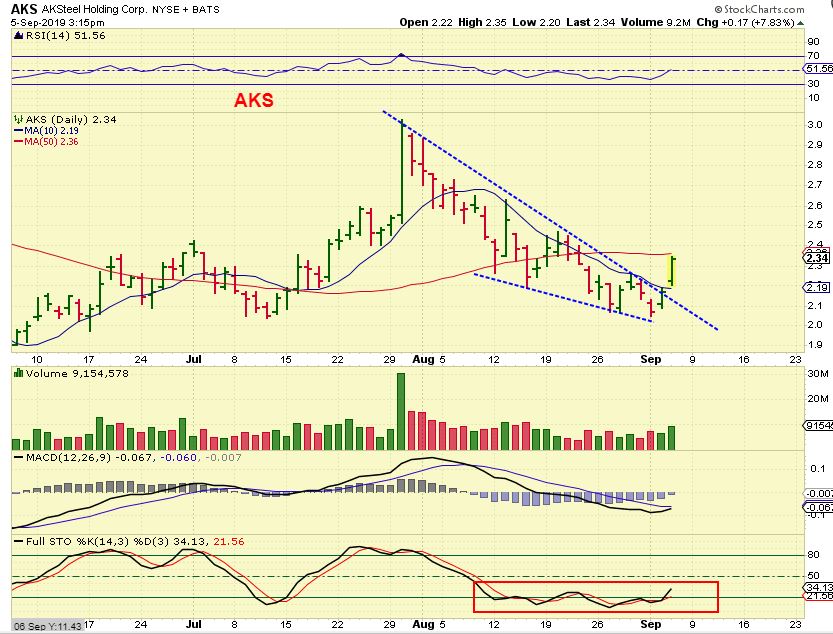
AKS – I am watching Metals stocks, but they have been too choppy lately. This is AKS acting bullishly…
.
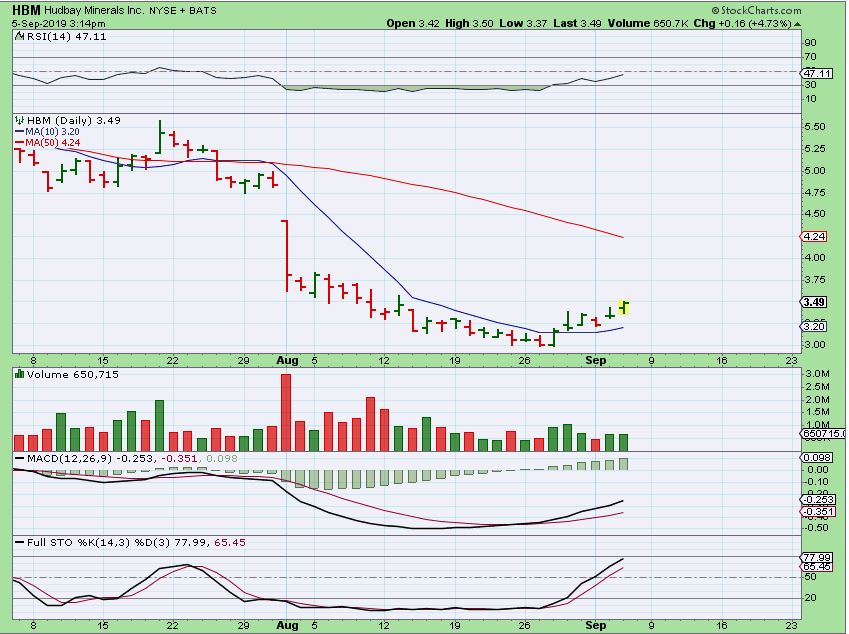
HBM – And I really like HBM with Copper breaking out higher. See also FCX, TGB, etc.