BIG PICTURE WEEKEND REVIEW – SEPTEMBER 7th
In this weekends Big Picture report, I’m going to do a little more coverage of the Precious Metals, because I am starting to see a few things that need discussing. First we’ll start with The General markets, Oil, Energy , and the USD…
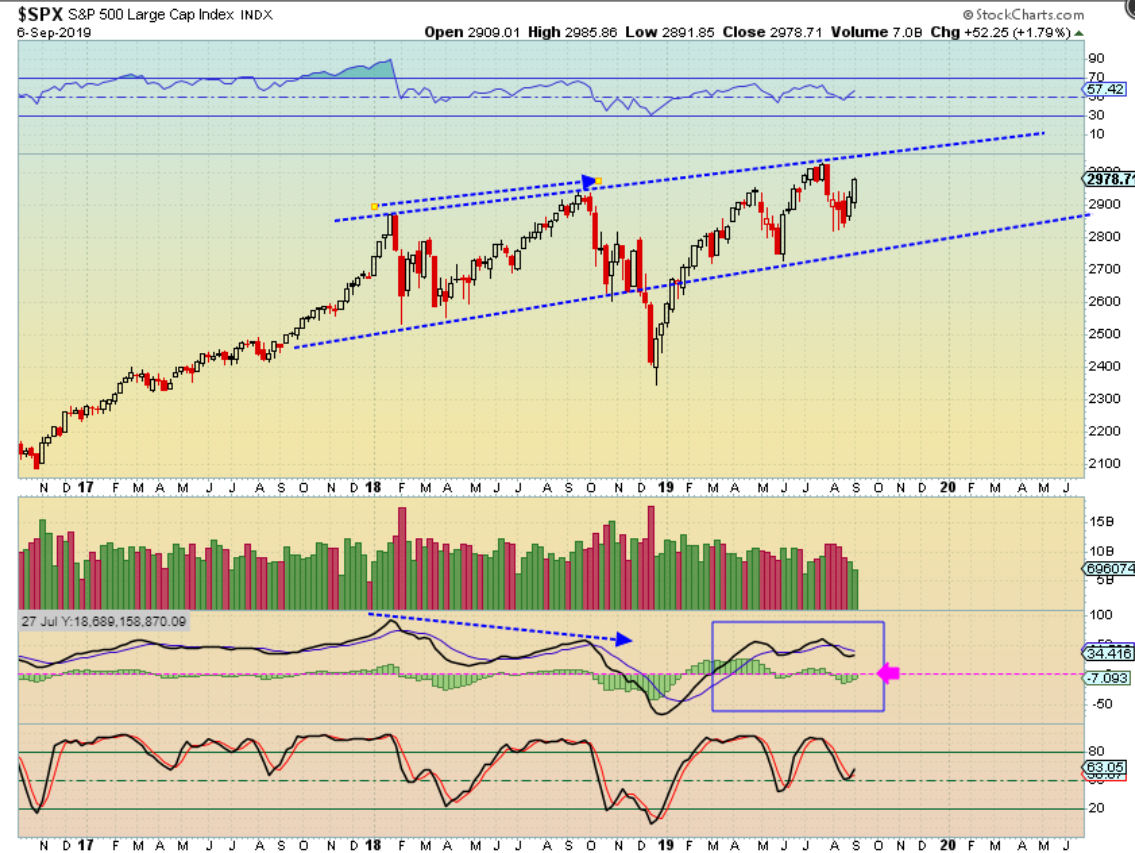
SPX WEEKLY – The Markets broke higher out of the trading range that we’ve been watching. I would expect them to run to the previous highs next week and maybe into the Fed Week. After that, they’ll be due for a dcl, so we’ll see how this plays out. For now it is ‘Big Picture Bullish’.
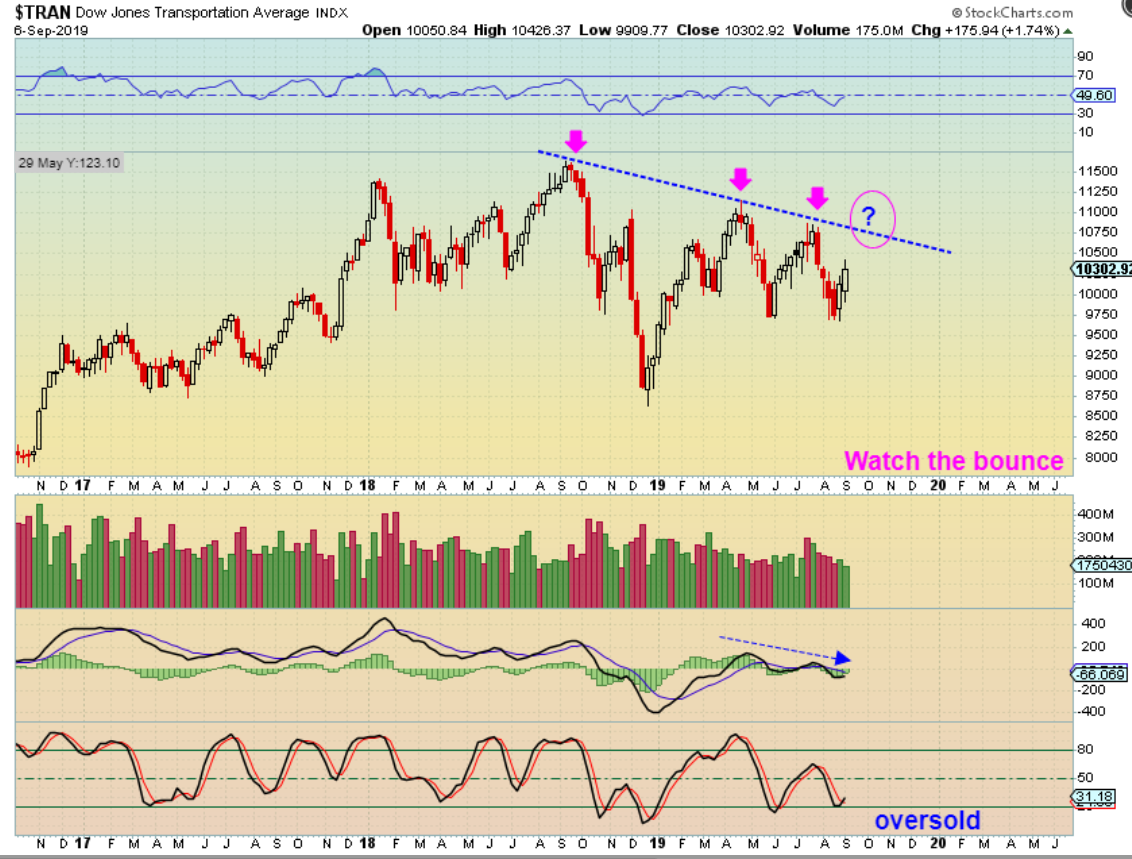
TRAN – The transports & other market sectors have been lagging, but they can run higher too.
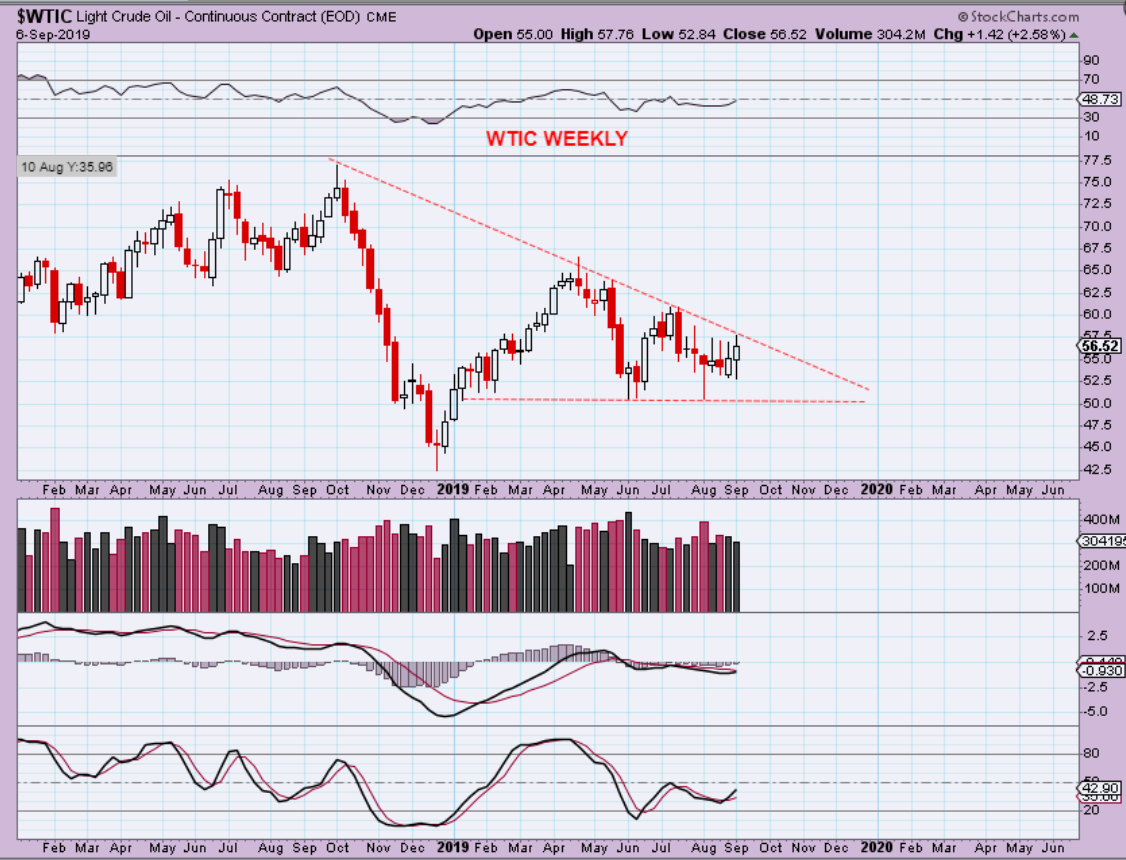
WTIC – Oil continues to chop & pop and threaten to break out higher, but last week it broke above that 50sma & fell back down. I still think that Oil has a good chance of breaking out higher.
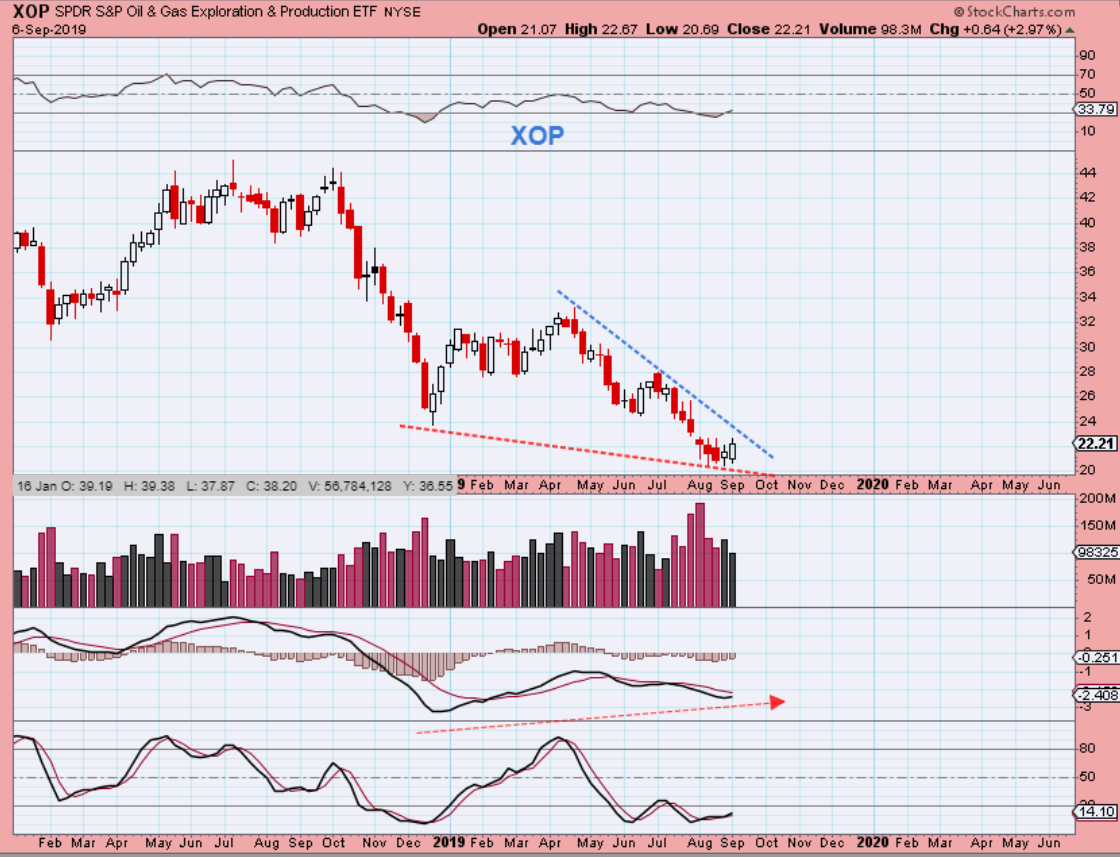
XOP – I ended up closing my GUSH trade ( $3.00 – $3.50) when Oil failed to hold the break out, but honestly, this still looks pretty good. Price has a much deeper low that the MACD or RSI on a weekly basis, it had capitulation type volume, and this is quite oversold. I may end up taking that trade back soon, especially if Miners keep dropping.
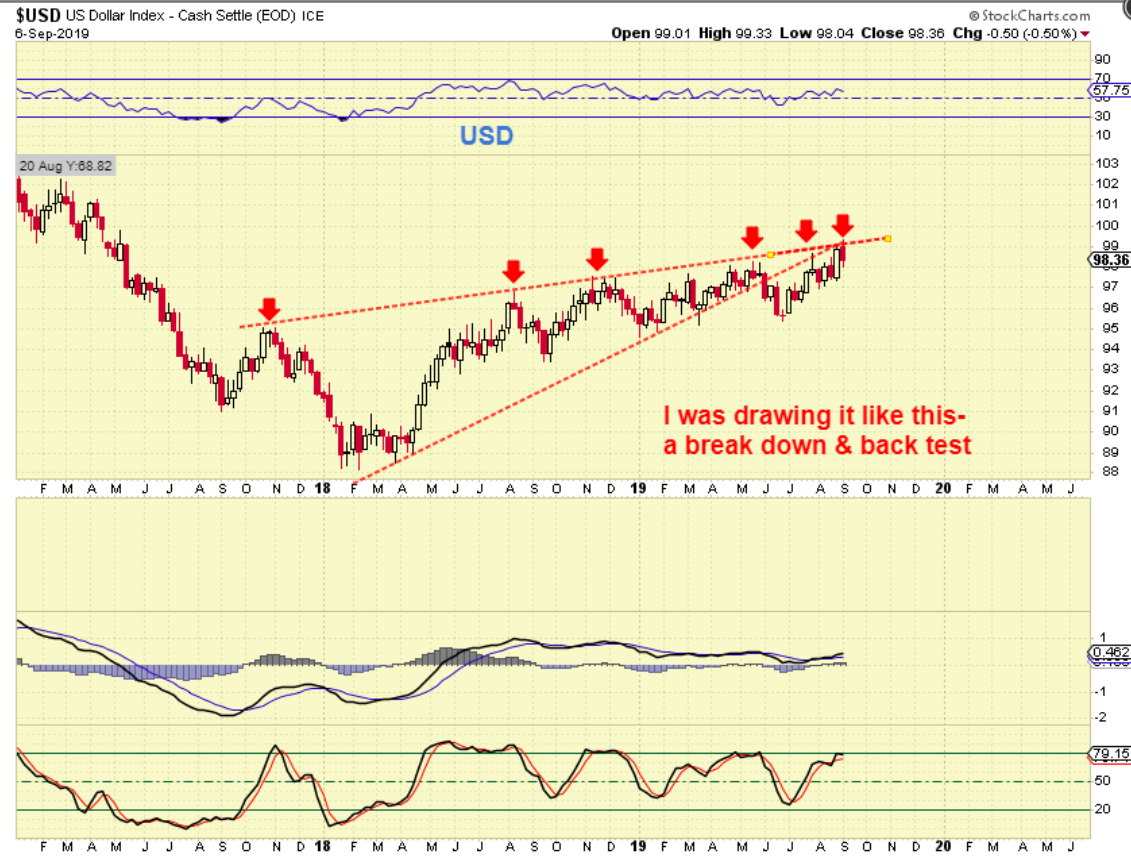
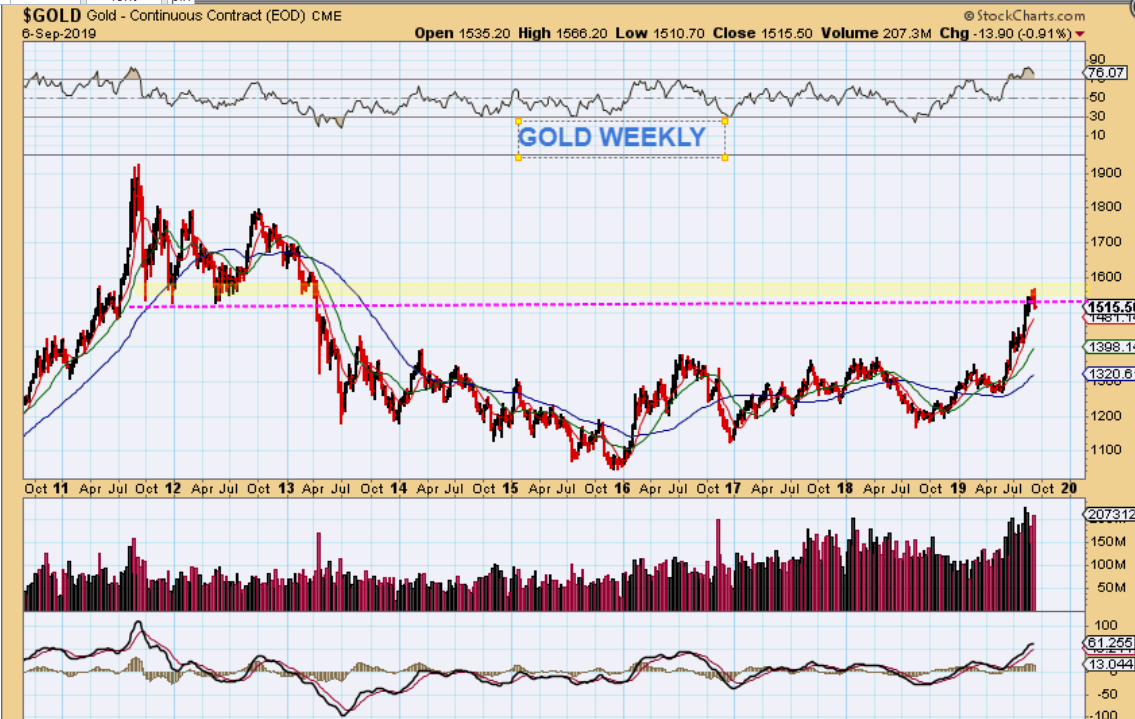
USD #1 – I have been drawing this bearish rising wedge since 2018, and it looks to me to be a break down & back test. The rise in the USD has not hindered Gold at this point. Another way to look at this would be this way…
.
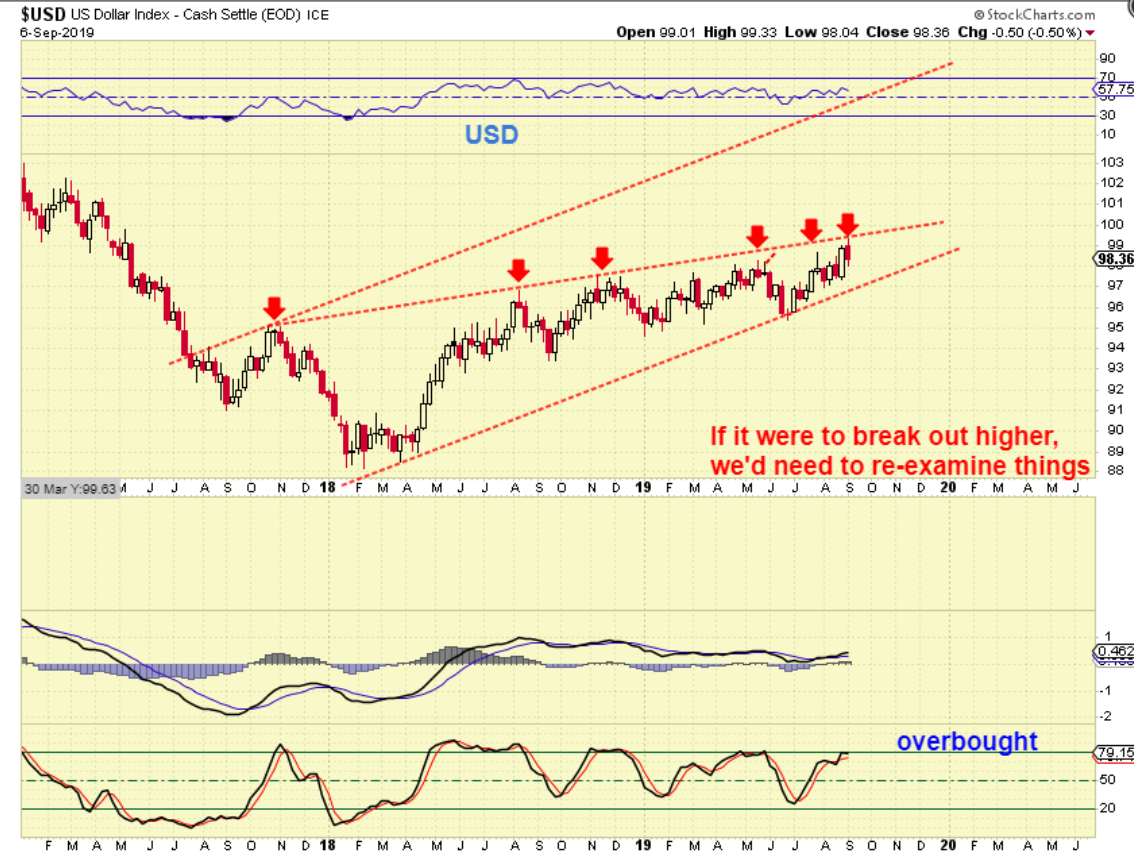
USD #2 – So far the USD has stopped at the upper resistance, and I lowered the bottom line to remove the break down. It remains bearish if it breaks the lower trend line, if the upper trend line breaks, it could run, so this is being monitored often.
.
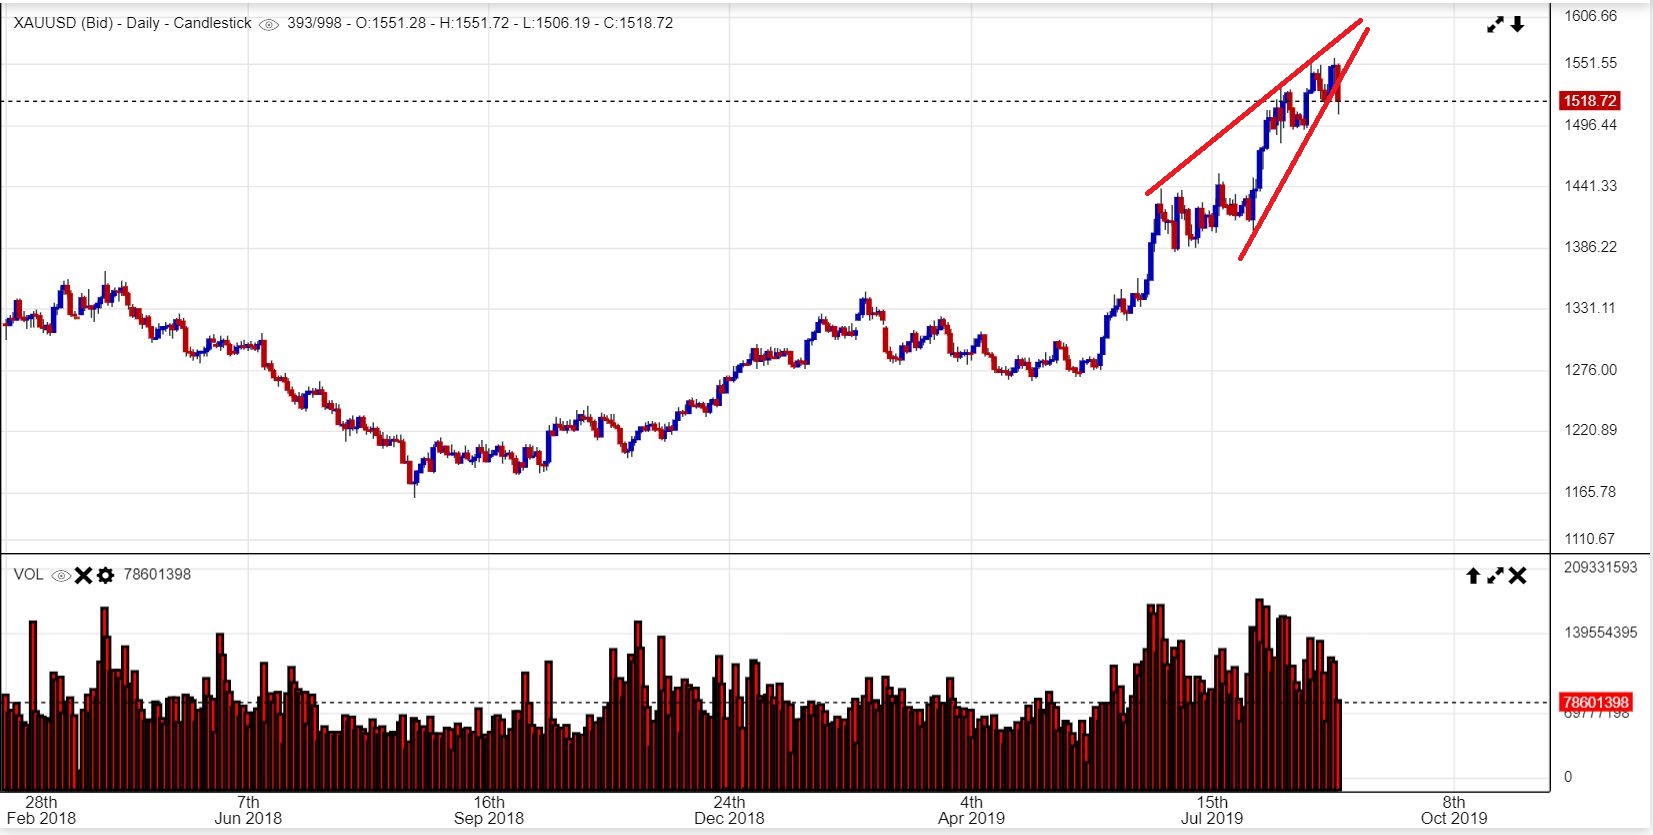
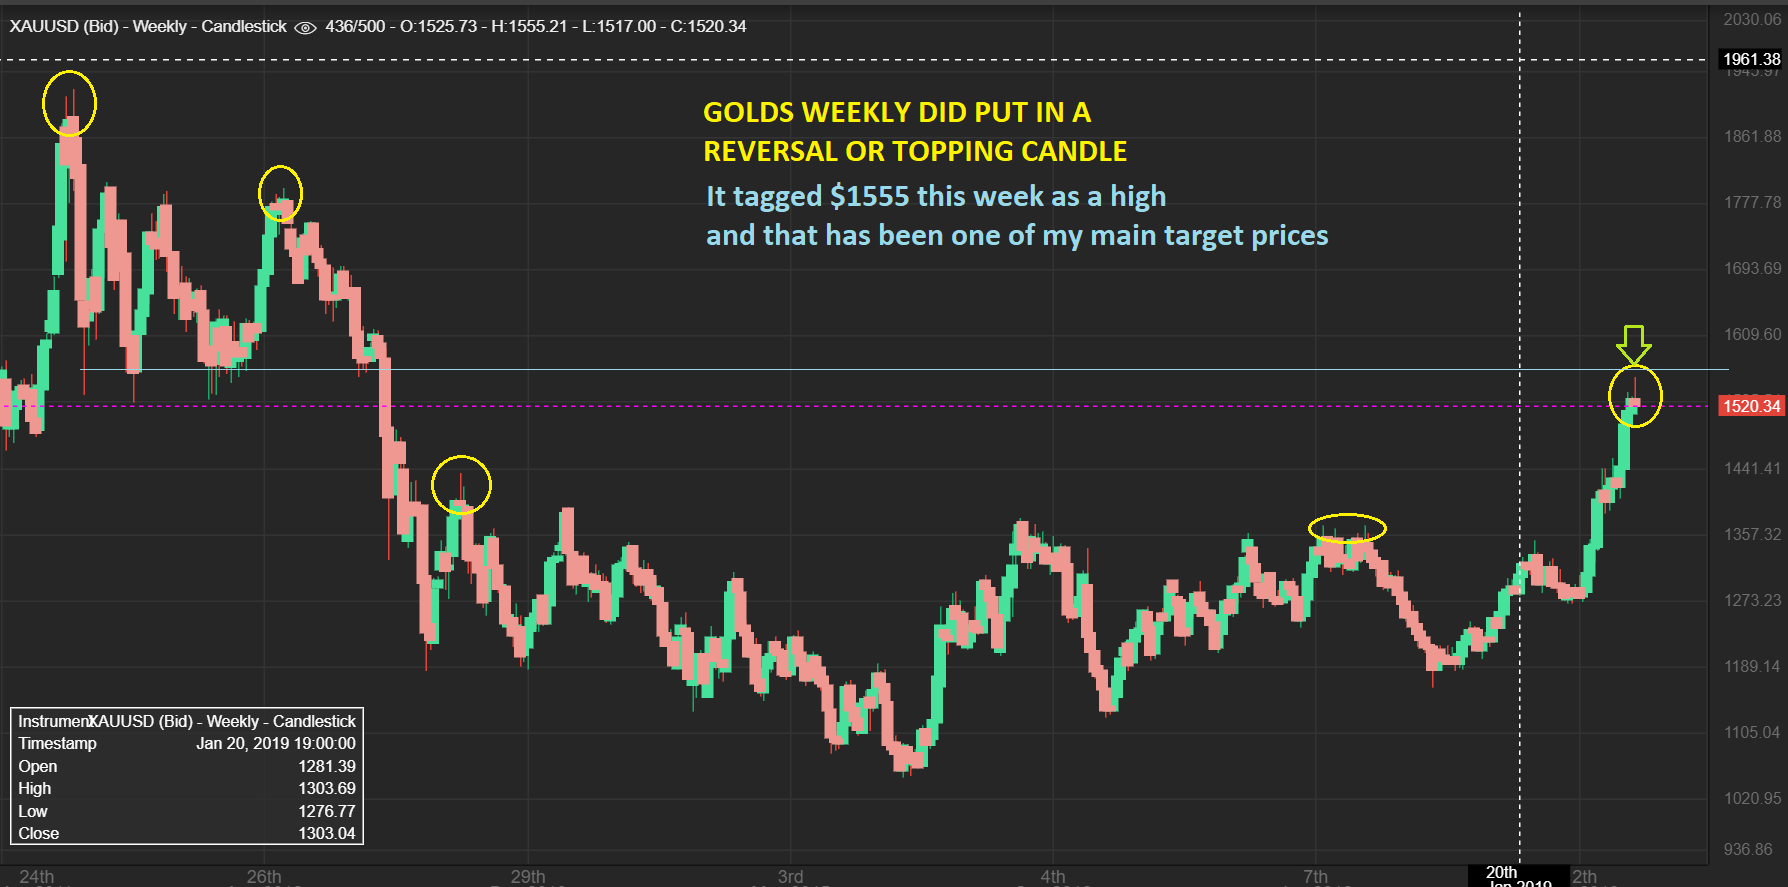
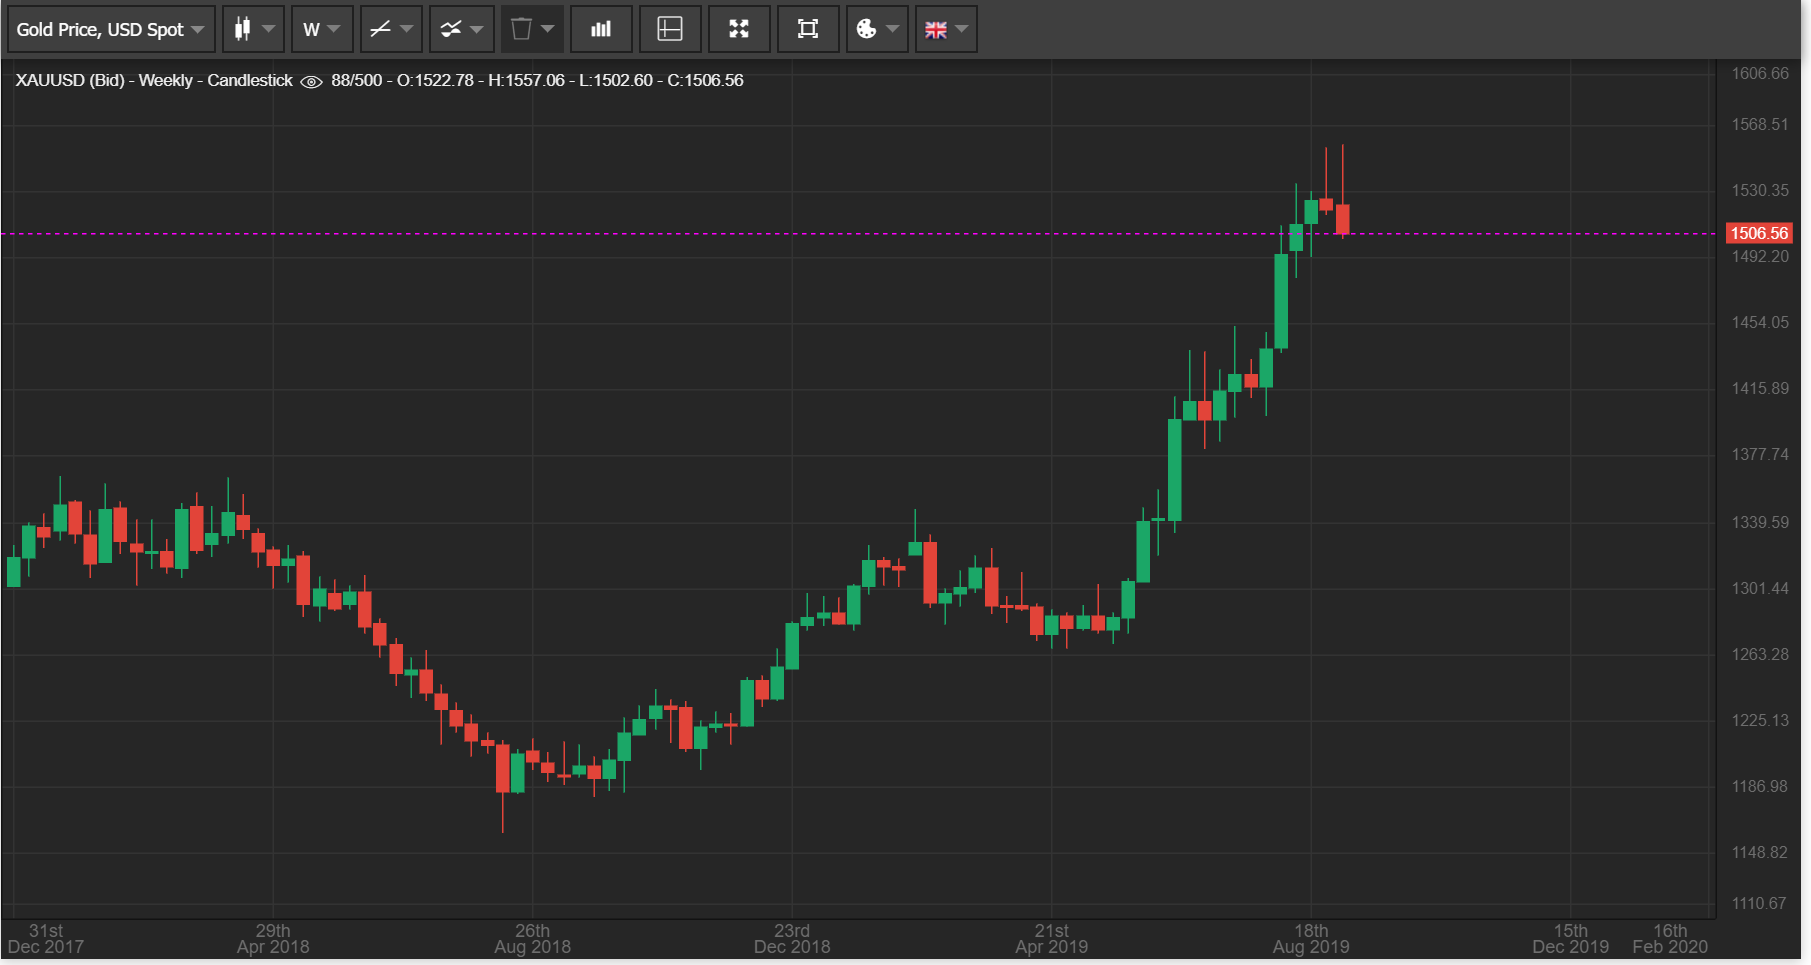
GOLD Weekly – This was last weeks Gold chart showing a reversal candle after hitting my $1550 initial target & resistance area. It could still have moved to $1600, but the reversal candle had to be pointed out.
.
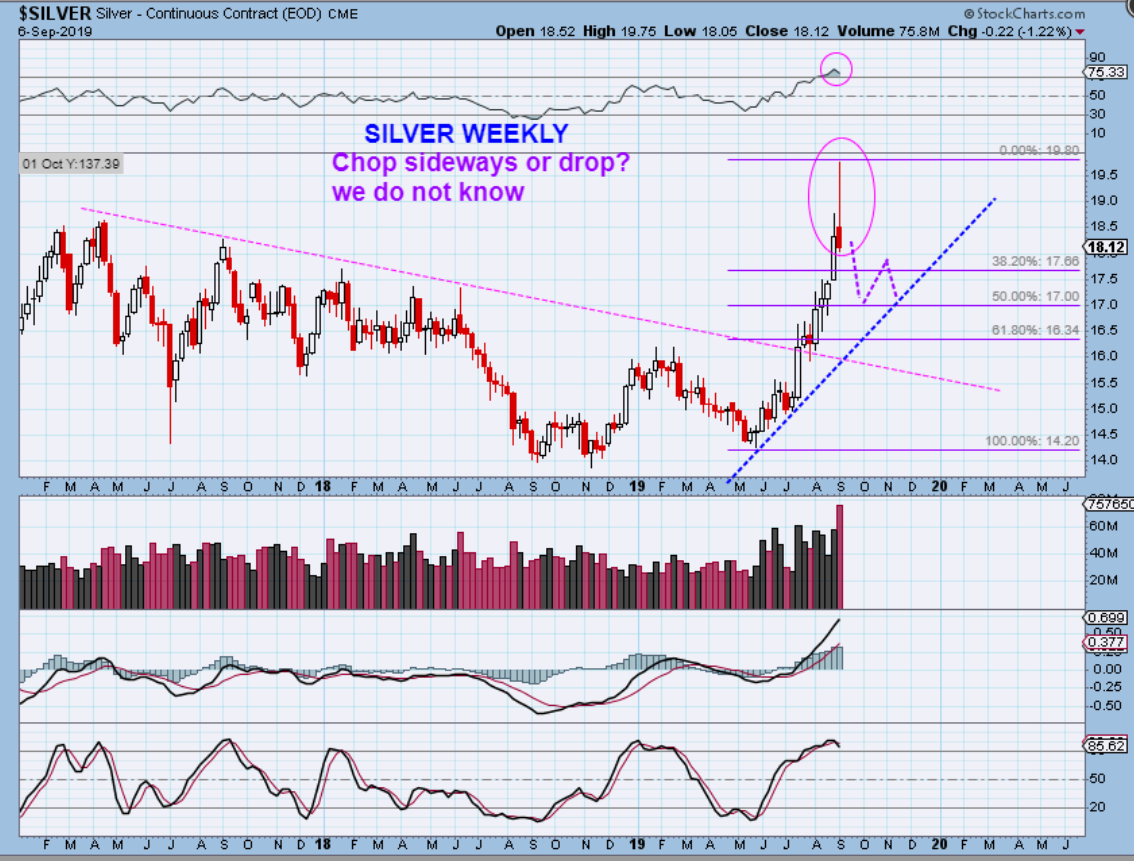
GOLD Weekly – Now we have another reversal candle this week. This strong run now looks to be struggling (topping?), but we don’t know if this will be another sideways crawl or is a drop ahead?
.
I’VE MENTIONED THAT I NEED TO POINT OUT ANY SIGNS OF A TOP THAT I SEE AS A CAUTIONARY NOTE, AND I DO SEE SIGNS CONTINUING. YOU WILL SEE THEM TOO AS I POINT THEM OUT IN THIS SECTION OF THE REPORT.
.
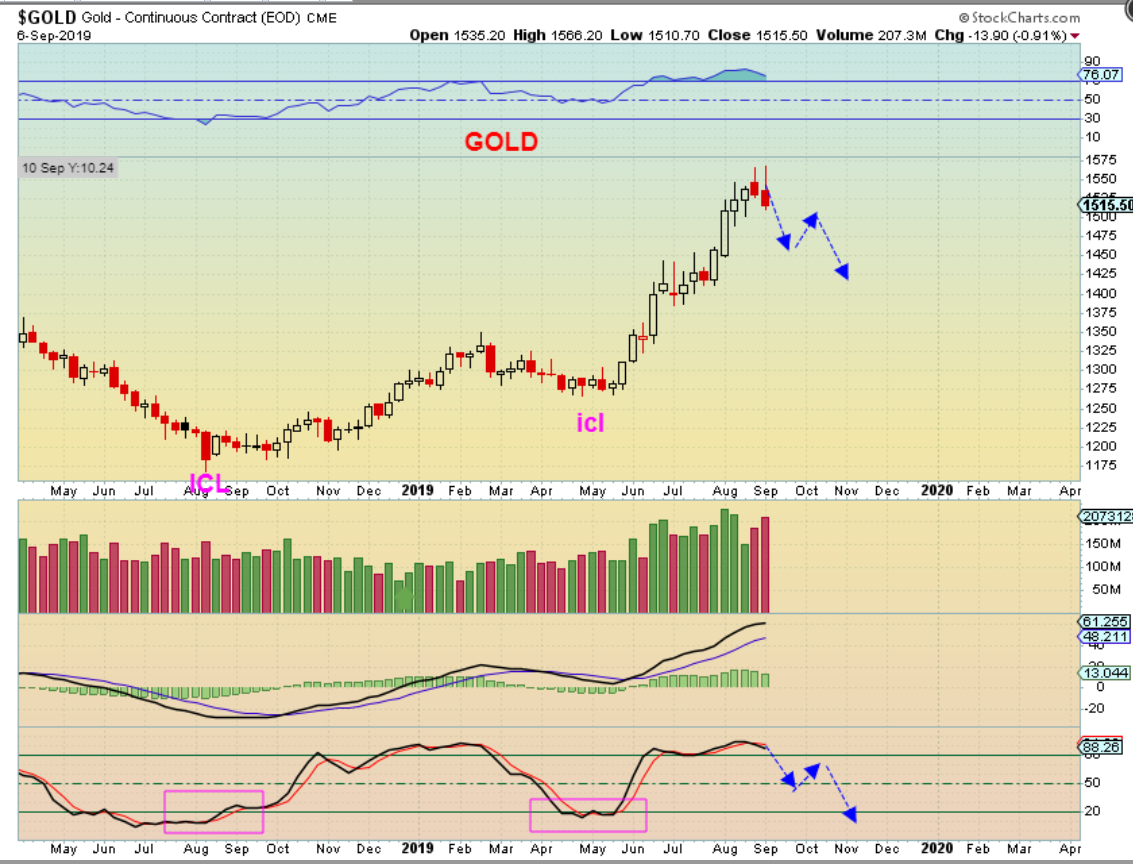
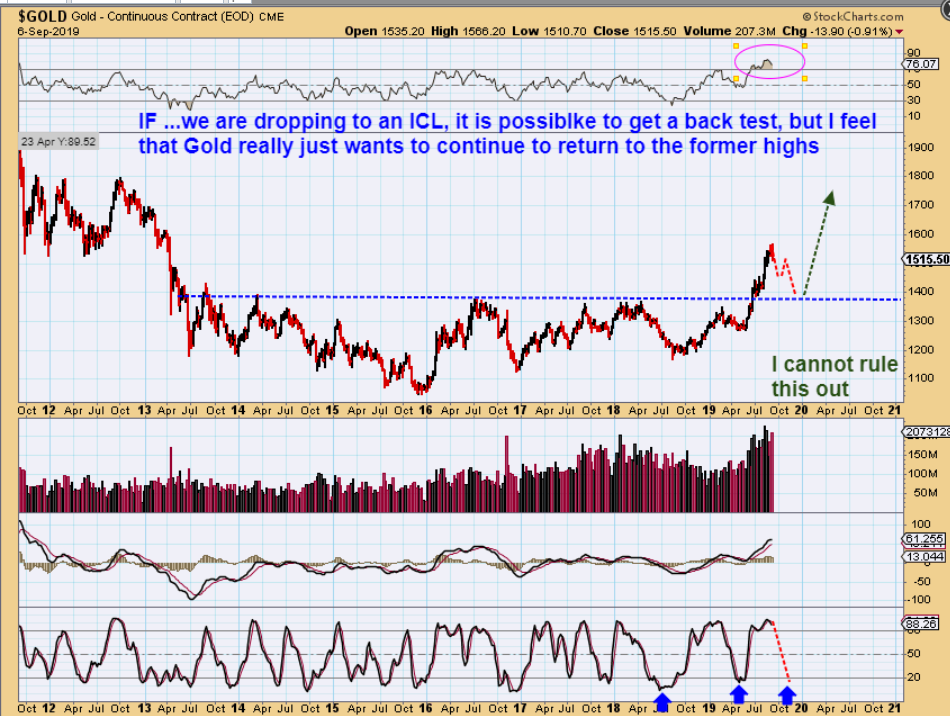
GOLD – After pushing into the resistance area, Gold sold off. Will we dip into just a ‘daily cycle low’ near the Fed Mtg in 8 days or could this become a drop to an ICL? Honestly it could be either, and We won’t know until we examine the drop, so I want to show you past ICL dips DURING A STRONG BULL RUN and show you just a few of my observations.
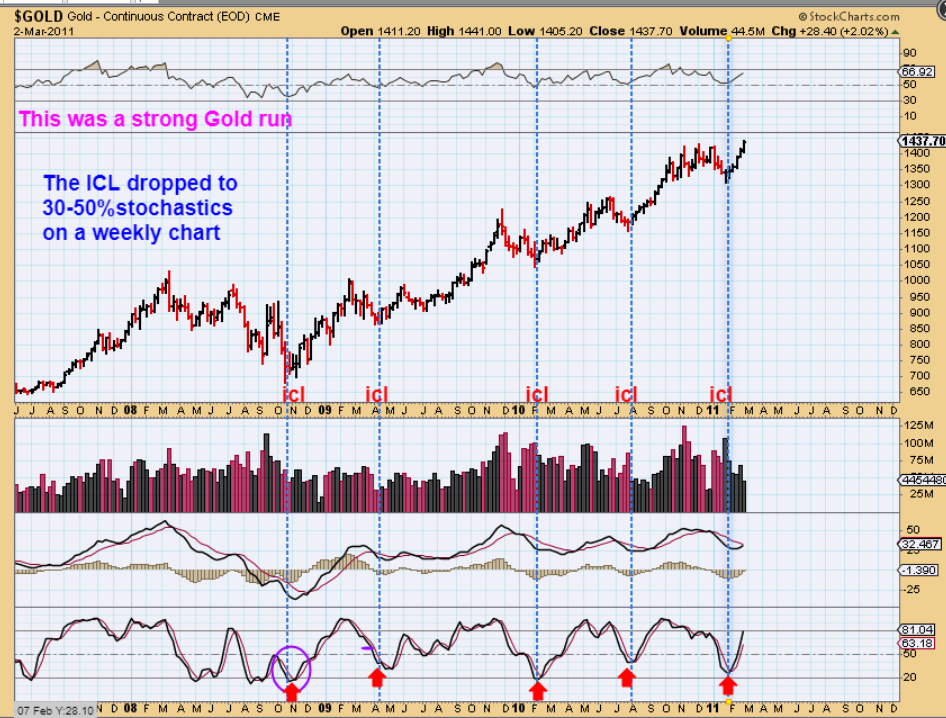
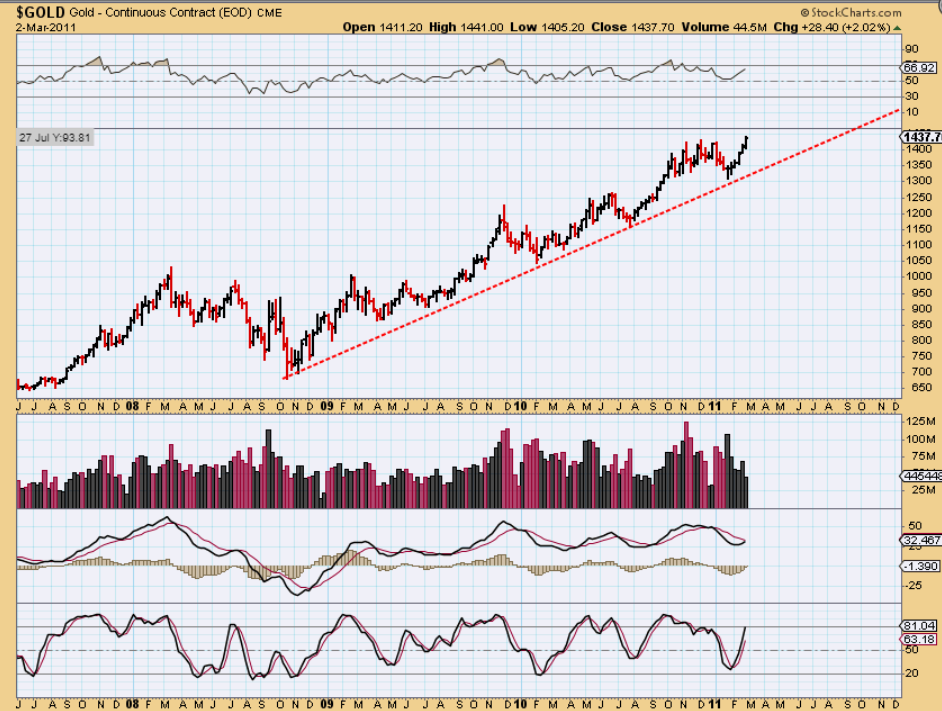
GOLD 2008 -2011 Observations – Look at the weekly stochastics on an ICL drop. Even in the Bull Run, it dropped below the 50% line. What about now? It Reads 88 …
GOLD now – The Stochastics is overbought , so IF we get a drop into an ICL now, it would need to drop that stochastics , and that would take time ( 2 more daily cycles?).
.
GOLD 2008 -2011 Observations – That 2008-2011 run formed a nice trend higher with ICLs as lows , so that would help us to find a ‘possible’ downside target. Let’s look even deeper…
.
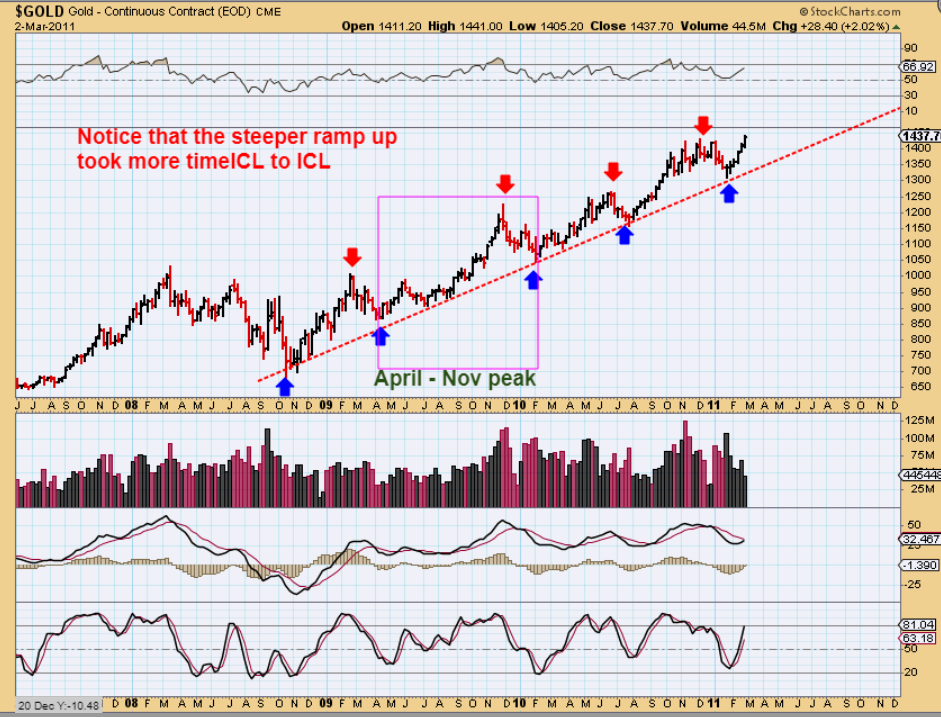
GOLD 2008 -2011 Observations – In that run, ICLs were often roughly 6 months apart, and peaked on month 4-5. We are currently on Month 4.5, HOWEVER LOOK AT THE MAGENTA BOX. I will discuss that next…
.
GOLD 2008 -2011 Observations – In that MAGENTA BOX. the ICL to ICL was April ICL to a NOV peak. That would be the same as a May ICL to Dec peak, so this just shows the possibility of the current run ‘extending beyond the normal range’. We have to view it as possible, but less likely, since we have it as only 1 out of 4 or 5 ICL to ICL runs. The rest were closer to 6 months.
GOLD – THAT SAID, I cannot rule this out. This would equal a drop into FED Daily cycle low, a bounce that makes a lower high, and then another drop to the ICL.
.
GOLD – So after looking at the Stochastics, the resistance, the topping candle on a weekly basis, isn’t it true that I need to keep this in the back of our minds? The next DCL could be bought as though it is just a continuation to new highs, because Gold could just power higher, but if it starts to fail as a lower high, I’ll be posting this chart again as a reminder.
.
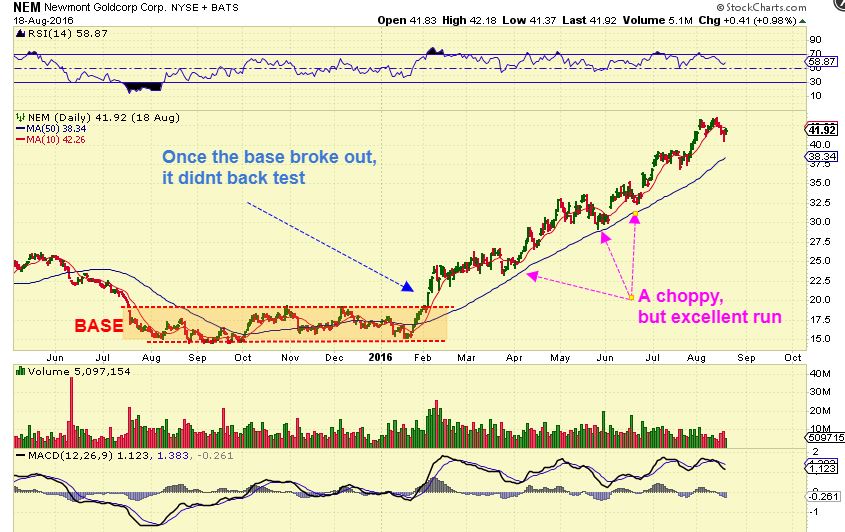
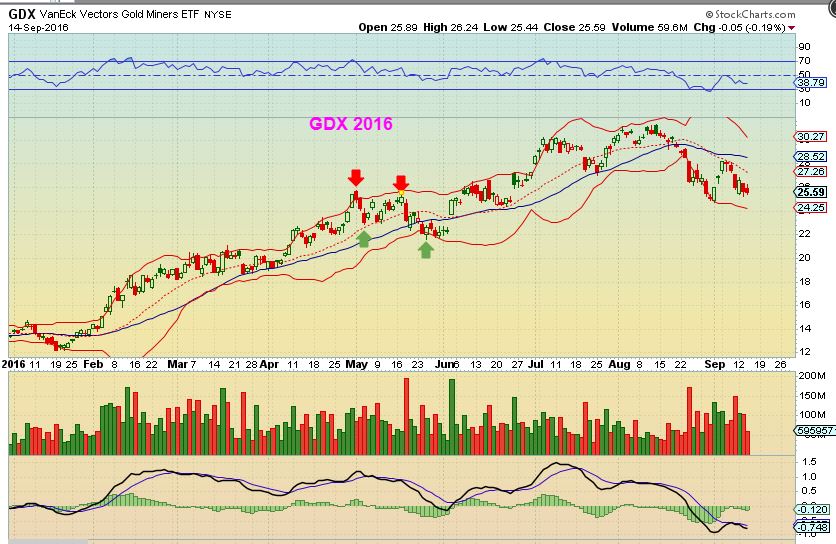
NEM – A this point I will inject a Bullish thought. Many of the Miners in 2016 broke from long bases like Gold, and DID NOT HAVE TO BACK TEST. They tagged the 50sma. They chopped sideways with each dip being bought. So I am NOT saying that a back test is necessary, just possible if we drop to an ICL in the normal timing range.
.
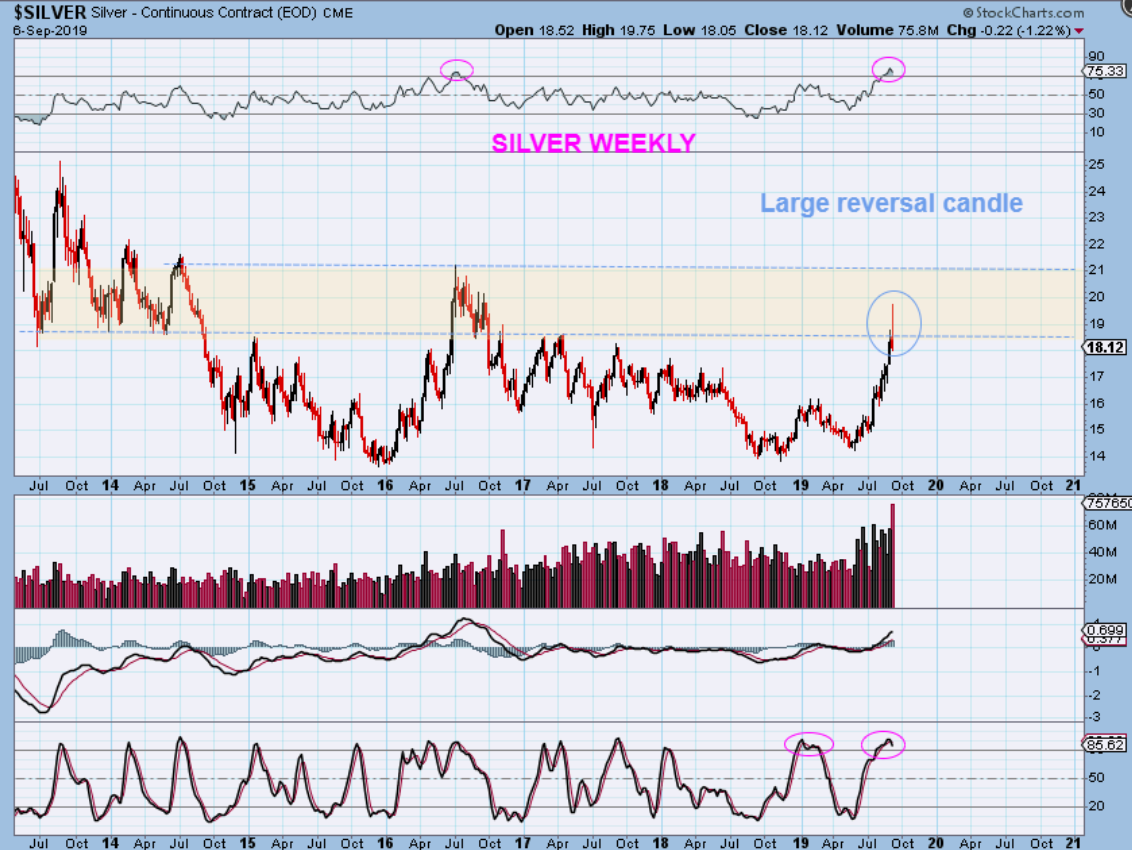
SILVER – Now when we look at SILVER, we see a very large reversal candle at an overbought stochastic & RSI too. LOOK AT THAT VOLUME . Let’s zoom in.
.
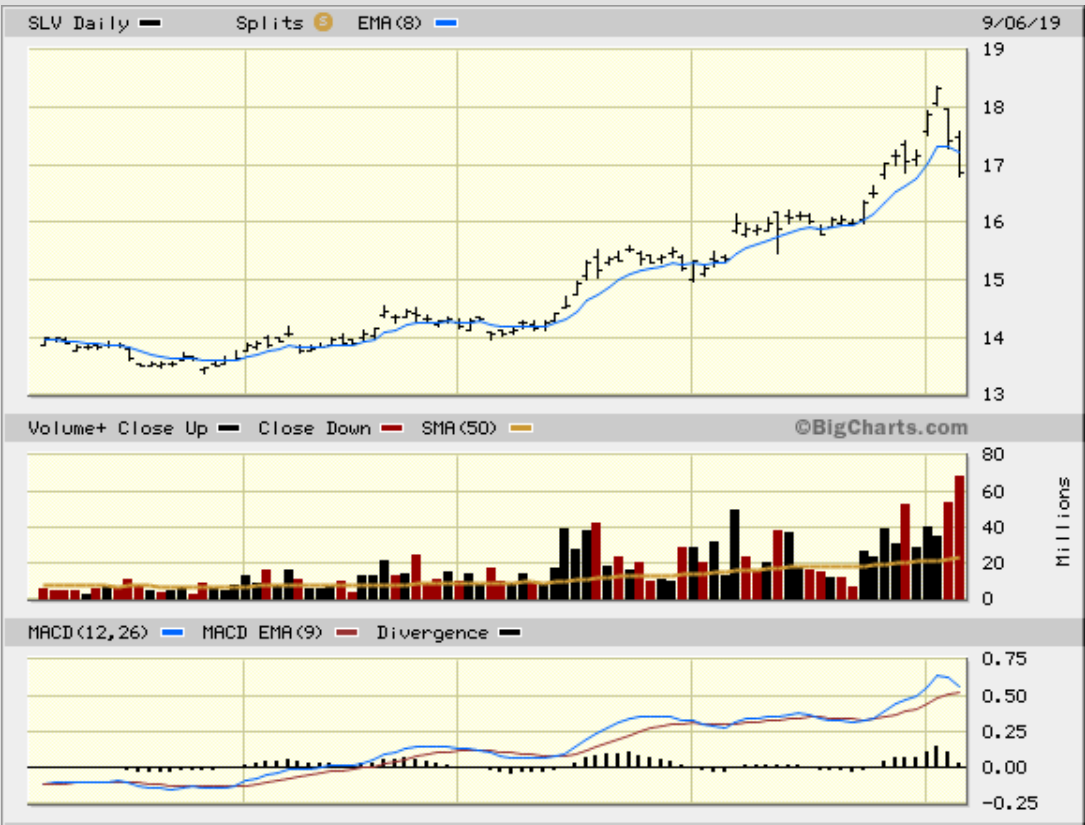
SLV – The 2 day drop was BIG and the Volume was too. We could a-b-c drop to $16 by the Fed Mtg, so hopefully we see a bounce soon.
.
SILVER WEEKLY CLOSE UP – So that big reversal candle could have follow through to these target areas between $16.50 & $17. We can watch for that.
GDX WEEKLY- This was my chart of GDX in the last weekend report. It warned of a reversal too.
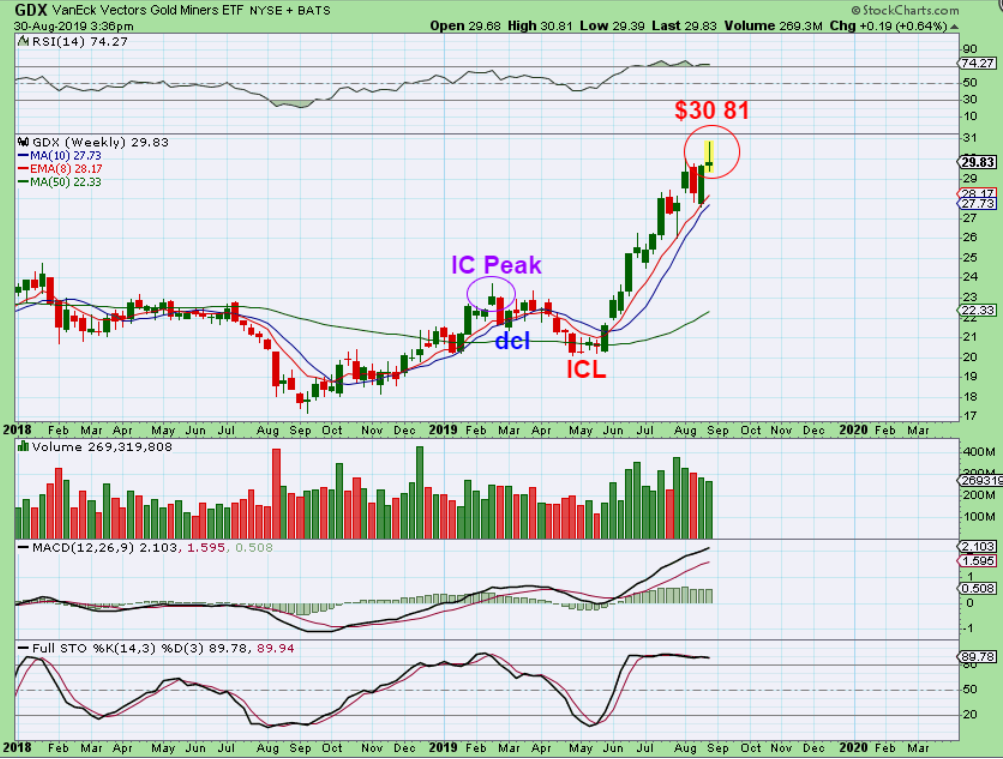
GDX – Last week I also posted this showing the shorter 4.5 peak, quick dip in May ( ICL) and then continuing rally. A long intermediate cycle followed by a short one. An a-b-c down should be seen…
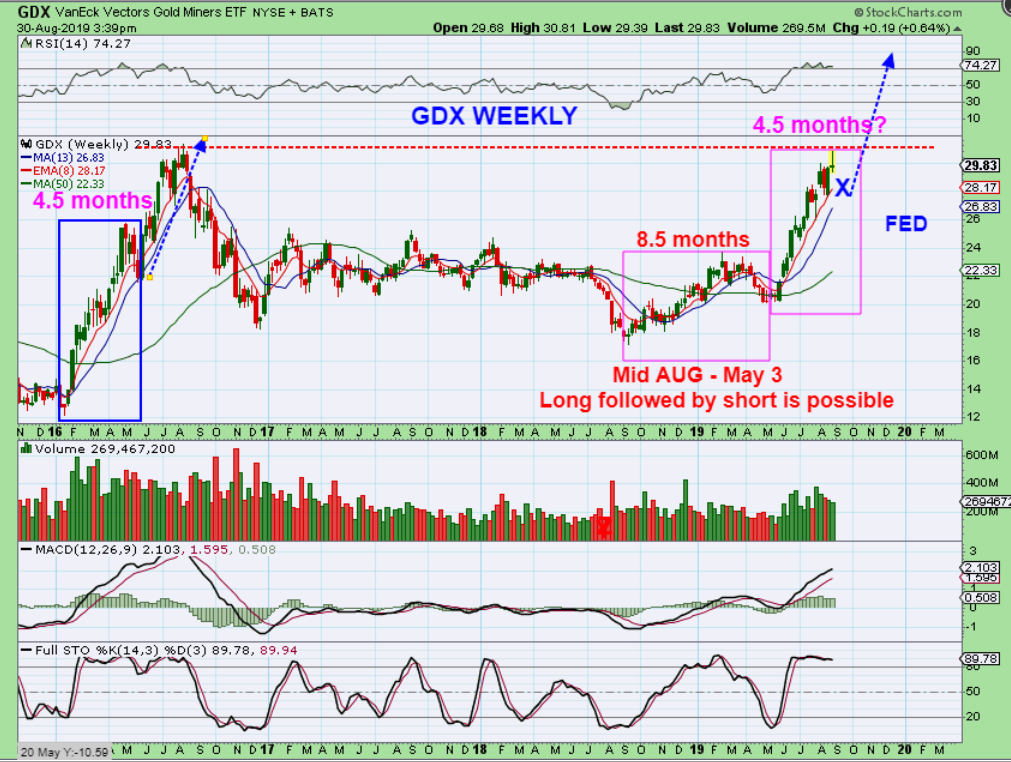
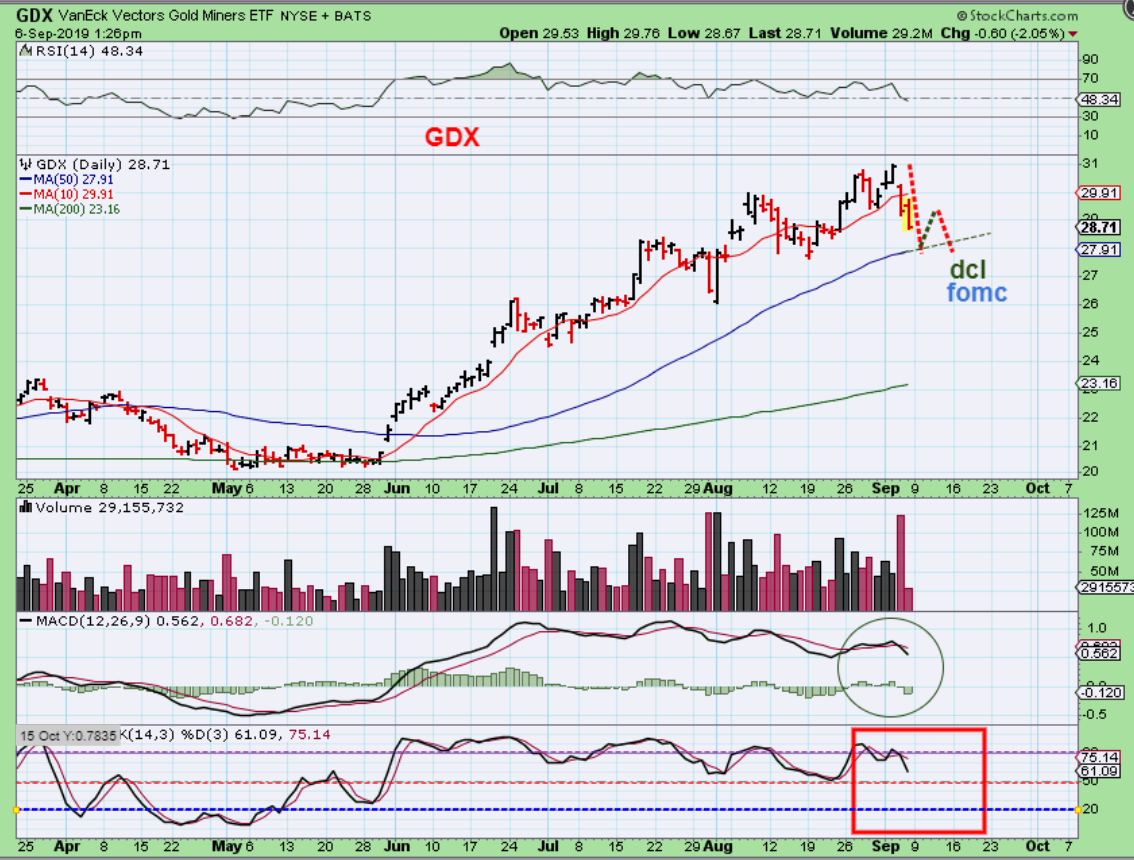
GDX – We could get a bounce next week off of the 50sma, and timing wise a dcl fits best after 30 days. Friday was day 25 for Gold.
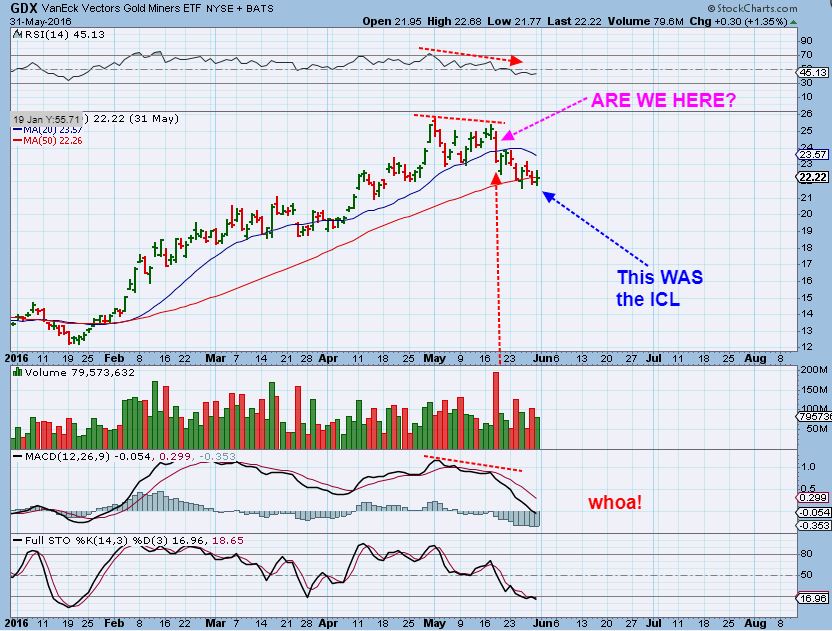
Remember this chart of the 2016 drop into an ICL in Fridays report? It was very mild and yet very choppy to the 50sma, and …
.
I posted this shot of it too– Stepping back, it was a small double top, a choppier period of trading that dropped into that ICL. It became the A-B-C drop that I look for.
.
GDX WEEKLY – I am looking at FIB TARGETS taken from this ICL to the peak. WATCH these areas $24.25 to $26.80 ish, but also …
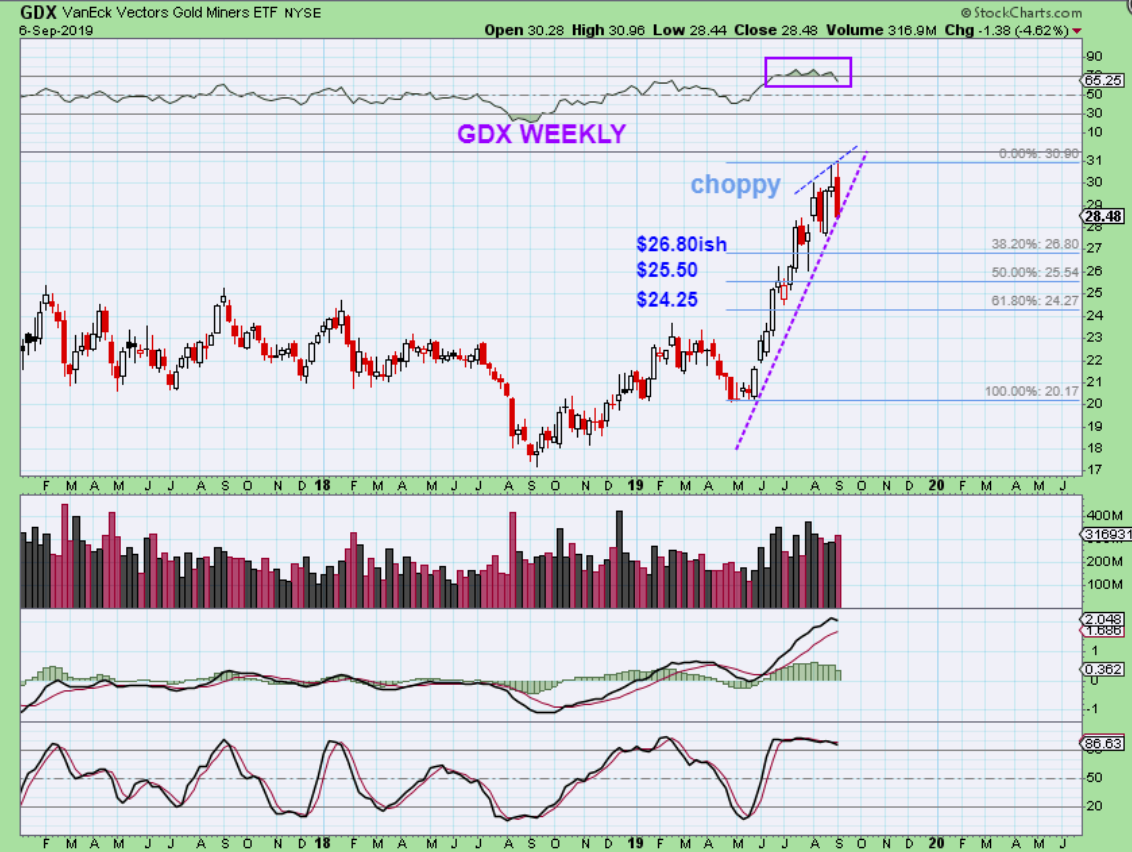
GDX – These Fib Targets come from the entire run from Lows to highs. Notice that the 38% is that back test if we get one, so again…
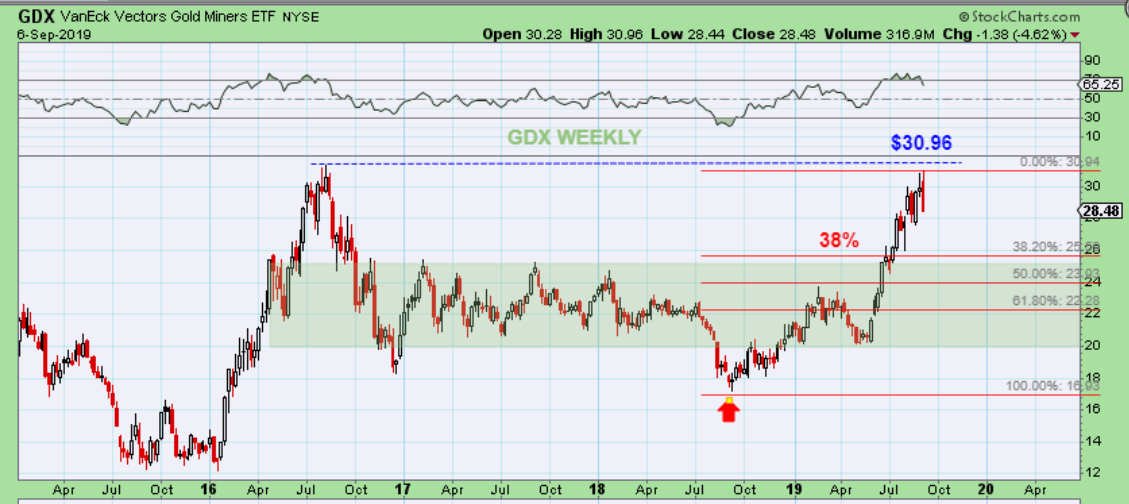
GDX – I cannot rule this out if we sell off after the FOMC meeting rather than rally (Contrarian). Pan and Handle .
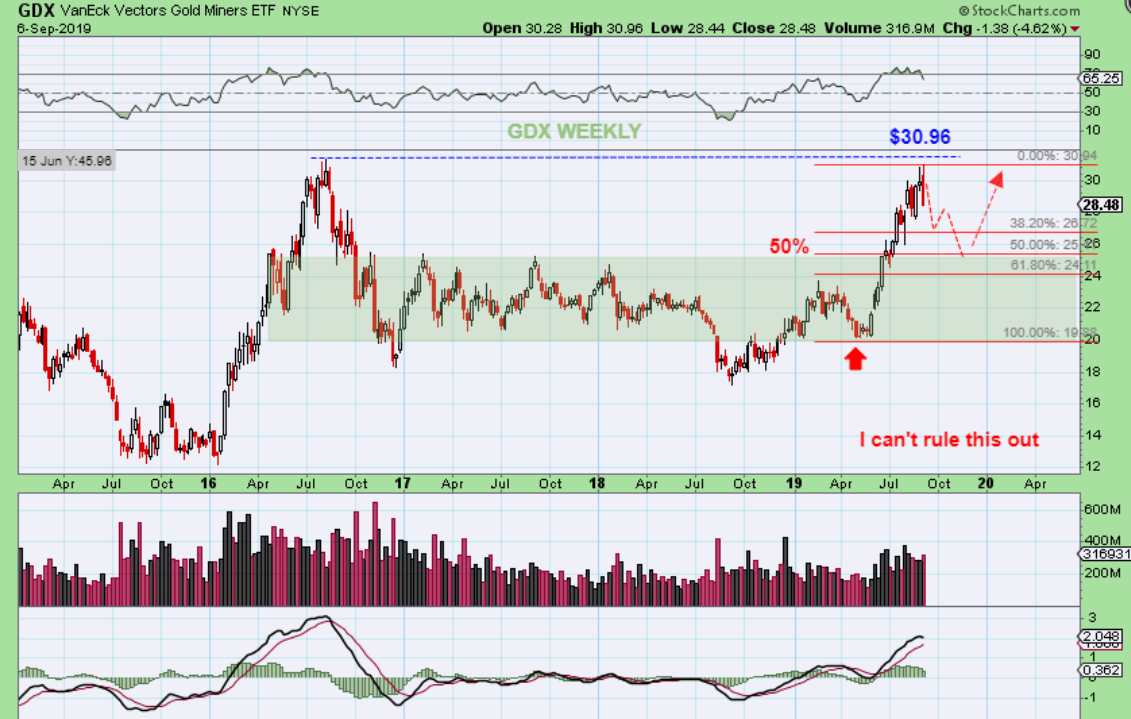
The coverage of the Precious Metals in this report takes on even a bit more of a cautionary approach. We have seen reversal candles in GOLD, SILVER, and GDX that I can’t just ignore. Now we have to watch the dip and take it step by step. the next DCL can be bought, it just needs to be monitored. In this report, I thought that it was important to share with you and help you to see what I see as 2 very valid possibilities.
1. We could drop into a dcl somewhere around the Fed Mtg, form that DCL, and then just rally onward and upward to new highs, or…
2. We could drop to a dcl, bounce to a lower high, and contrary to most peoples thinking, roll over post Fed into an eventual ICL. The timing for a normal peak & ICL in 5-6 months from May 3 is arriving. A drop to an ICL is not such a bad thing, since it would actually create another great buying opportunity, but you may need to consider what size ‘basket’ of the Miners you hold you’d want to keep if we get a drop into a deeper sell off.
We’ll just have to stay alert to the possibilities going forward.
Enjoy your weekend!
.
~ALEX
.
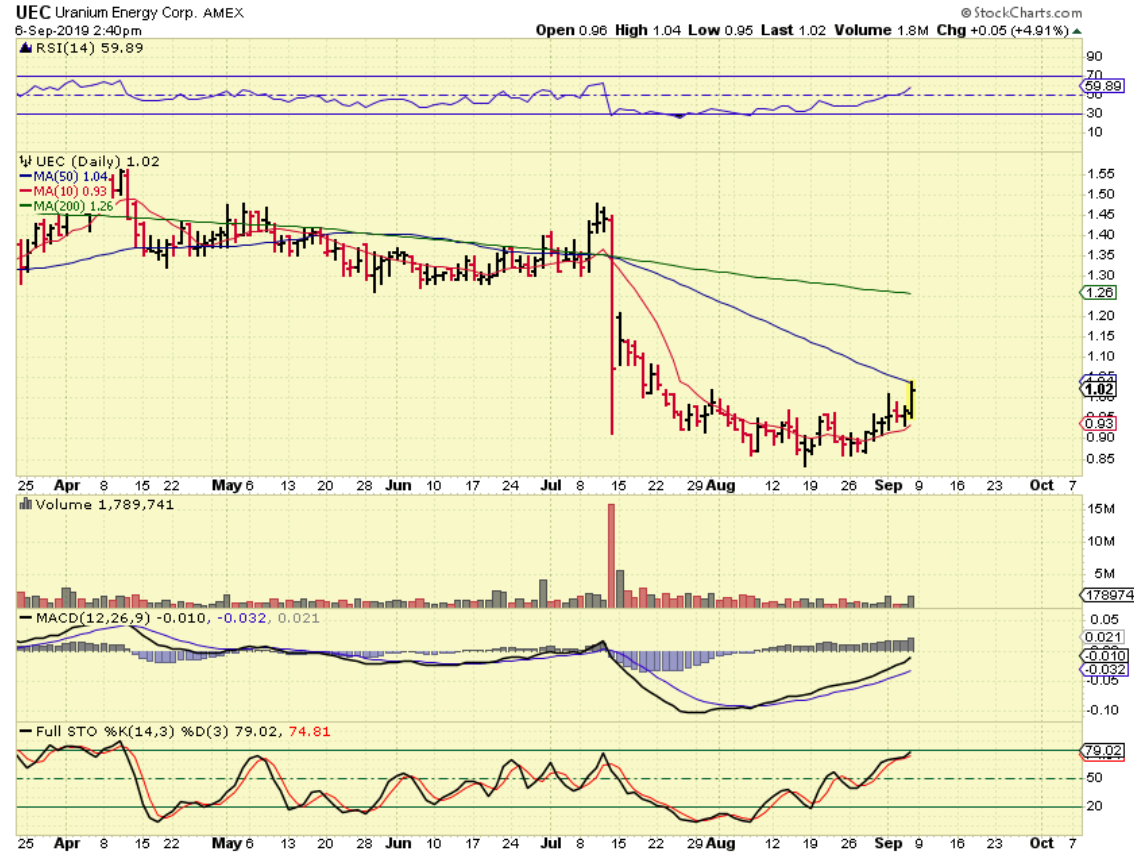
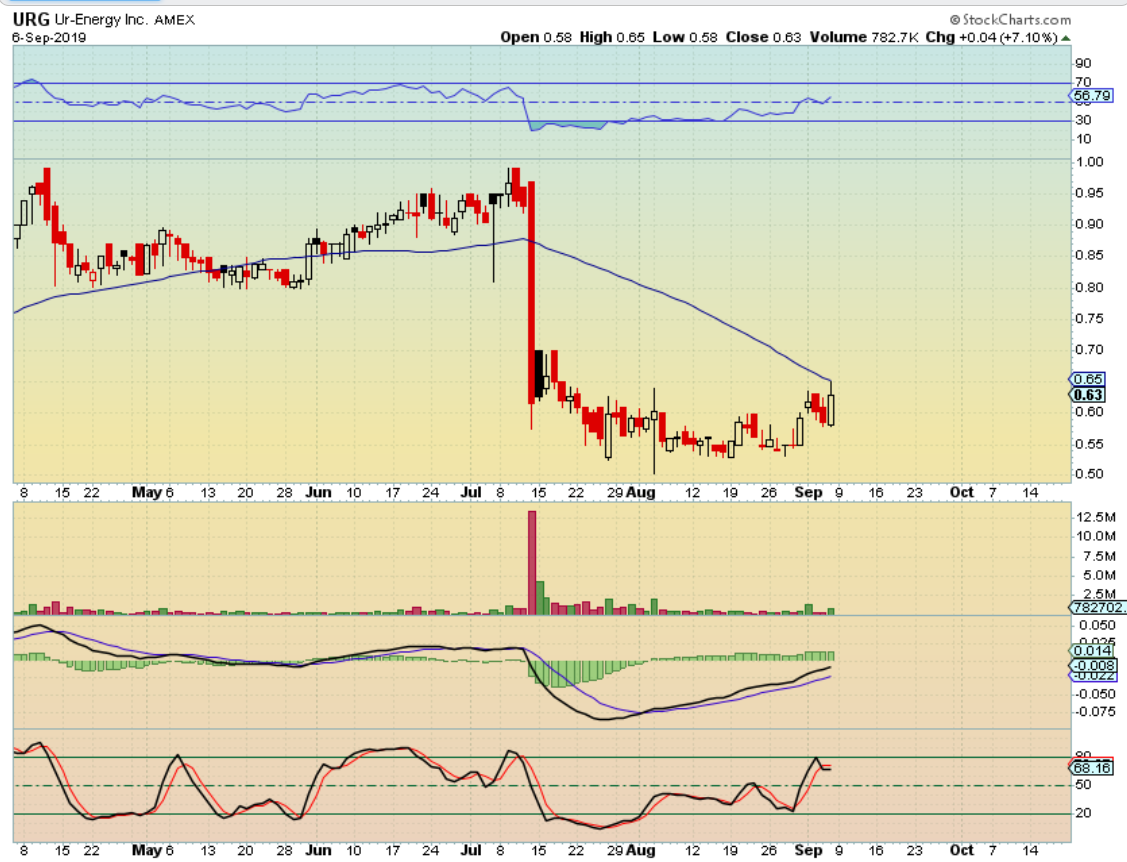
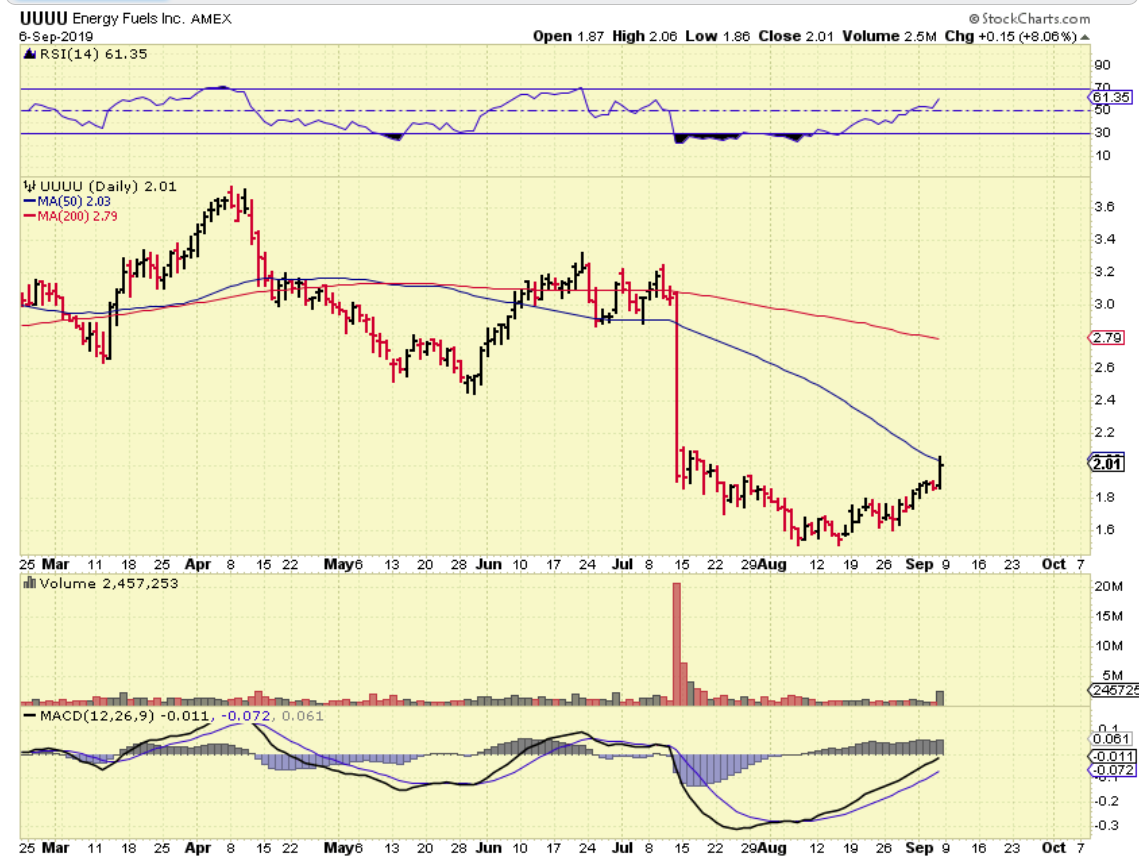
URANIUM STOCKS CRASHED & ARE RECOVERING, and I just thought that it was odd or maybe pretty cool how much these look so much alike. A rounding base bottom on all 3, so if you see just one break out higher, you might want to buy another expecting the same results. URG, UEC, UUUU, and even CCJ look this way. NXE & DNN look similar to each other too …
.
.
GOLD – I drew a wedge Wednesday too, and the wedge seemed to have broken to the downside ( which is expected for a bearish rising wedge), so I put this in the report. That said, it does NOT men we just topped for good, but Gold is selling down now.