August 10th Weekend Report
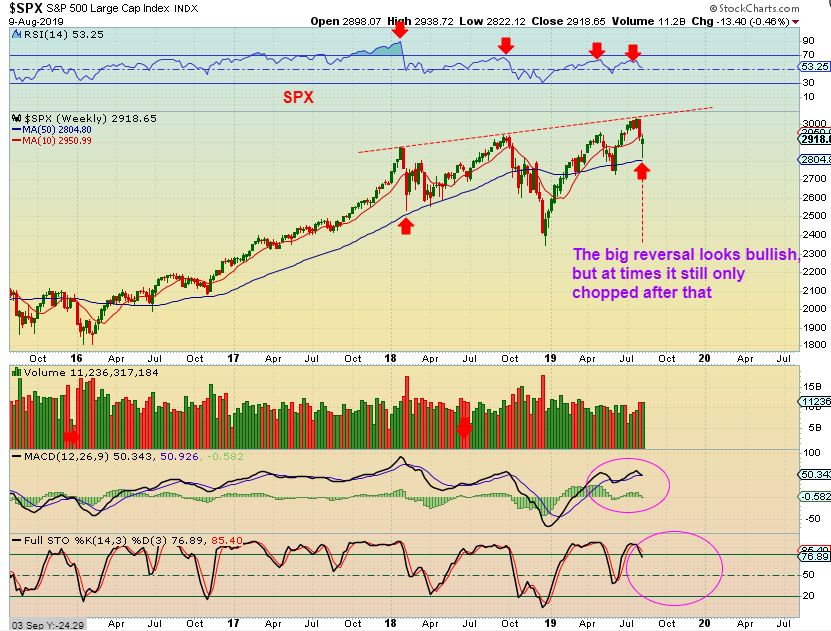
SPX WEEKLY – For those interested in going long the General Markets, we had a buy-able reversal this week and we’ll see how much upside it can produce. It may just be a shorter term bounce & then it could roll over, so raise stops (trailing stop).
.
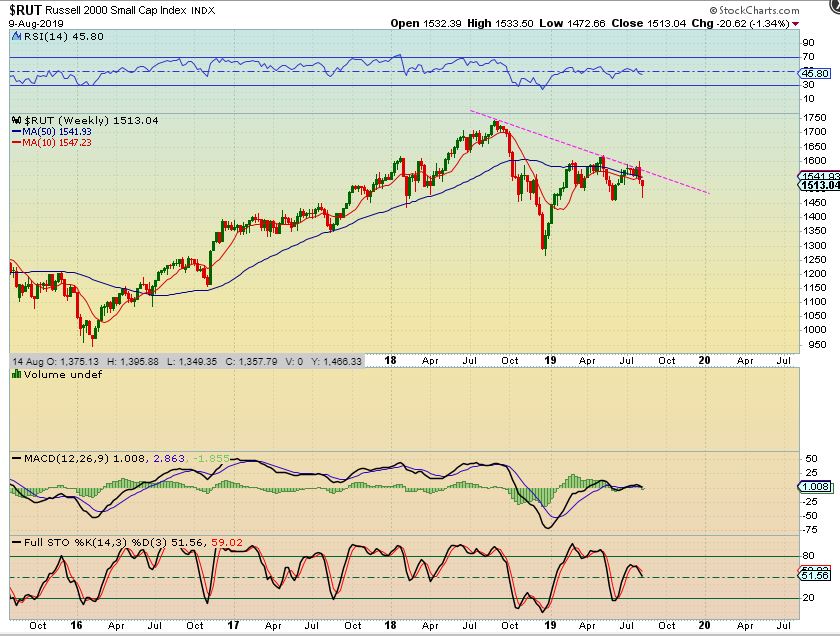
RUT WEEKLY – This downtrend line will be interesting to watch too, since the RUT also has a weekly reversal. A weekly close above it would be bullish looking.
.
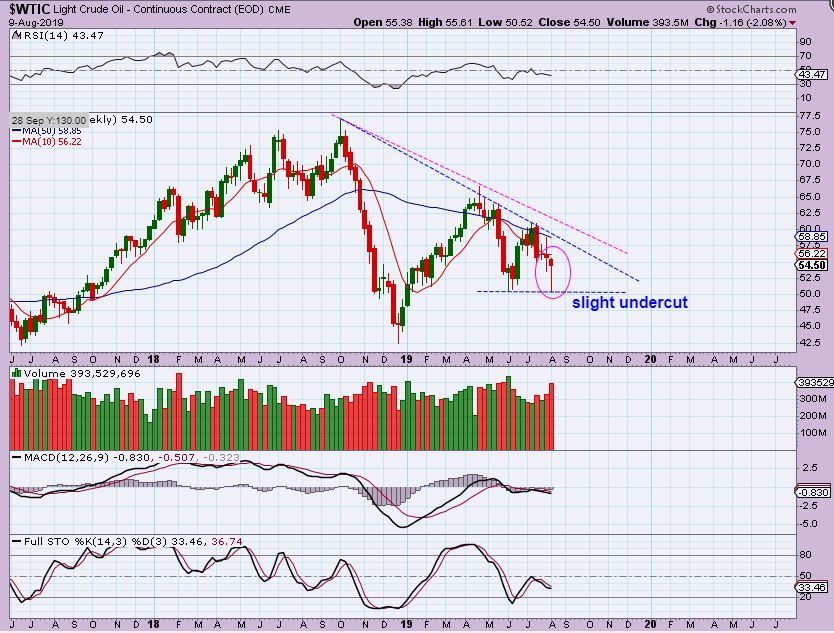
OIL WEEKLY – Oil put in a Big Reversal candle this week. Notice that Oil broke the June lows, and normally that would be a ‘failure’, but stepping back to the big picture has me wondering if the ICL was not in June. Is THIS the ICL? Decembers ICL to now would be 7-8 Months, and that actually would be normal for Oil too. Upside progress or failure will give us the answer, but Oil has been choppy and difficult lately. An ICL now may cause a trend higher, a break out, and finally a rally. So…
.
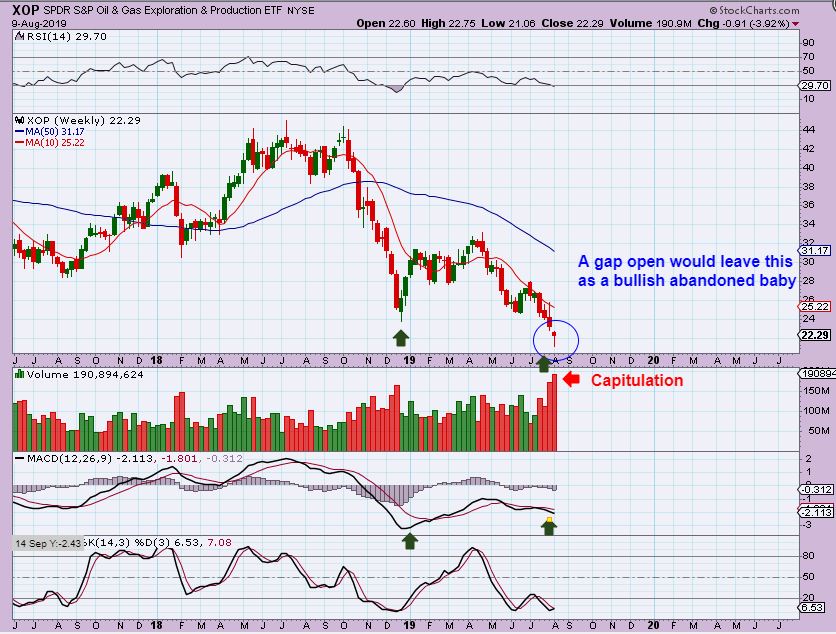
XOP WEEKLY – So I looked at XOP, OIH, XLE and saw reversals in all 3 also. Since this is possibly going to be a bullish move short term, it is a buy. We have capitulation type volume & an exhaustion gap down. If this gaps open Monday, that becomes an ‘abandoned baby’ – which I’d consider a strong buy. I also see strong divergence & oversold conditions.
.
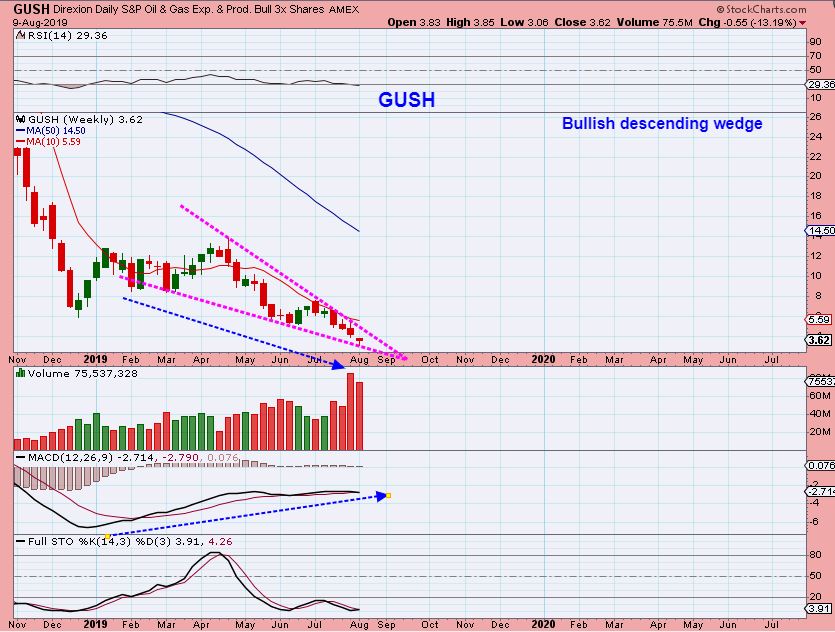
GUSH WEEKLY – GUSH is a leveraged OIL & GAS play, and I see a bullish descending wedge with STRONG DIVERGENCE here too. I decided to put in a bid under the closing price during after hrs trading Friday & I was picked up, so I own a position in this hammer reversal. This is risky, but I’ll watch it closely Monday.
.
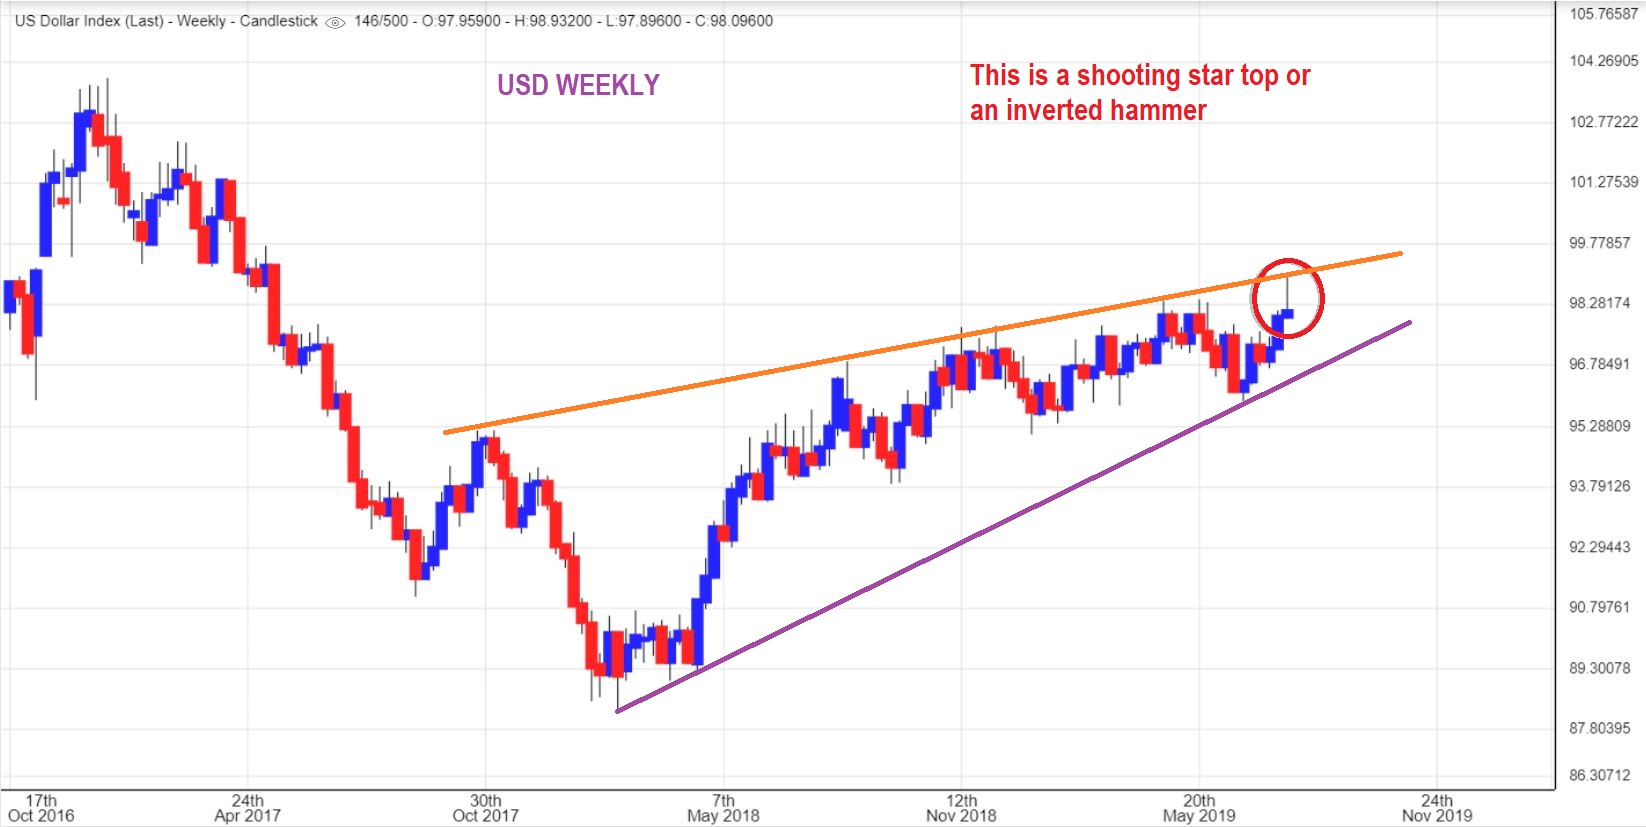
USD WEEKLY LAST WEEK – I saw a shooting start topping candle at resistance. I expected a drop from here.
.
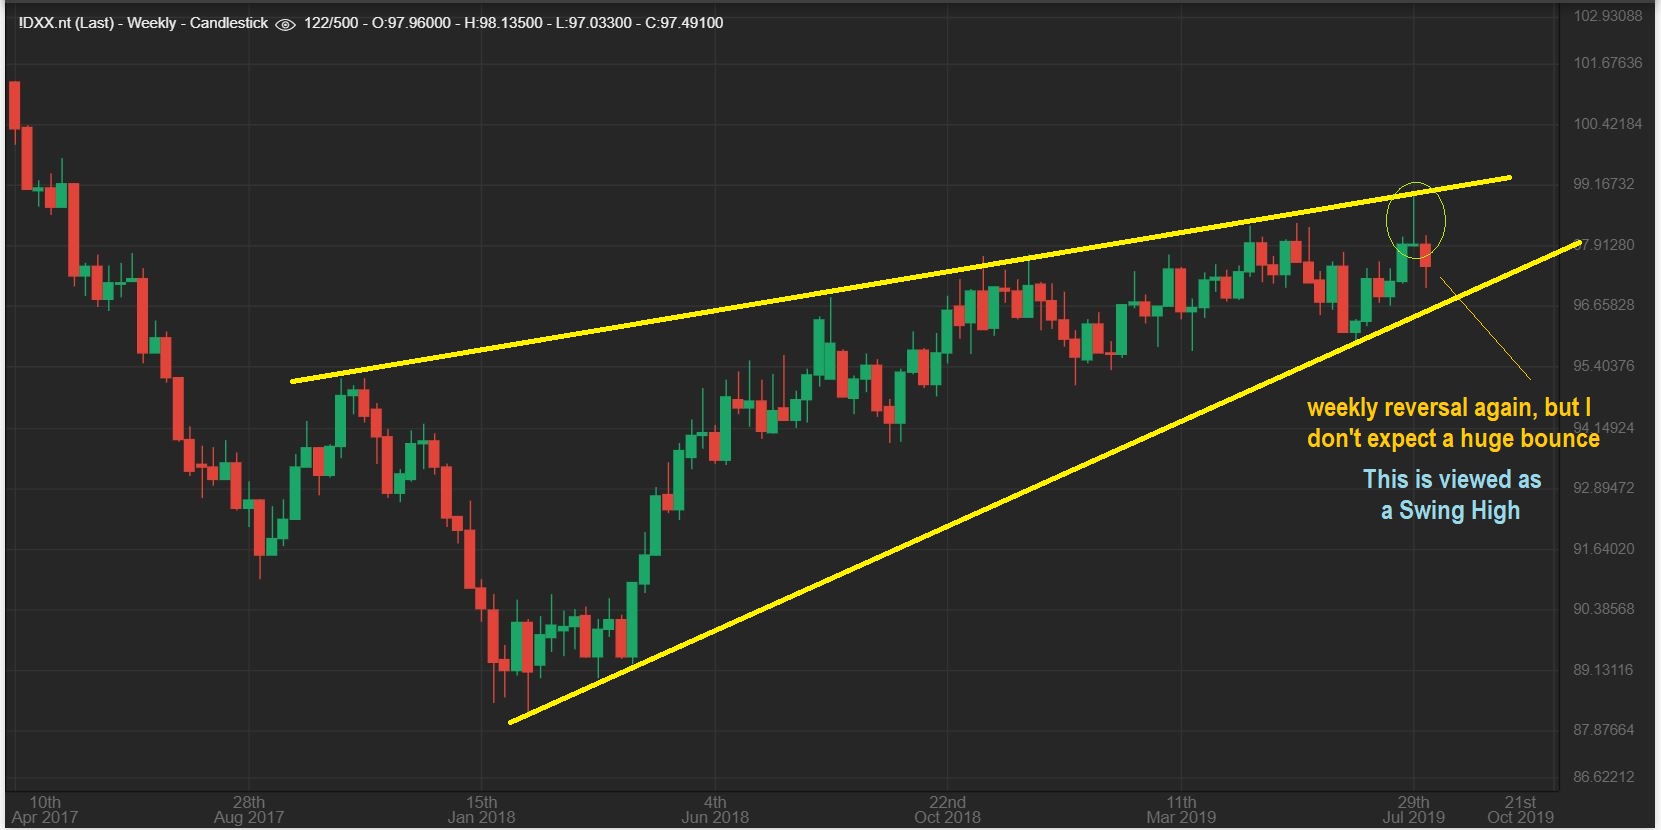
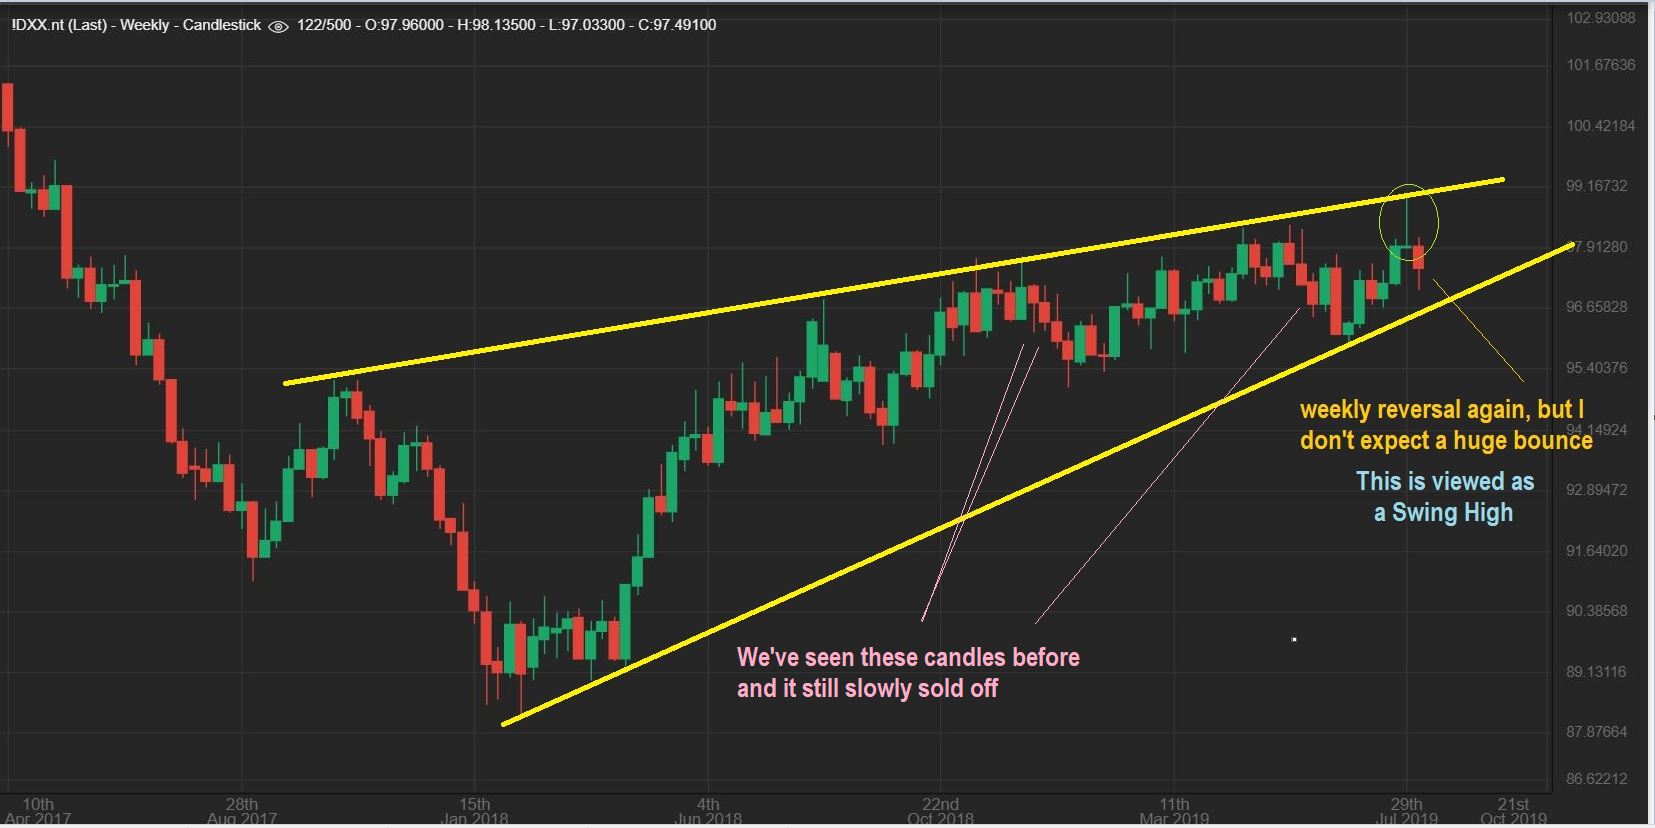
USD WEEKLY – This week we got the drop , but now we also have another type of reversal candle, so what do we make of it? Let’s go daily…
.
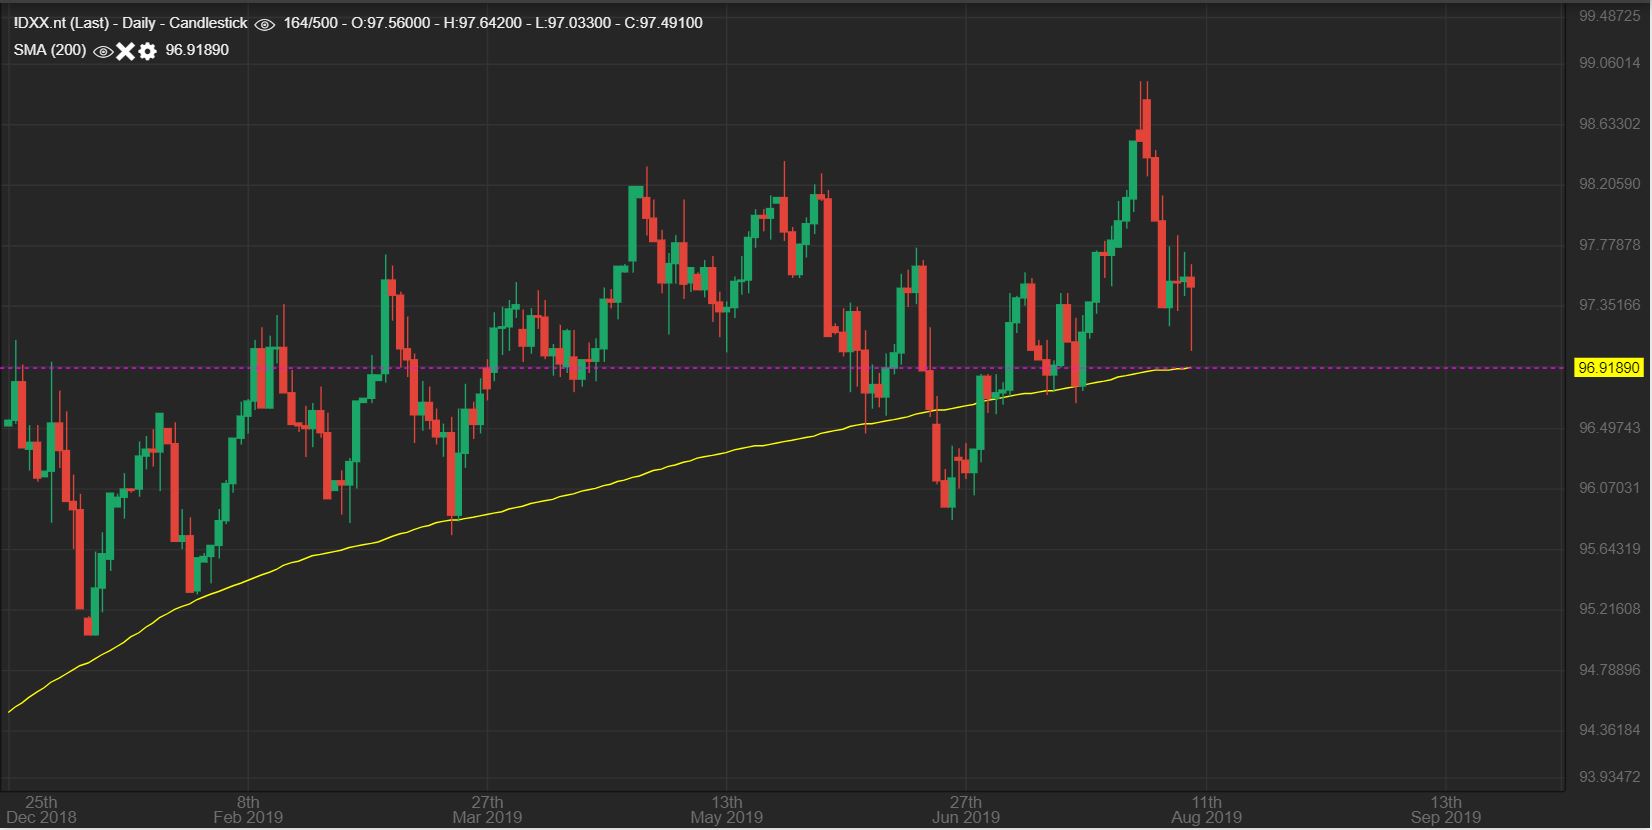
USD DAILY – Did the USD really do this big reversal Friday? I don’t recall that, but the closing price is correct. So price may bounce or chop short term or it may even break down further as a bear flag. Let’s just say that The USD has been choppy lately anyway, so it may not go far. Now we’ll go back to the weekly Chart…
.
USD WEEKLY – I have seen similar weekly candles that simply popped & dropped & Chop for a few days the following week, so the USD may just be choppy.
.
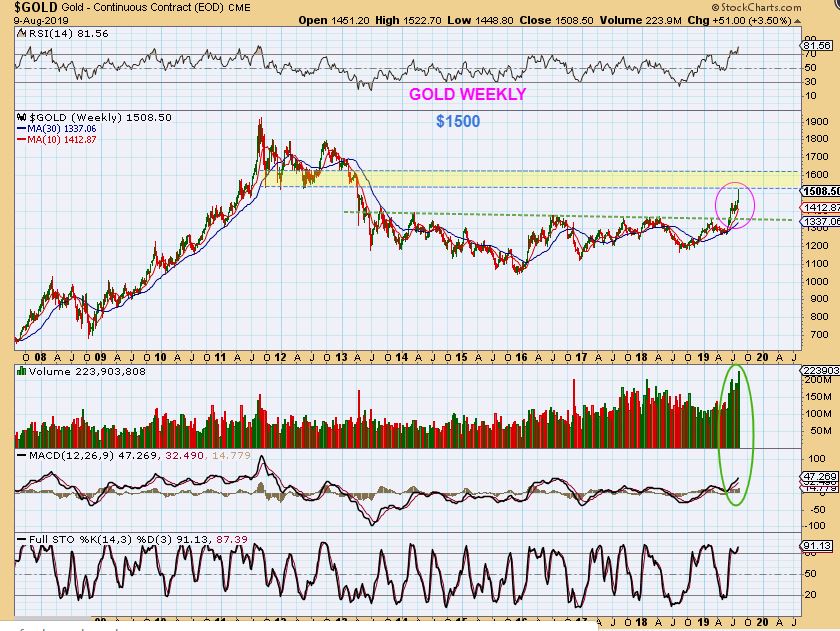
GOLD WEEKLY – Gold hit $1500 this week and is reaching what I see as a resistance area. Honestly, as this plays out, I see the strength in this move and feel that this CAN push right through resistance with that kind of volume. My initial target was $1500-$1550, but I still advise not selling Miners as it gets there (unless one gets very extended and you want to lock in profit and flip to another or buy a dip). Gold COULD push through resistance & continue higher.
.
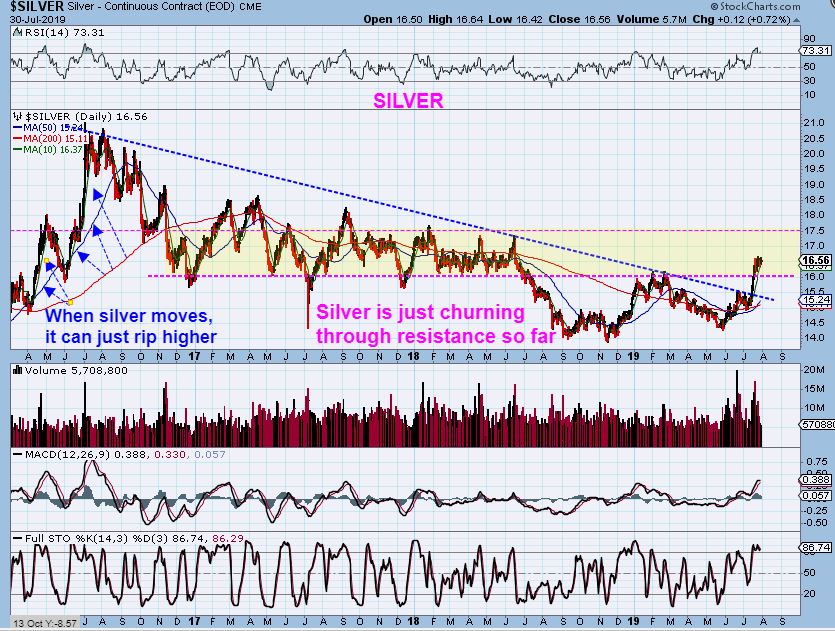
SILVER WEEKLY JULY 30 – For the last 2 weeks I’ve pointed out this resistance zone for Silver & mentioned that Silver is just pushing right through it.
.
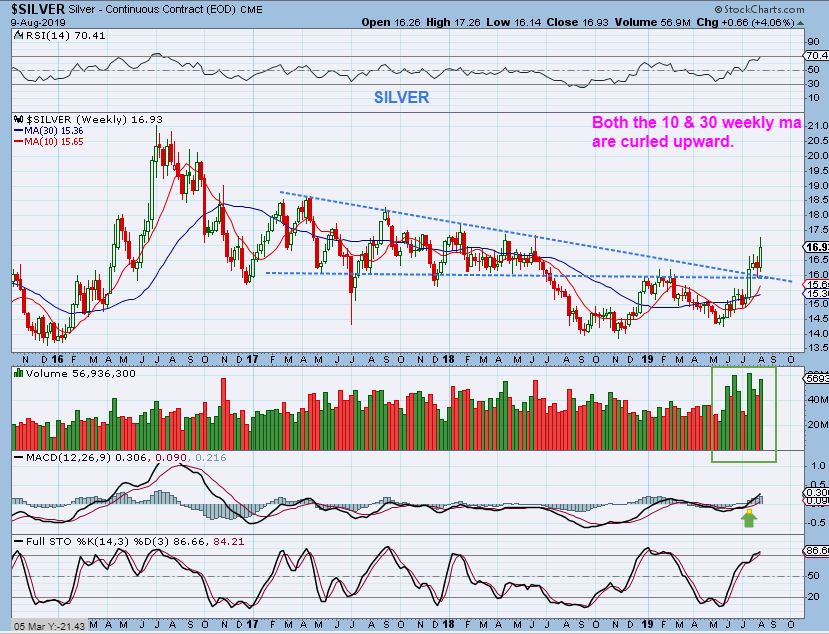
SILVER WEEKLY – Silver is still pushing through its resistance zone, and that is why I don’t want to underestimate Golds ability to do that too. Silver is also seeing increased volume as it breaks higher. Read the chart.
.
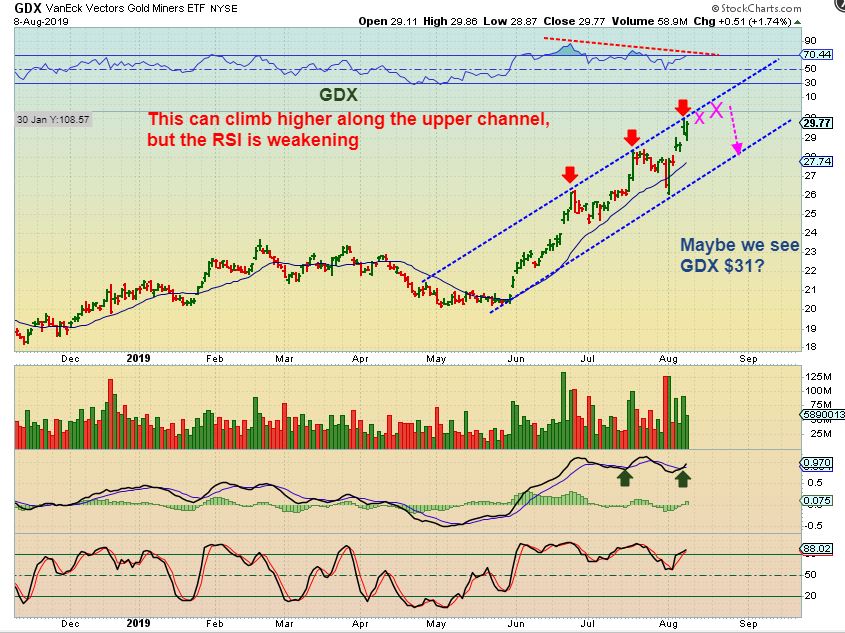
GDX AUG 8th DAILY – In the weekday reports, I showed that GDX is at resistance, but it can crawl higher. It COULD even break out & run parabolic , but the RSI seems to be weakening too.
.
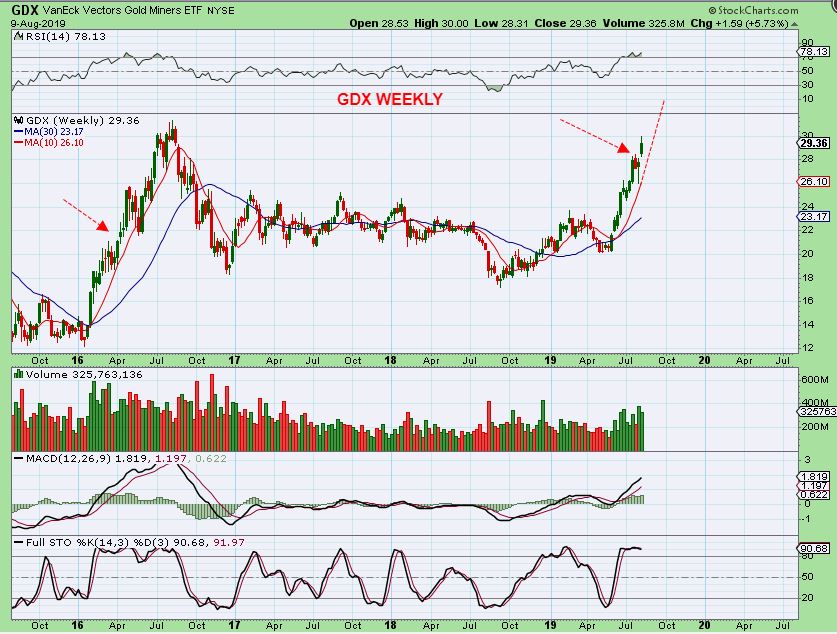
GDX WEEKLY – Normally, this can become a temporary topping candle, but I want to point out the bullish side to. There is a chance that we are right where this red arrow was in 2016. I will zoom in on that next. That area in 2016 also had a gap up & reversal candle, yet it just kept running higher. I sold my leverage Friday, but this could keep going & I may need to re-enter or add to Miners. Lets zoom in on 2016 weekly reversal candles…
.
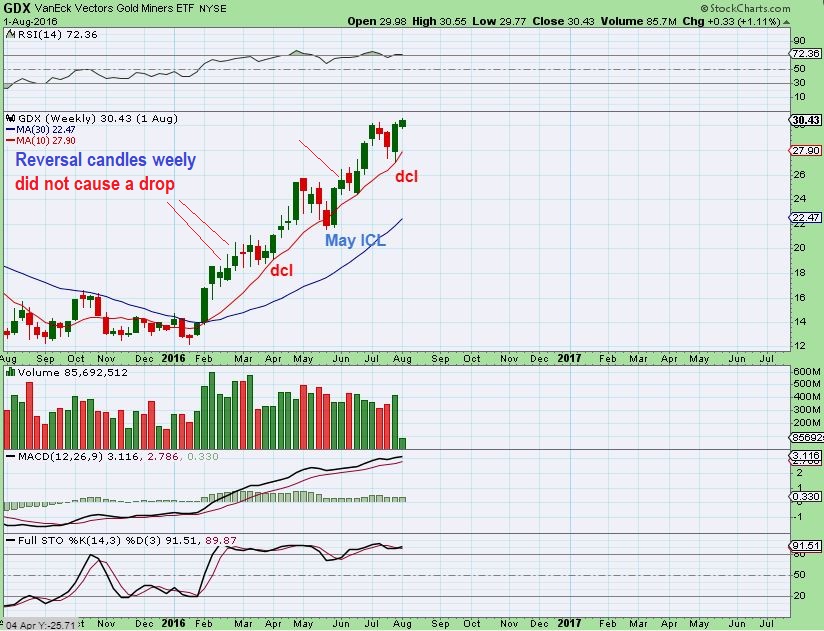
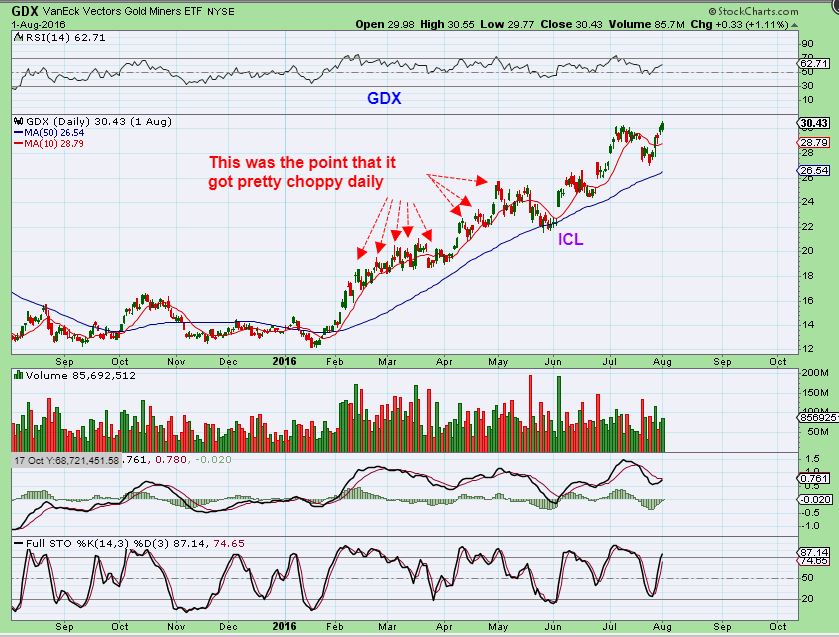
GDX WEEKLY 2016 – Notice that in 2016, We did have weekly reversal candles that did NOT reverse the price flow. Why not? These reversal candles were just a reflection of how choppy it got on a daily basis as price chopped up & down…
.
GDX DAILY 2016 – This is how choppy it got, so a weekly candle may have ended on a down day, but the trend was still higher. We may see something similar on this run as it has been a little sideways and choppy.
.
— Precious Metals: Week after Week has been rewarding for those holding Miners. Eventually we should expect a down week, but overall this has been a nice strong move out of the lows, and since we see Gold , Silver, and the Miners breaking out from multiyear bases- the trend should now be an uptrend.
— The General Markets are starting to bounce from a low, and we’ll see how much progress they can make.
— Oil is becoming interesting. It sold off again and then put in a strong reversal. The Oil / Energy stocks were beaten down badly. Some companies that I used to trade in the $7-$20 price range are now as low as $1 – $4 stocks ( See 2 yr charts of LPI, OAS, WTI, BAS, DNR, KEG, NOG, etc). Some are forming bases, so this sector could get interesting too.
— Each week I’ve mentioned that I am seeing things in the MJ Sector slowly setting up bullishly too. I see some buy opportunities and other companies seem to be ‘setting up’ . I may mention specifics in the future, but for now I own personally bought HEXO & EDXC as a trade this week (possibly more if they continue to act properly). I look forward to seeing what next week brings, as these other sectors seem to be coming to life too, but I will remain mostly focused on the Precious Metals through this intermediate cycle.
— Below I will add a little extra information of what I am seeing & thinking about with Silver.
.
Enjoy your weekend!
.
~ALEX
.
SILVER – STARE AT THIS CHART OF SILVER PLEASE. I EXPECT A CUP TO FORM AS PRICE RUNS TO PRIOR HIGHS…
GDXJ – COMPARE THIS JUNE CHART WITH THAT SILVER CHART ABOVE. THIS CHART OF GDXJ THEN IS ALMOST A TWIN OF SILVER NOW. SCROLL UP & BACK AND SEE FOR YOURSELF. SO WHAT HAS GDXJ DONE?
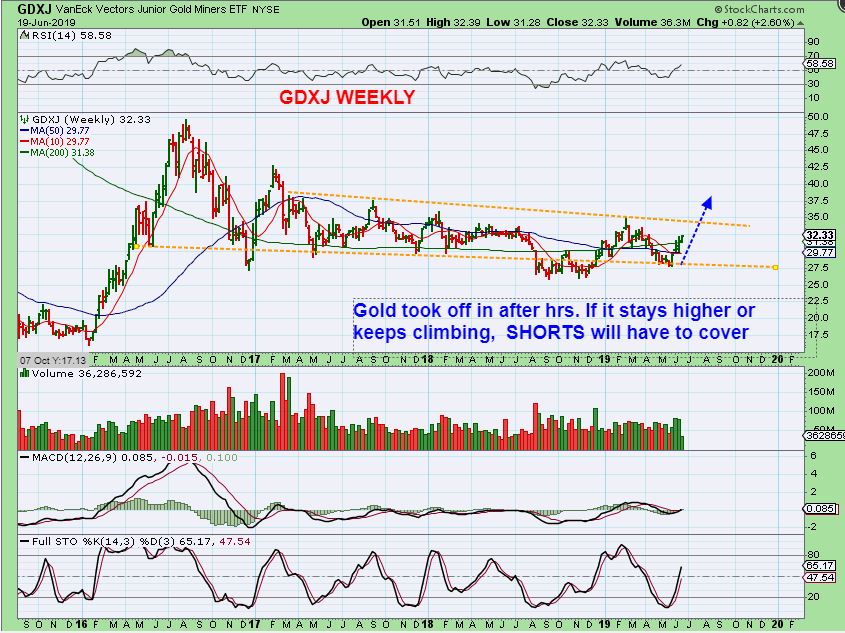
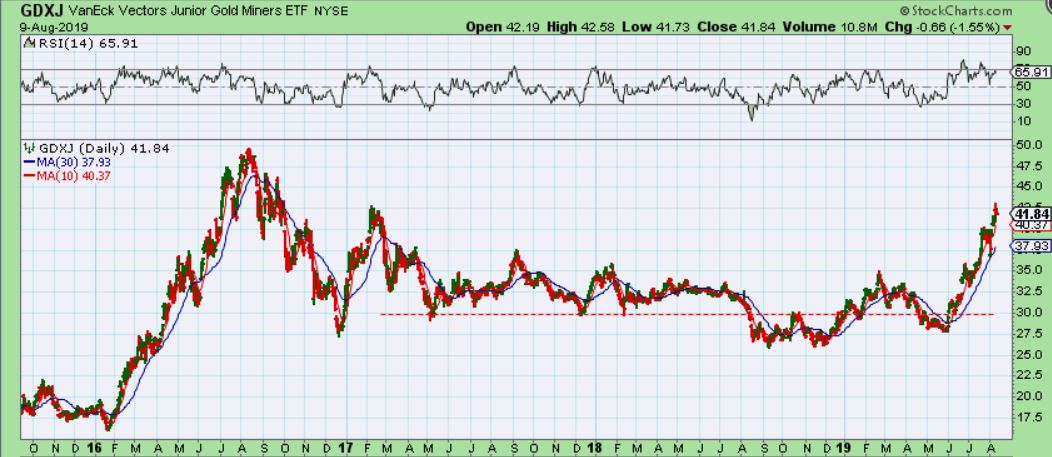
GDXJ – With the same pattern as Silver, GDXJ has since been rallying & forming that cup that I was expecting. My point? I expect Silver to do this too. Since Silver stocks are already doing very well, what would I expect when Silver does what GDXJ is doing? …
.
Could they get even more bullish? YES! So I’ve been saying that I am not recommending selling out of Silver stocks like CDE, USAS, AG, EXK, FSM, SSRM, etc . Taking partial profits is rewarding & fine, but I want to hold a basket of Miners, and Silver can really benefit. Well I want to highlight that further in todays report.
.
So I have pointed out that Silver is set up the way that GDXJ was in June, and knowing that GDXJ rallied higher and that Silver should do that too, let me show you something else…
.
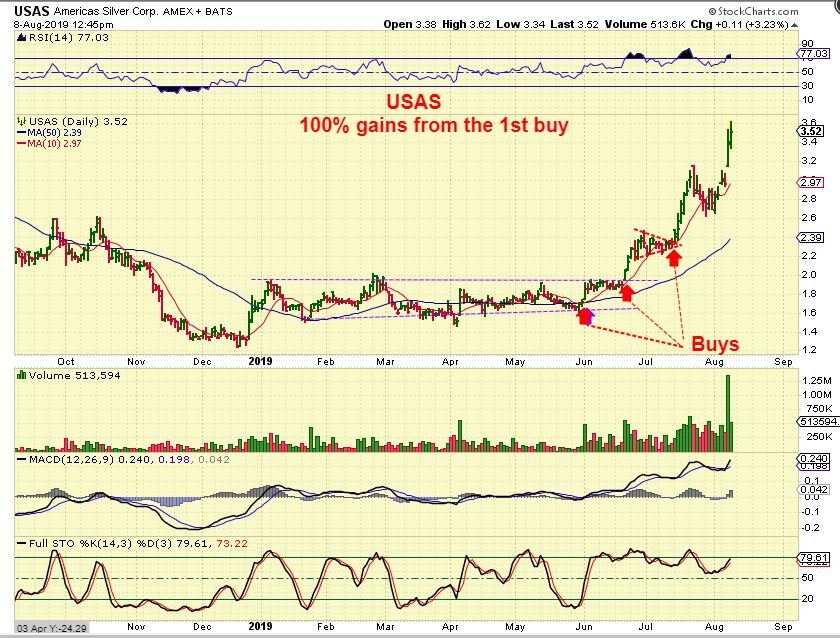
USAS – I used to point out this 2019 6 month base repeatedly, and encouraged buying it. LOOK AT THIS 6 MONTH BASE PLEASE…
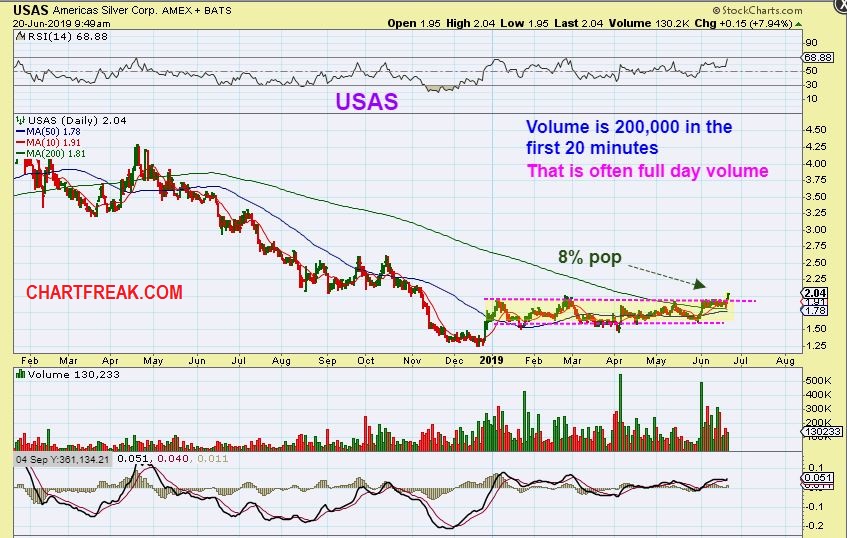
USAS –
1. Silver is breaking a base, and look how price can move as it breaks from a base.
2. As USAS was breaking from the base, it rallied steadily, with normal pullbacks.
3. BUT WHAT IF SILVER REALLY TAKES OFF LIKE GDXJ? Is USAS done running?
.
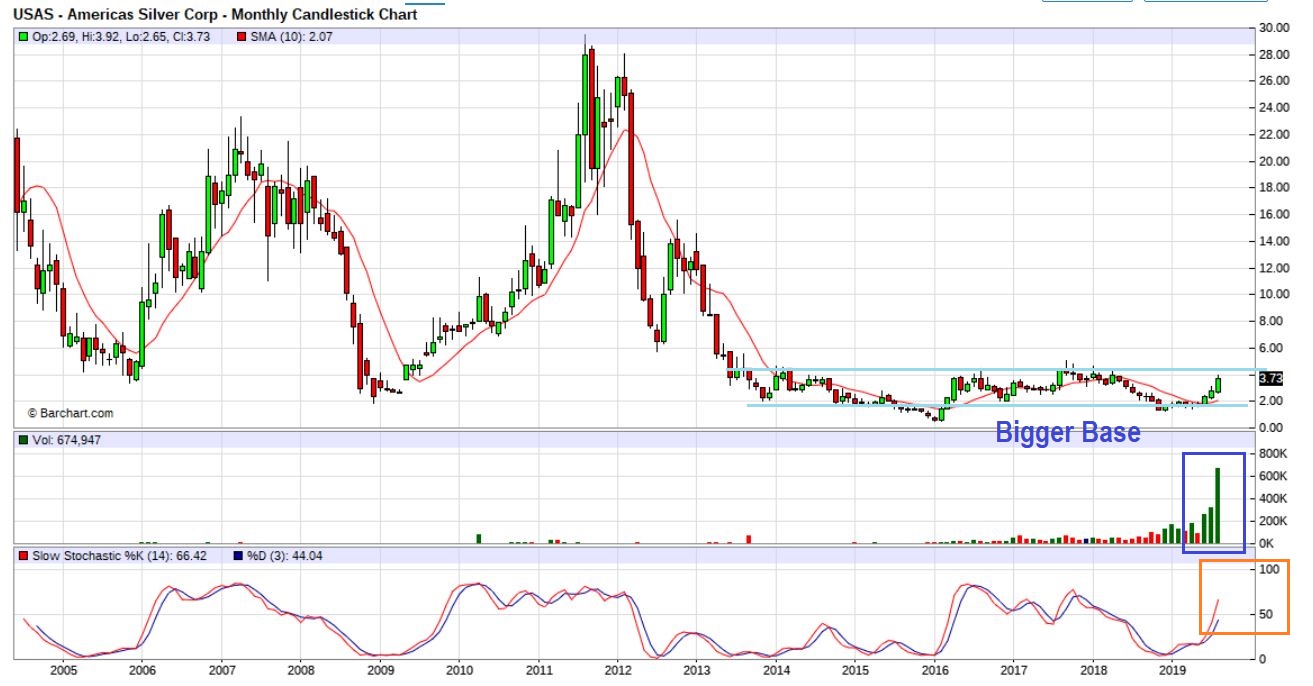
USAS MONTHLY – That 6 month 2019 base is now just a tiny flat floor, and we are forming a giant 6 year base! Do you see the upside potential if & when this 6 year base breaks? I am NOT selling my Silver miners that are releasing earnings and getting this kind of response. ( I just realized that Volumes are incorrect as provided by this charting service, but they really are very strong – next chart).
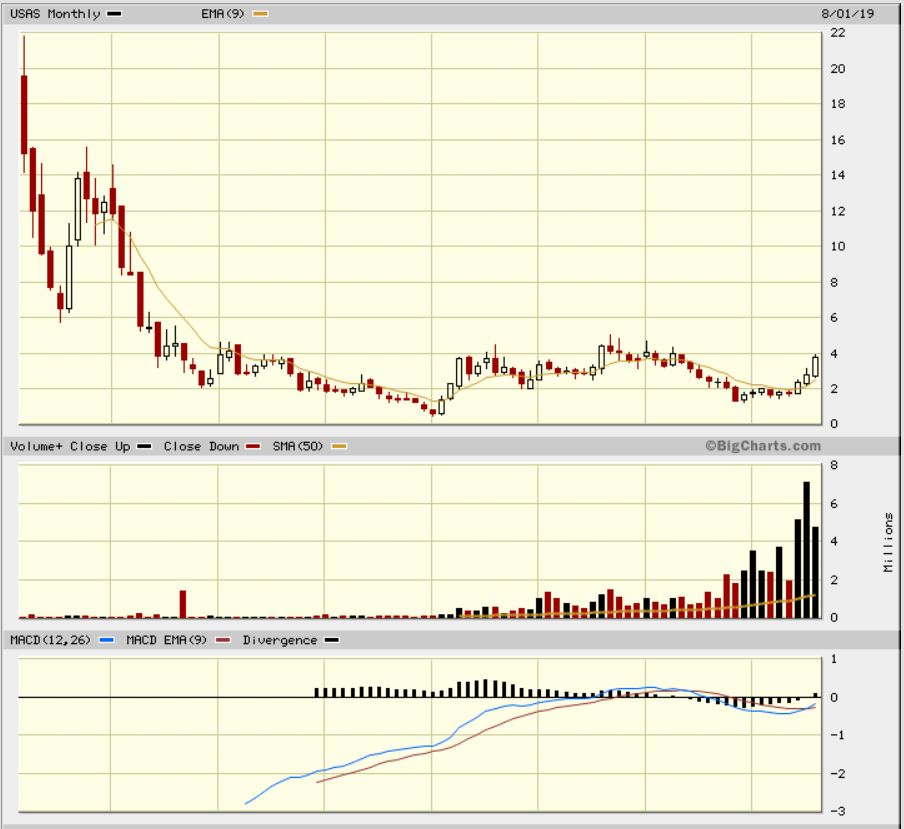
USAS MONTHLY – These are the correct volumes, and you can see that this push higher has a lot of energy, yet is still a massive base. This may not go straight up every month, but over time anyone that bought that small flat base near $2 should be able to ride out the dips.
.
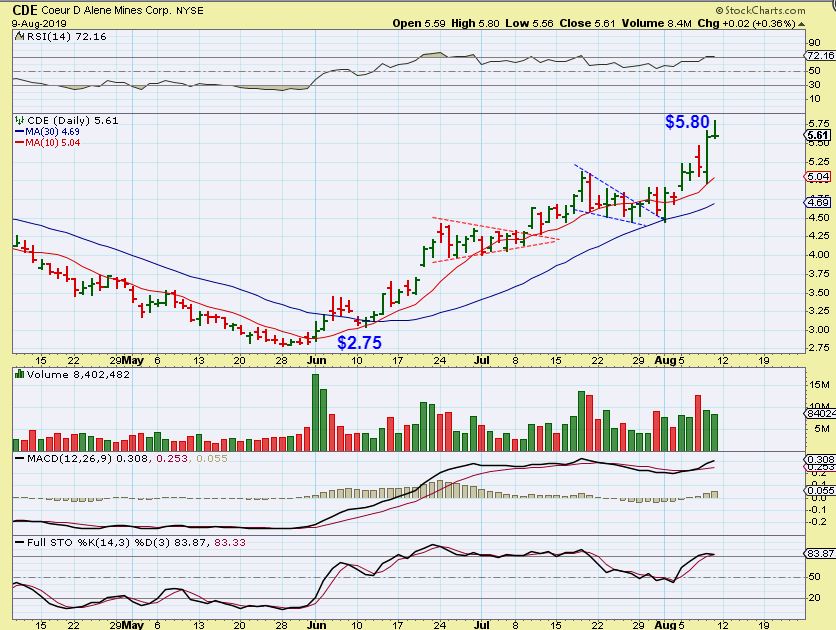
CDE DAILY– After releasing earnings, CDE continued higher this week. CDE has more than doubled from the lows, yet it has been choppy at times and not been straight up. After earnings it continued climbing…
.
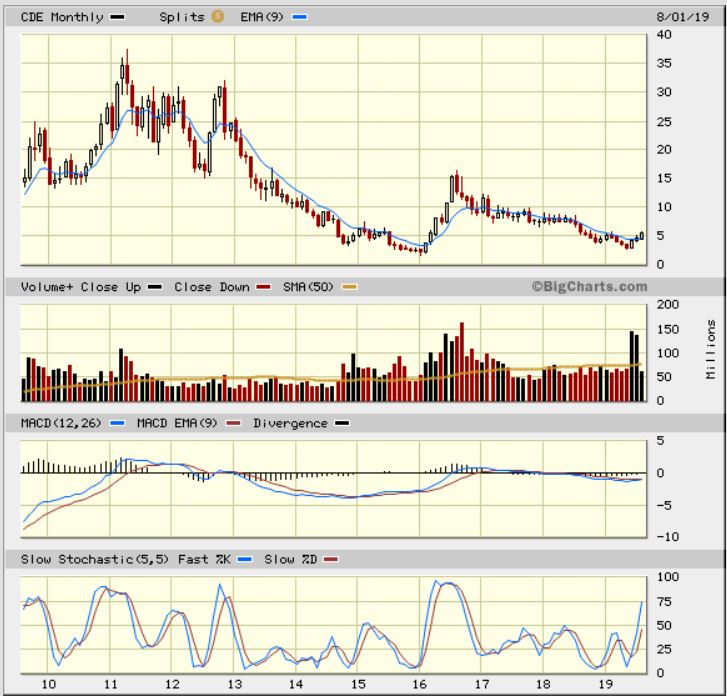
CDE GIANT POTENTIAL – Now think about this. I just said that CDE has doubled off of the lows, but doesn’t that 100%+ move look very small compared to the potential? That is a tiny move compared to what may be ahead. Again, I just realized that this charting service reflects volume it inaccurately, so the next chart will help…
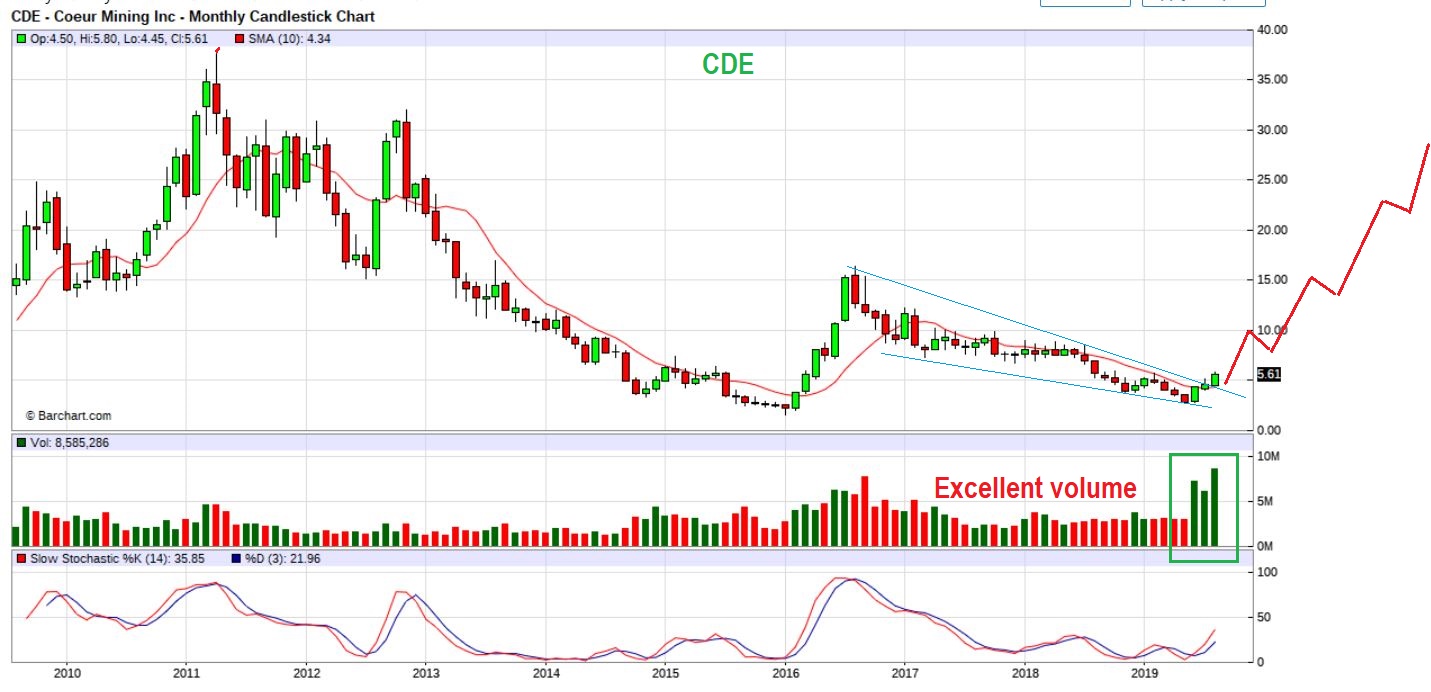
CDE GIANT POTENTIAL – This volume is accurate. It has been double the average monthly volume and this month is not even 1/2 over. Also take a look again at the big rally that we just had where price doubled. It looks tiny compared to what should be coming over time. 🙂
.
CONCLUSION:
SILVER – I EXPECT A ‘CUP’ OR ‘PAN’ TO FORM AS PRICE RUNS TO PRIOR HIGHS, SIMILAR TO GDXJ…

