
August 3rd – After the Fed Volatility, It’s Time To Rest Up
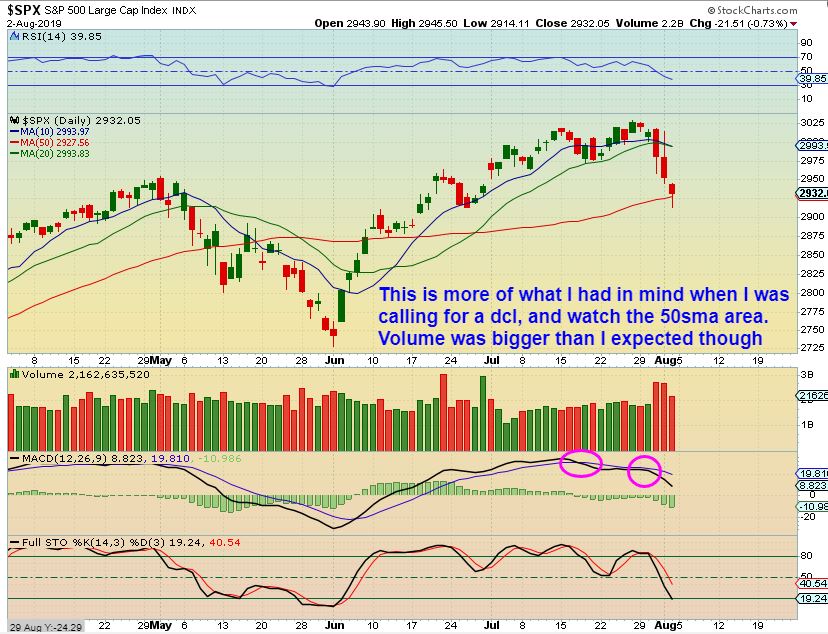
SPX DAILY – I have mentioned in the past that I was thinking that the SPX would drop to the 50sma for a dcl. This could be what we are seeing now, but the markets are taking on the appearance of a topping market in some ways too. I want to see how the next daily cycle plays out. It could run to the highs, chop around, and roll over.
SPX WEEKLY – This chart is a sign of weakness at the top. The Markets dropped Post Fed and remained near the lows Friday, the Miners recovered. This may be the start of the big picture trend going forward for the end of 2019. Markets lower / Miners higher.

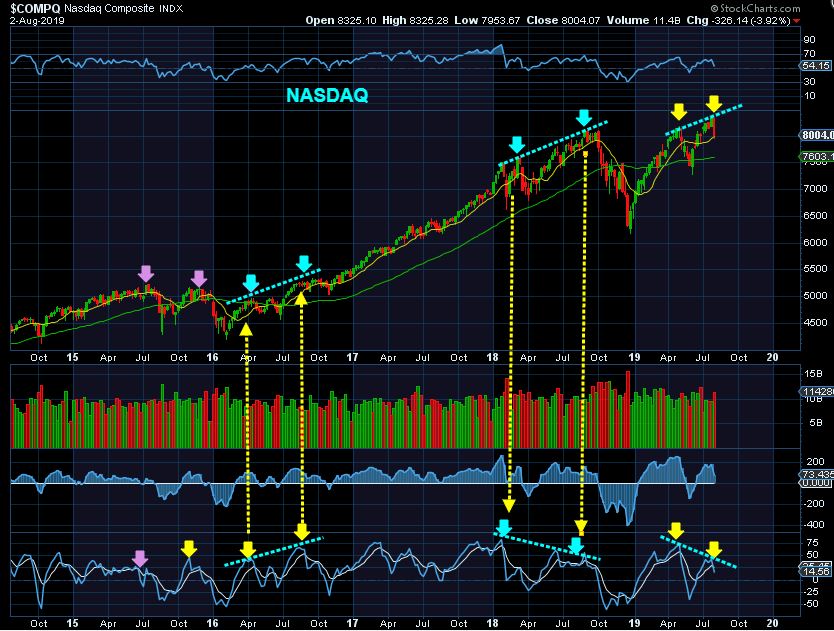
NASDAQ WEEKLY – The NASDAQ has the same weakness showing up now.
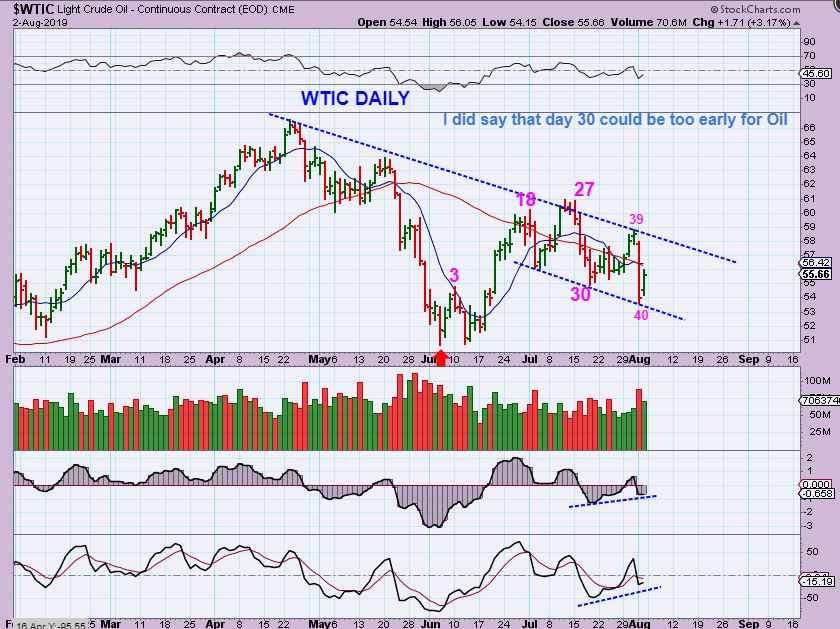
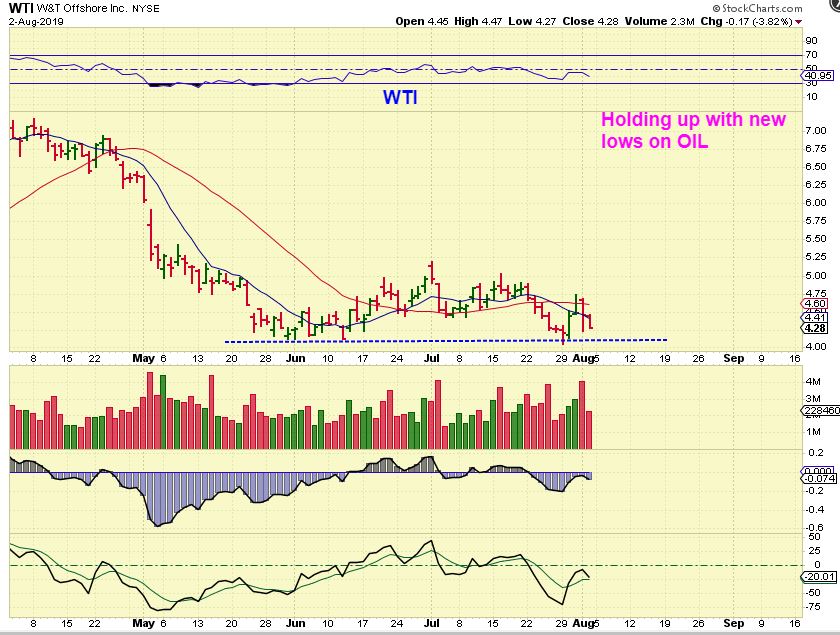
WTIC DAILY – Oil has been very difficult with its large swinging chop, but this may be the dcl coming into play. I mentioned day 30 as a possible DCL , but I said that that is often early for Oil, which runs 40-50+ days often. We are on day 41 (or 1). DIVERGENCE HAS SHOWED UP AT THE LOWS.
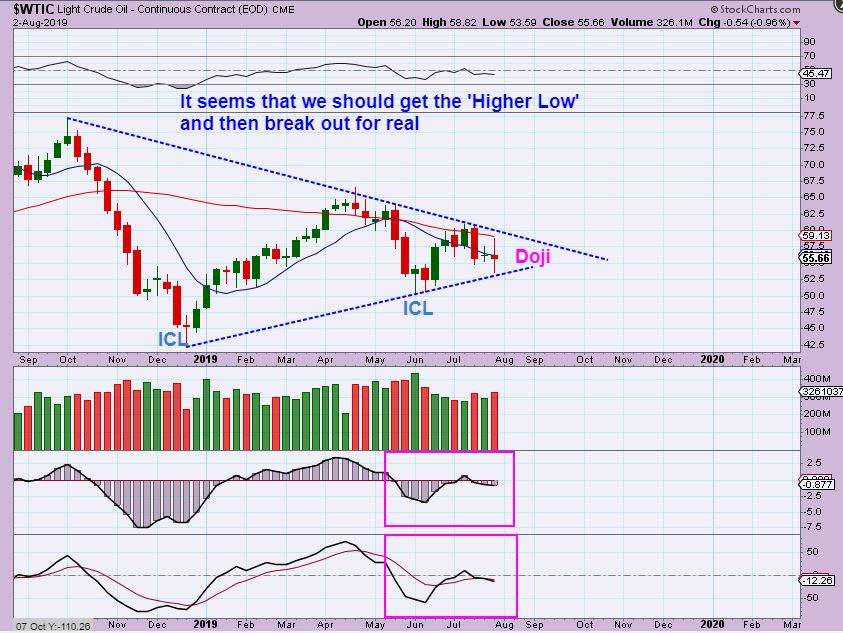
WTIC WEEKLY – Oil has been trapped inside of this triangle, we’ll see what Oil does next week.
XOP DAILY – I mentioned on Friday that the XOP actually looks like a form of capitulation into a bottom. I am seeing decent divergence at these new lows. I’m still not playing this area, but…
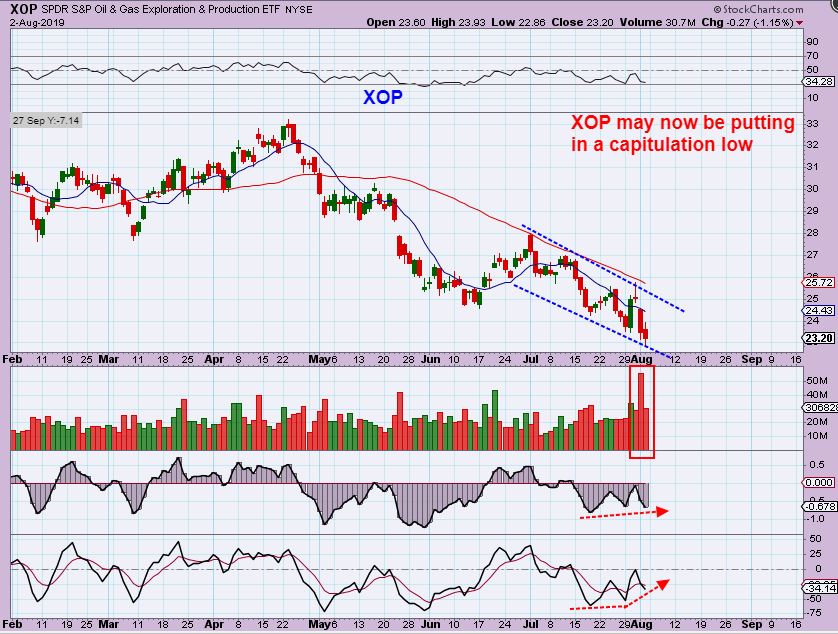
WTI – I did find a few stocks that didn’t make new lows with Oil, so I’ll keep my eyes on them. Some Oil stocks released earnings too, and while some did o.k., others gapped down, so that is a concern too.
.
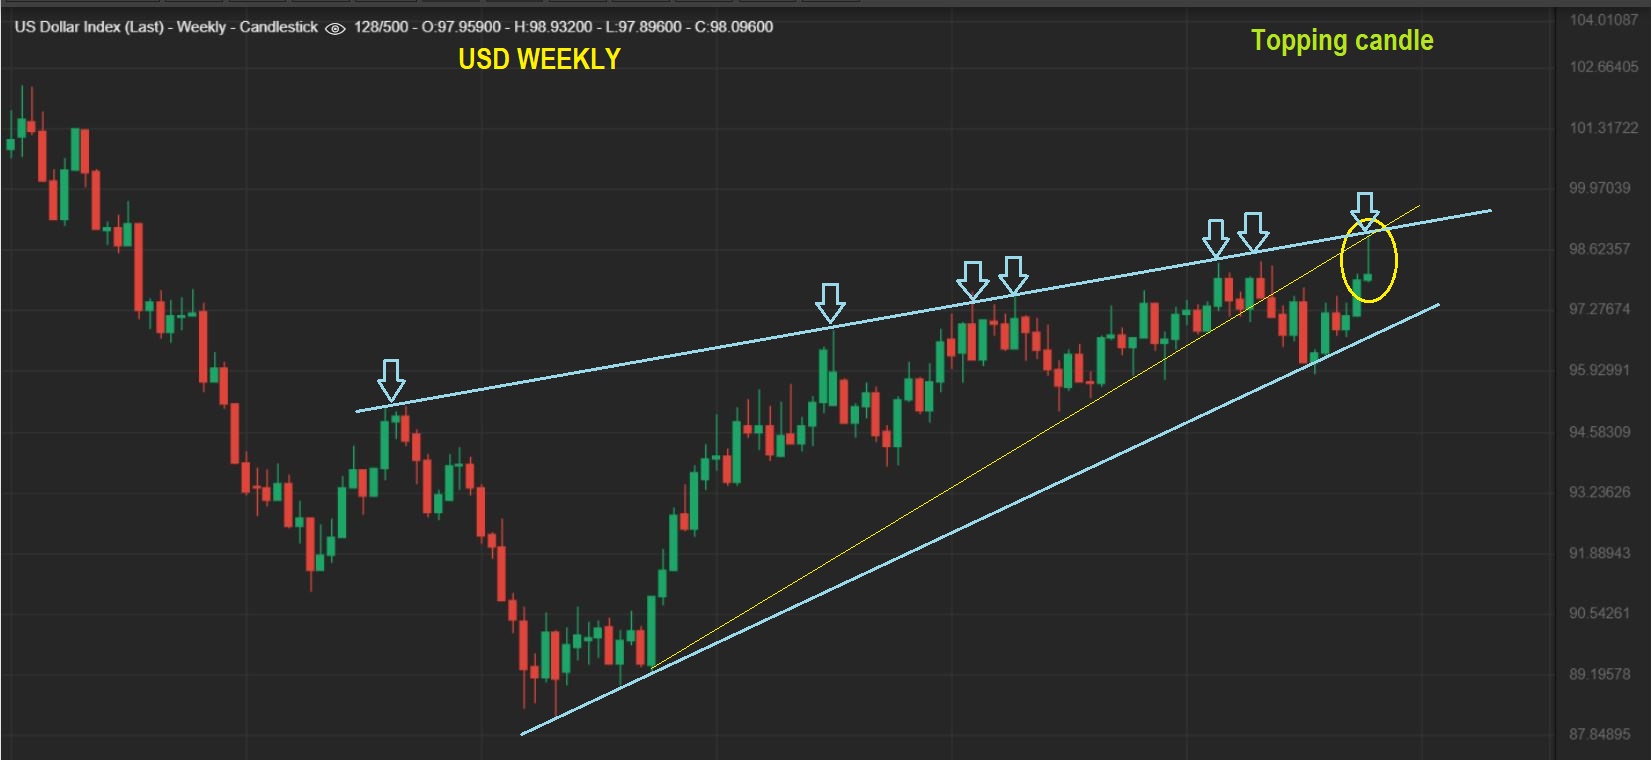
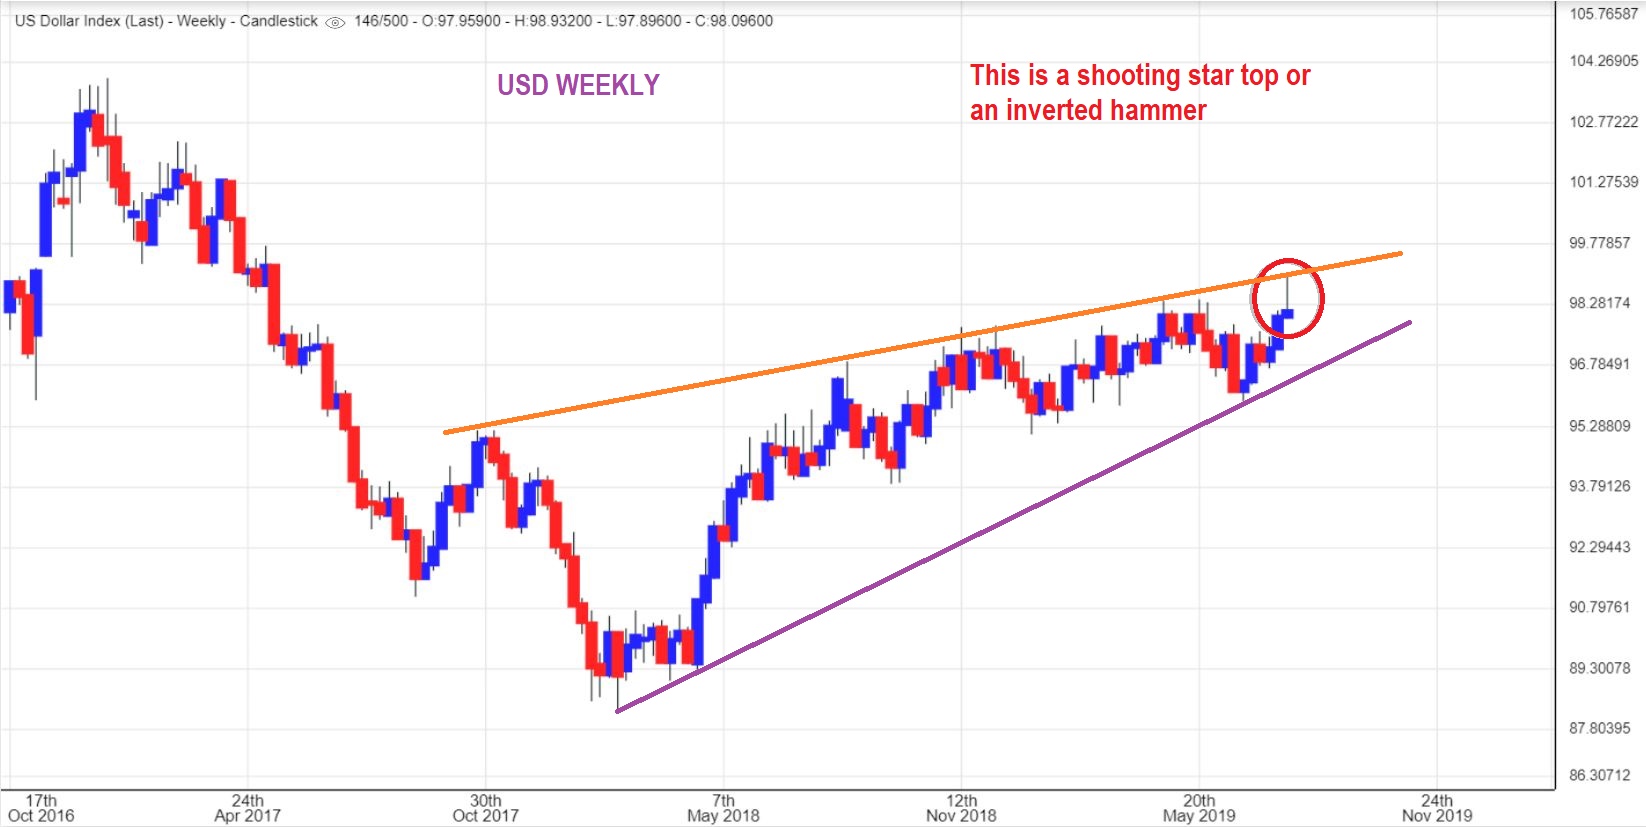
USD WEEKLY – Look where the USD went after the Fed Mtg. A perfect tag and drop. This is a weekly shooting star topping candle. I would expect that a drop from here should help Gold to continue higher.
.
USD WEEKLY – I decided to grab this one for easier viewing .
.
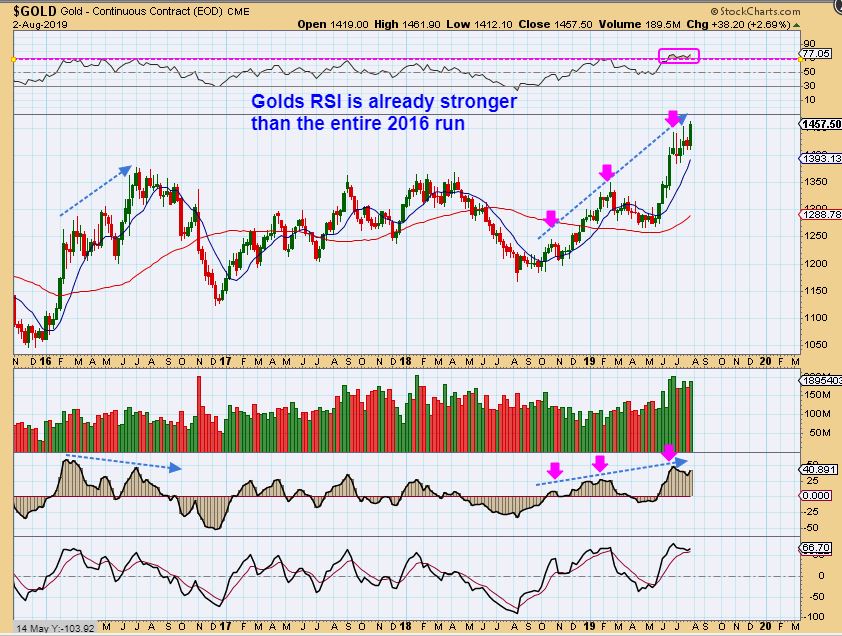
GOLD WEEKLY – This has been a strong run for Gold, even stronger than 2016 in several ways. That doesn’t mean that we won’t have pull backs, but the momentum & strength of the move so far has been increasingly Bullish. Notice the RSI vs 2016.
.
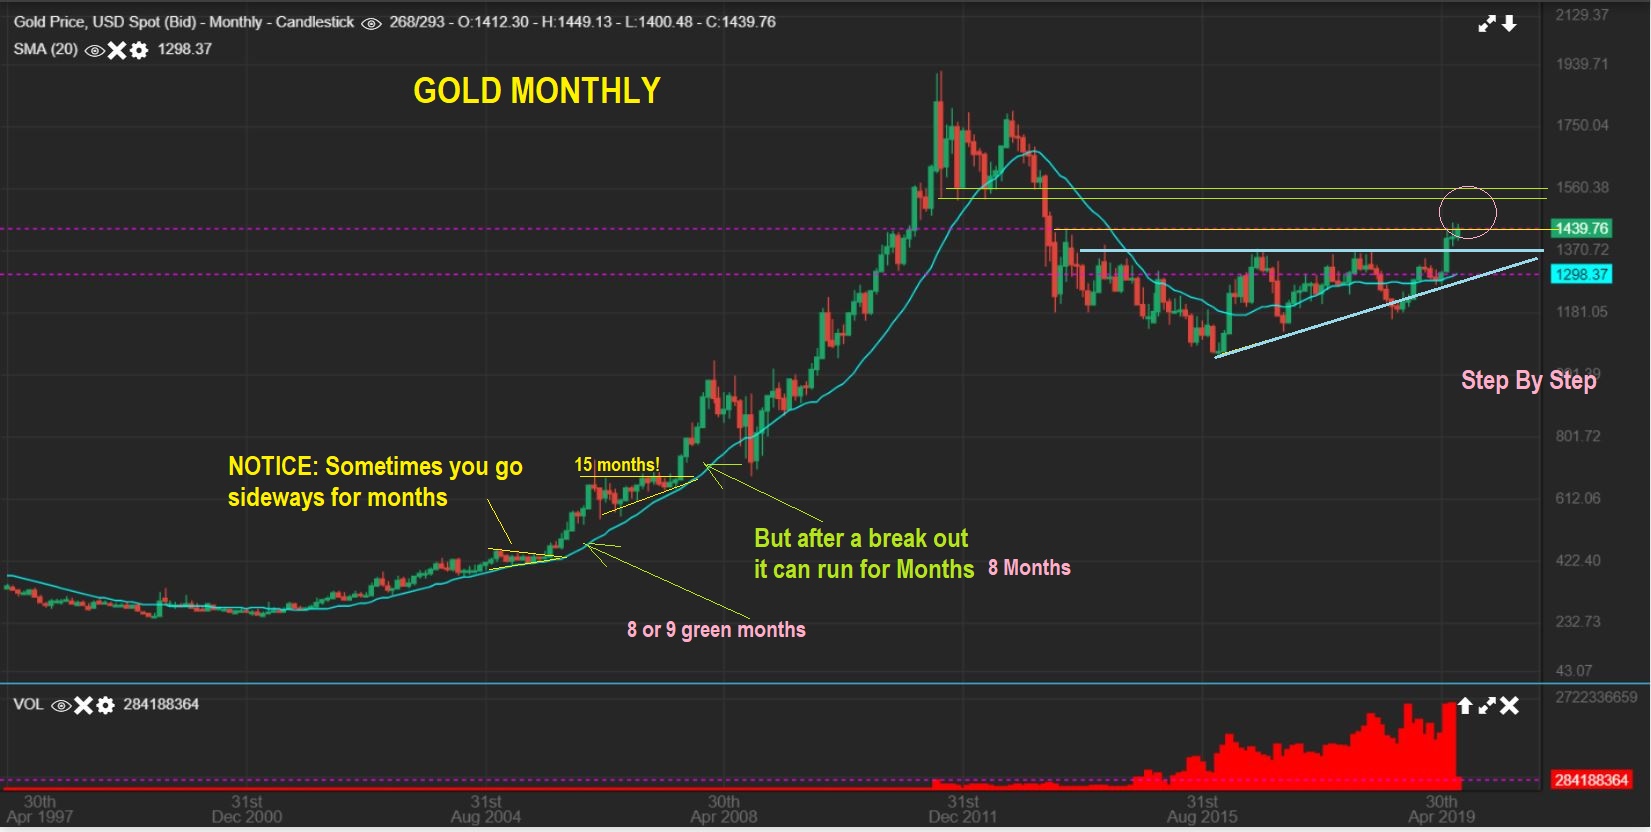
GOLD MONTHLY – The Month ended green again, and here I wanted to point out that in some of Golds prior Bull Runs, especially following a long sideways consolidation, we saw 8 or 9 month rallies with just 1 down month ( Sideways really). Read the chart left to right please.
.
If you think about it, we just had one of the longest sideways bases / consolidations in 20 years. The trend higher should last for quite a while, based on what we see here.
.
.
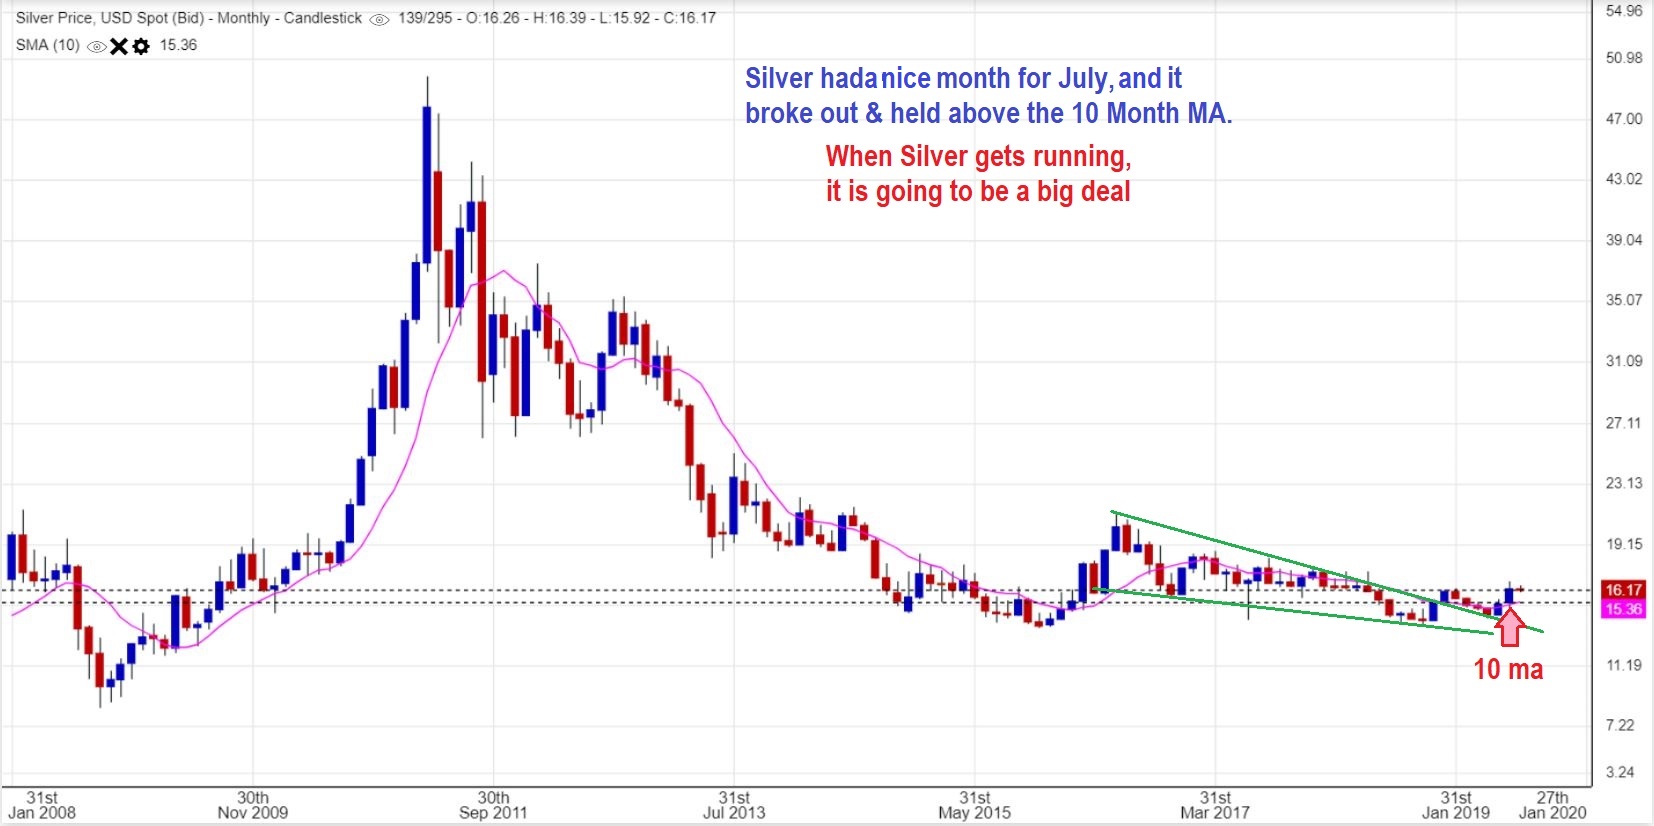
SILVER MONTHLY – And with Silver joining in, it should really start to attract Buyers. Our Patience will be strongly rewarded with our Silver stocks, and that has already started to pay off. Please read the chart.
.
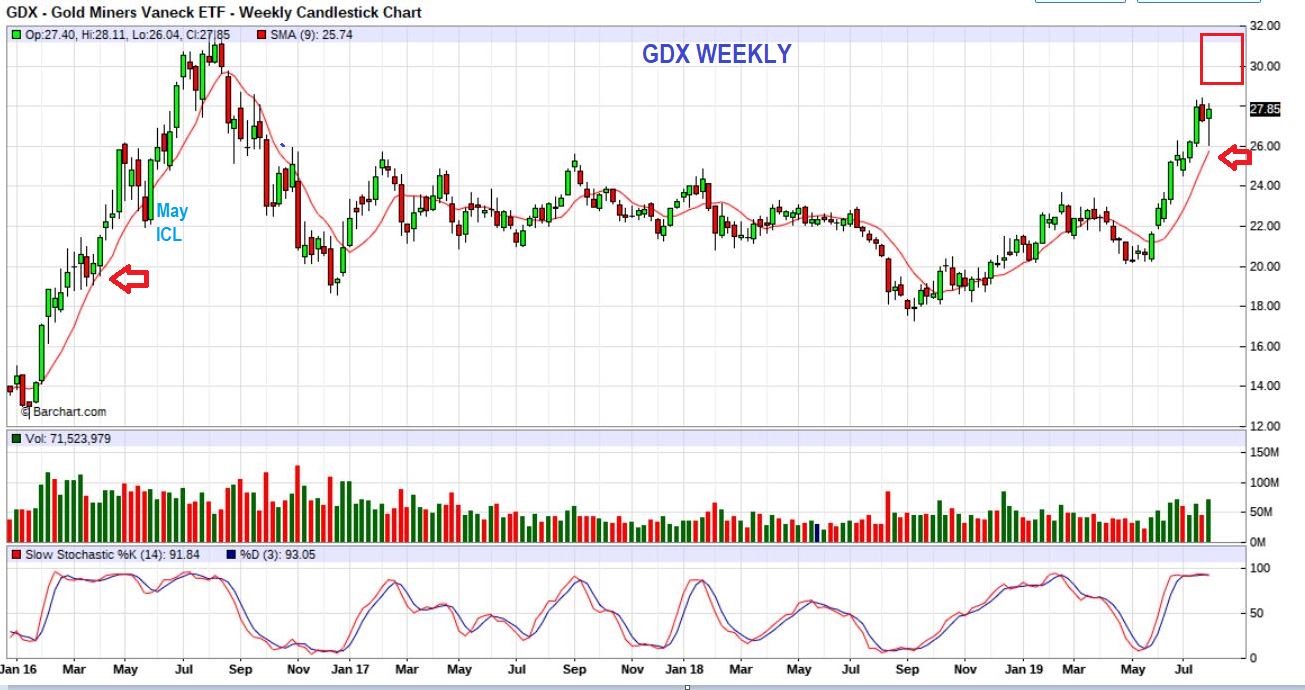
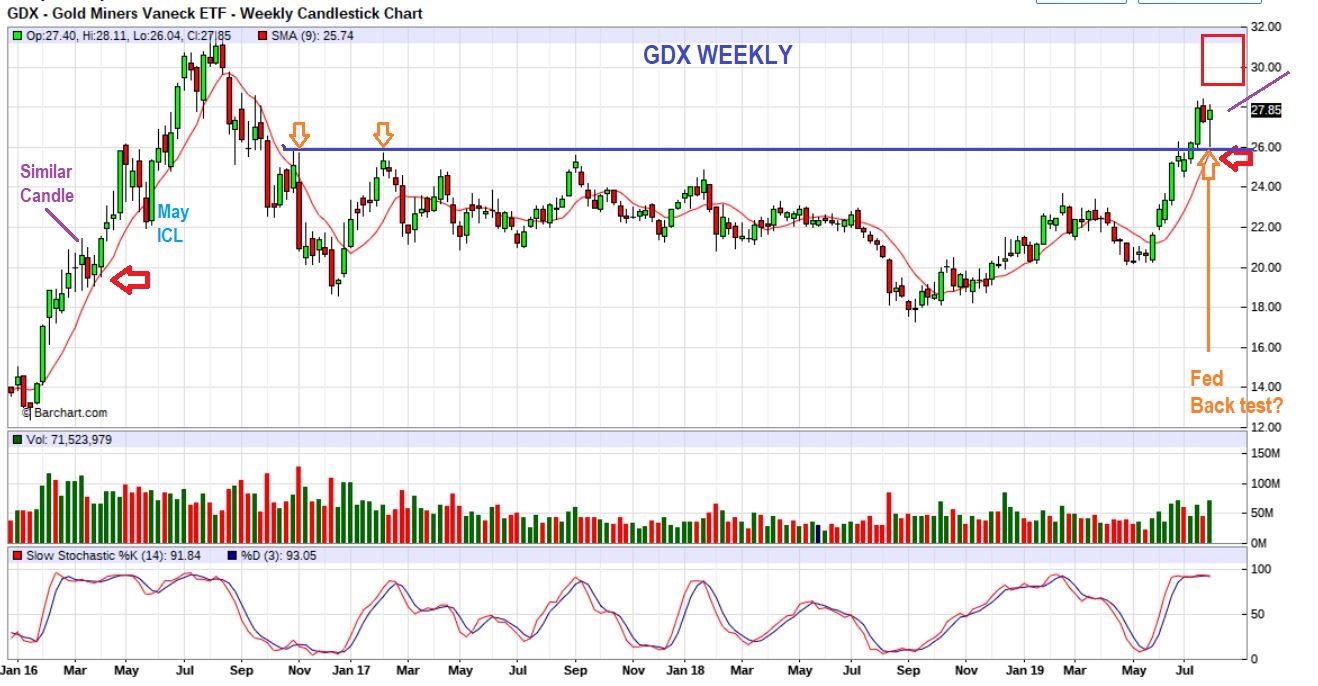
GDX WEEKLY – Look at the GDX WEEKLY CHART. That Fed drop & recovery actually looks to be a back test of 10 ma support (red arrow). We saw that in 2016 too, at dcls (red arrow). In 2016, it chopped sideways for 2 or 3 weeks though, so we’ll see if that happens here too, or do we go higher? In fact…
.
GDX WEEKLY – The candle last week is similar to one in 2016, and that is when it went sideways for 2 weeks before resuming the uptrend. THAT was probably choppy and as uncomfortable as last weeks chop with the Fed. Read the chart, we also back tested prior highs. Amazing chart stuff, I love this stuff!
.
GDX WEEKLY – Have you found it difficult to hold positions? Look at this chart of our current move and it doesn’t seem like it should be anything but fun 🙂 . This is as bullish as it gets, but still a bit choppy at times. For 1 thing, The ‘fear of giving back gains’ can kick people off of the Bull. Second: I lost 1/2 my leverage position on the fed drop with a stop at 13 sma. I re-bought the reversal candle as a trade & will allow it to play out, but THIS Is how even the best looking Bull Run can get tricky. This chart is simply exactly what we all hoped for in the Big Picture. This has been an awesome run so far. The next few years could become real money makers out of each ICL. 🙂
.
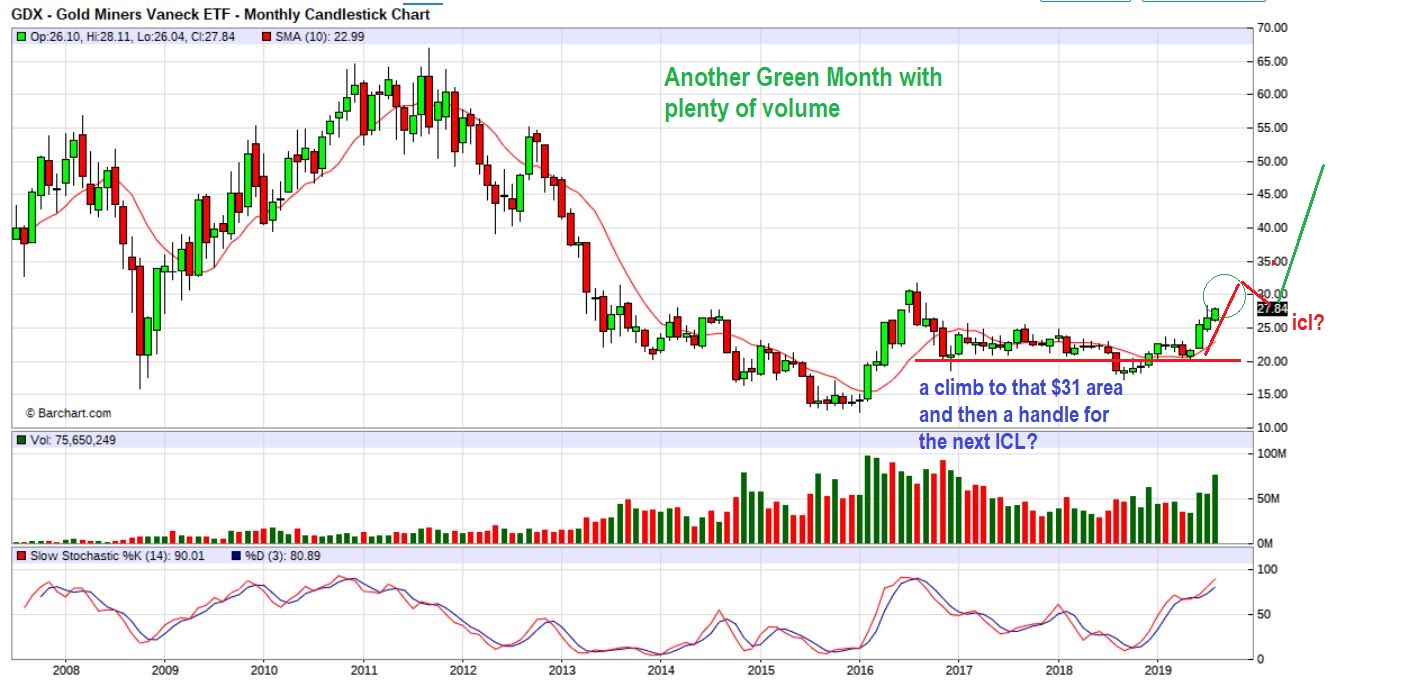
GDX MONTHLY – And the BIGGER PICTURE really helps you to see what I mean when I say that the next few years could be money makers. You can see that we are still at the lows of likely a giant cup beginning to form. GDX $20-$28 is great, but $20 to $68 ought to pay off nicely over the next few years. This is me leaping for joy 
.
.
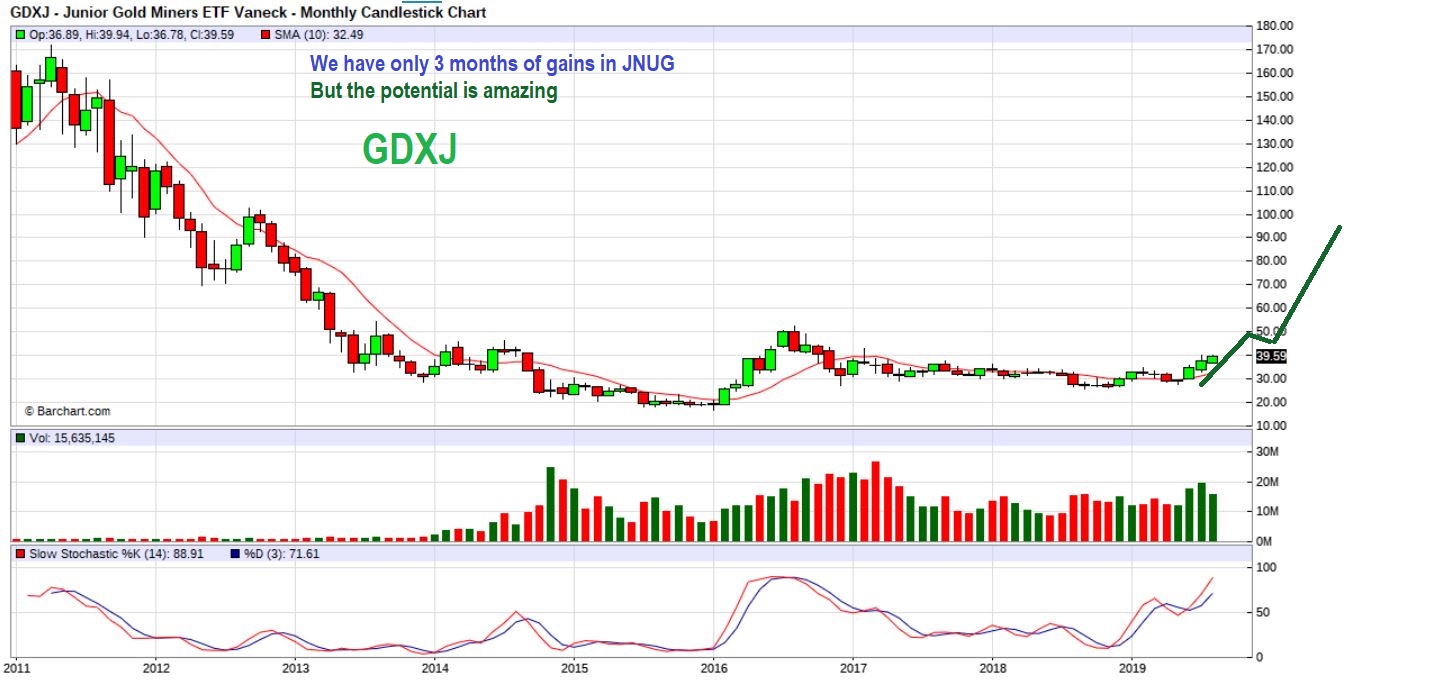
GDXJ MONTHLY – This is a Monthly Chart of GDXJ and the potential is amazing. On a day to day basis, it will not be easy, but the Bigger Picture is Bullish. Day to day you’ll deal with public offerings, maybe a drop on earnings. Your Miner might buy another Miner & price drops for a week or so, etc. There will be DCL dips, and even ICL drops, but if you can overcome the minor set backs and stay on track, this should be extremely rewarding.
.
This Big Picture Report is still filled with excellent bullish charts in the Precious Metals Sector. This week did wake a lot of us up though, because we got a dose of sharp Fed volatility that has been missing from our recent run. Yes, We KNEW that anything can happen around Fed Day, but it did seem that a Fed Cut would likely send Miners higher to the $31 area, and Gold to the $1550 area. This still may play out that way, but that sudden sharp flash drop had our minds scrambling as to whether or not this was now going to drop into a deeper dcl for several days? I simply recommended a Stop for Leveraged positions ( Mine was at the 13 sma for GDX or GDXJ) and my basket of Miners I would hold. It is also fine to sell 1 stock & trade it for another if you want to do that.
.
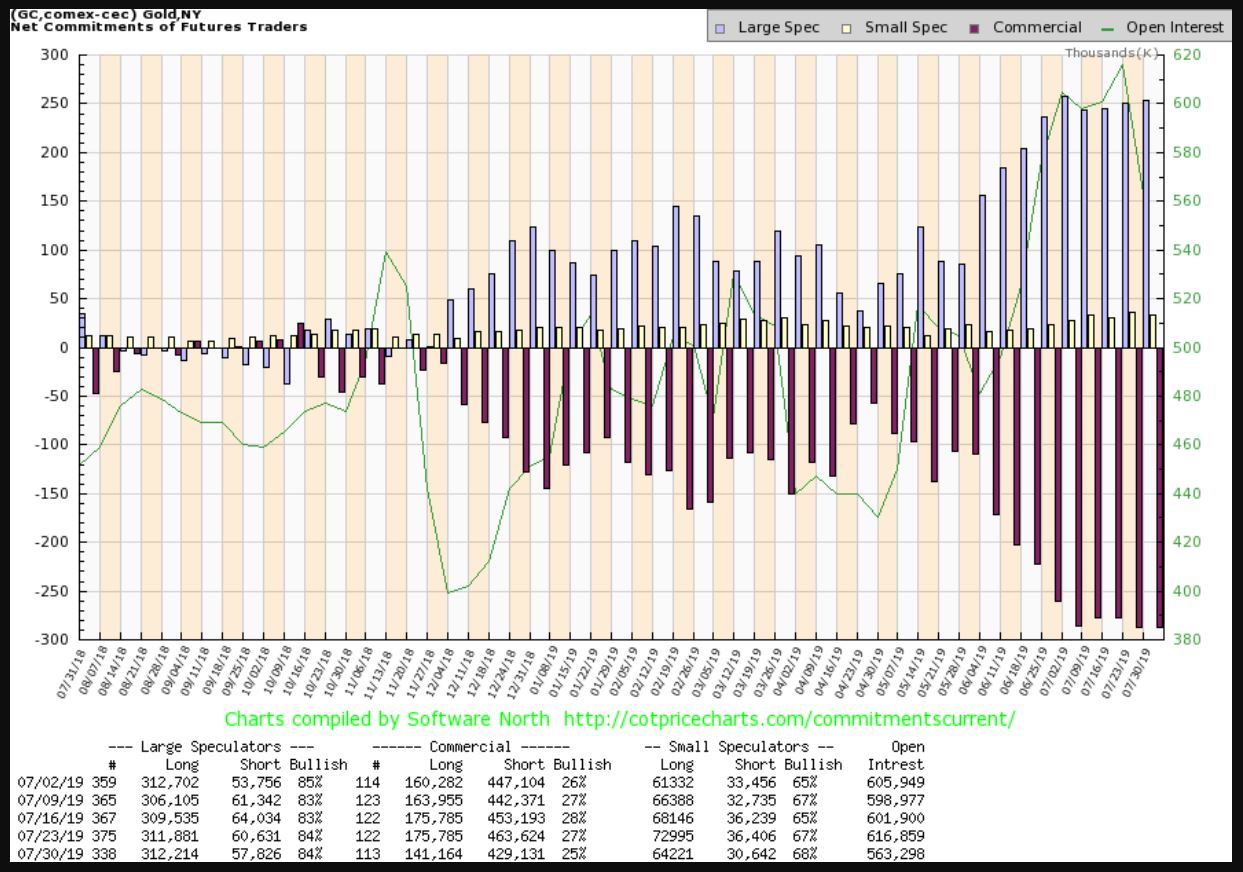
Below I am also going to briefly discuss the COT report by request. The Smart Money has been heavily short and will likely remain that way, only lightening up slightly at dcls and maybe a bit more on a drop into an ICL. You will see the COT Chart and notice that it has been the same for 5 weeks.
.
Enjoy your weekend and Rest Up, next week could be very interesting in the Markets!
.
~ALEX
.
The GOLD COT – I see no real net change, and this has been expected by me. I wrote a report about The COT under a bull run and showed how in a strong Bull run, commercials hedge and even increase shorts all the way higher. They did sell some shorts and add some shorts last week though, so why are they still so heavily short?…
.
GOLD DAILY and the COT – They may be re-positioning with the choppiness. That COT report covers the days inside of the BOX ( it is released with data up to Tuesday). It was a time of Buying & Selling, so maybe they closed shorts on a drop, and added again on a pop. Basically though, they were just as short as prior weeks by Tuesday, and on Wed Gold dropped for them.
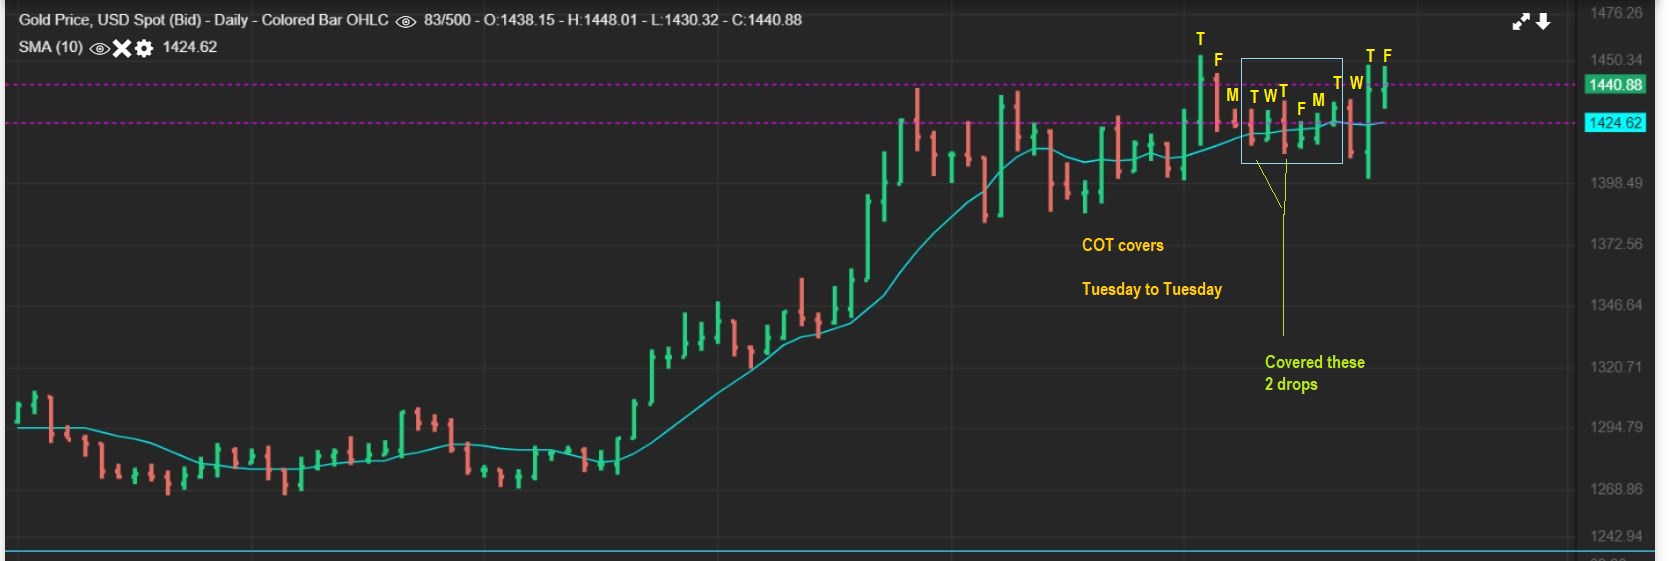
People are saying, ” NEXT WEEKS COT WILL LIKELY SHOW A BIG CHANGE AFTER THE FED DROP!” Maybe, maybe not. I don’t know if I would expect them to close a lot more shorts after the FED Wed drop. MINERS dropped hard post Fed, but look again at this chart after the Box. Was last weeks Fed drop for Gold a Bigger drop than other weeks? Or was last week a bigger gain? We’ll see how they played it, but Gold is really at the highs as of Friday and this is just more sideways chop for the COT if you ask me.
.

