
August 24th Weekend Report
After a very choppy sideways start to the week, the FOMC Minutes release on Wednesday was a non-event, but when we reached Friday and the Jackson Hole speech was delivered, it looks as though we finally have our ‘directional’ trades revealing themselves. The China trade wars and the Jackson Hole speech did seem to shake things up a bit. I usually mainly discuss the Big Picture in the weekend report, but this report will contain some short term possibilities with daily charts & The Bigger Picture.
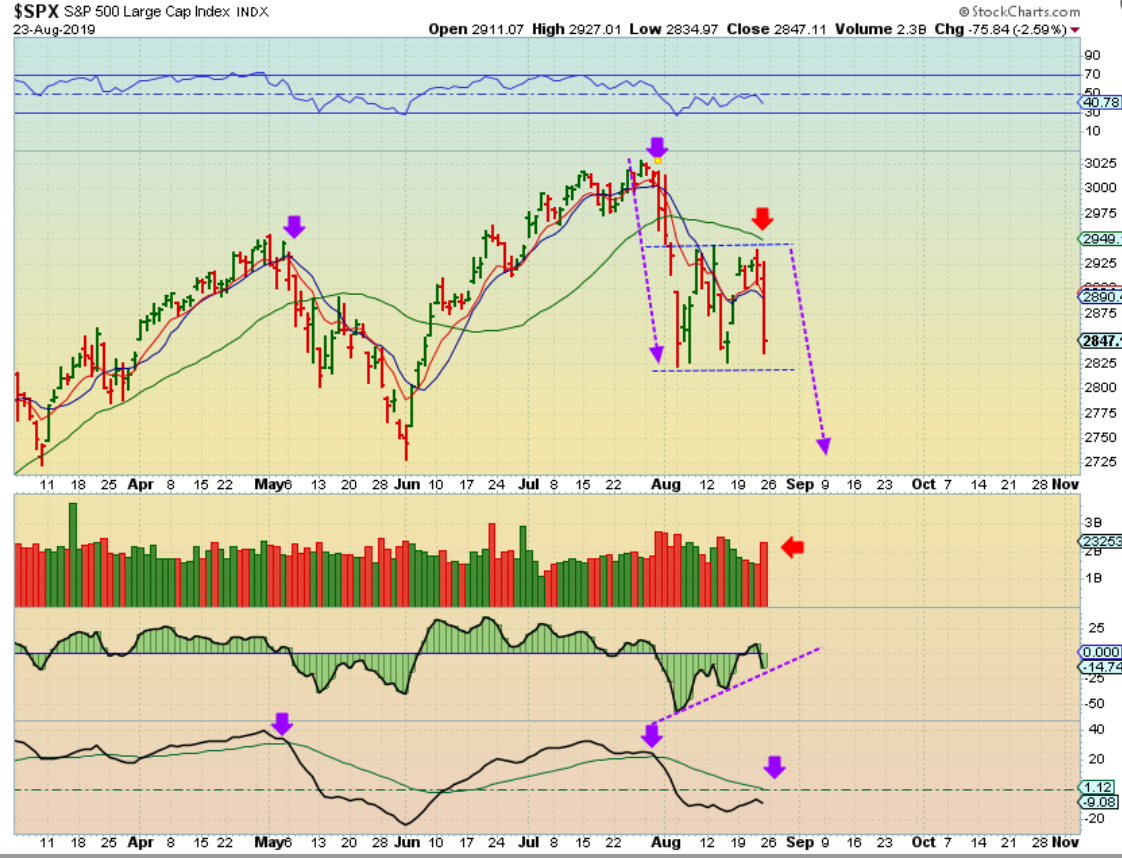
SPX DAILY – That was a big drop with heavy volume Friday and this is only day 14! We have plenty of time for this to really sell off. The General Markets closed below the 10 sma, and this definitely looks like we will revisit the June lows short term, and possibly experience an even deeper drop & break down. The Big Picture shows a possible large drop too…
.
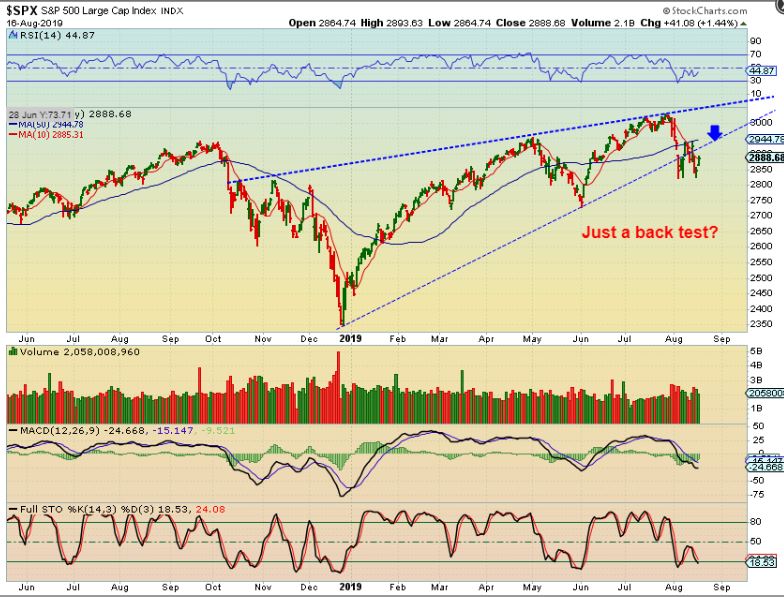
SPX WEEKLY – LAST WEEK I showed you tthis break down and possibly ‘just a back test’ during this chop, and now it looks to be breaking down further…
.
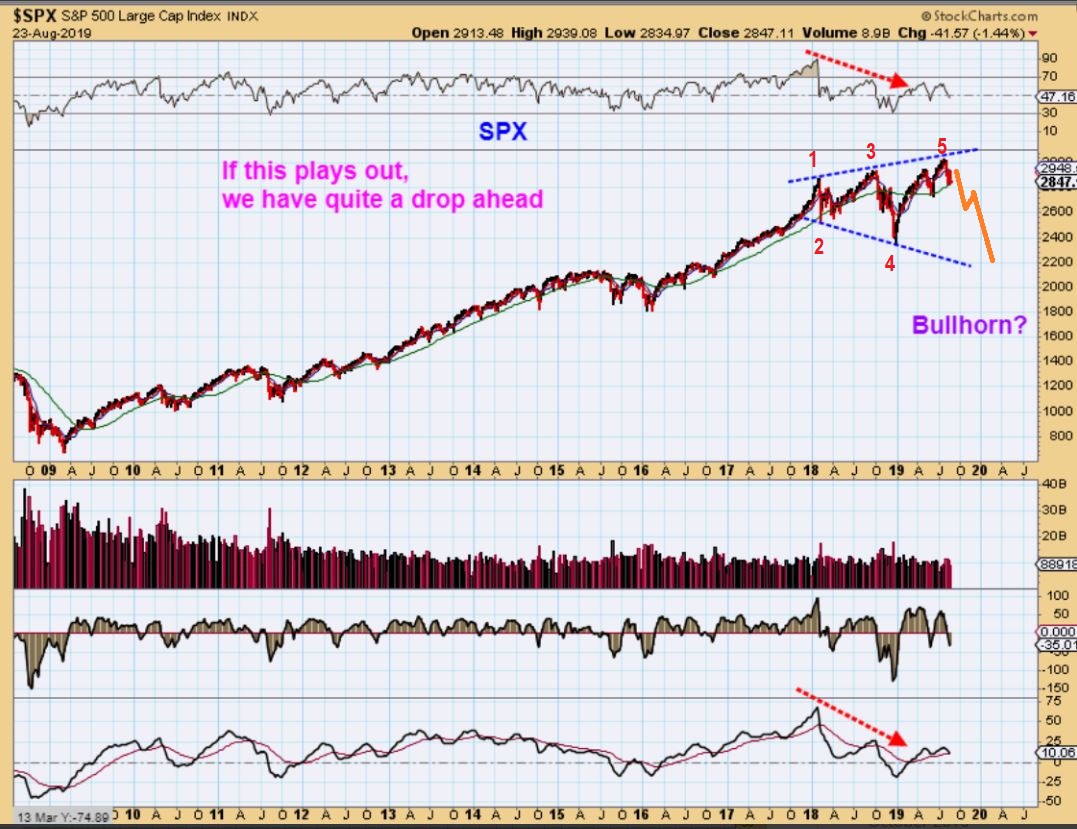
SPX WEEKLY – In the past, I have also pointed out this possible Bullhorn or magaphone in the Bigger Picture, and the idea is still valid. This has been warning that we could have a deeper sell off at anytime, rather than ‘New highs & Blue skies’ at the ‘5’ area, as many used to think.
.
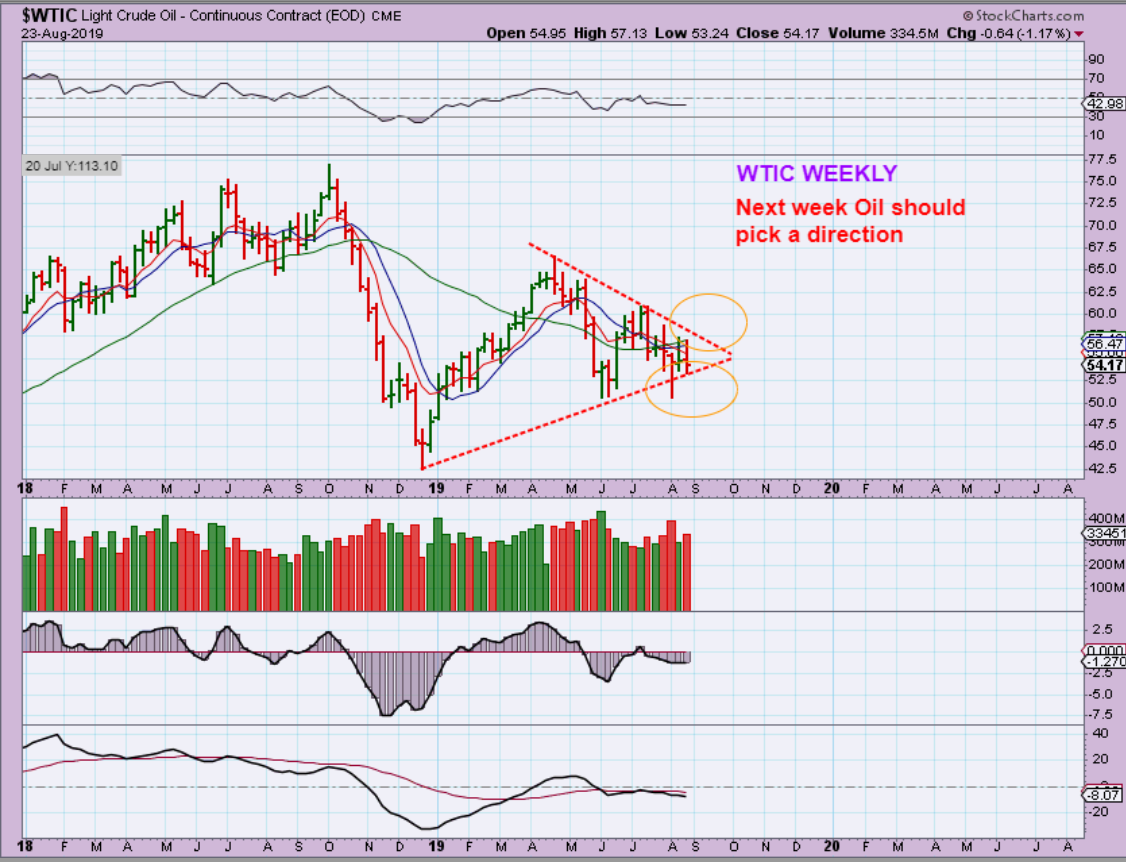
OIL WEEKLY – Oil looked good early in the week, but it broke down by the end of this week too. I took a small trade in Gush with a tighter stop for the 2nd time awaiting a possible break out higher, and got stopped out again. That money quickly went into DRD & that paid of nicely so far. You have to be quick in choppy markets. This chart is neutral , but it could break down.
.
JACKSON HOLE – We’ve been waiting for the results of their discussion on economic policy
.
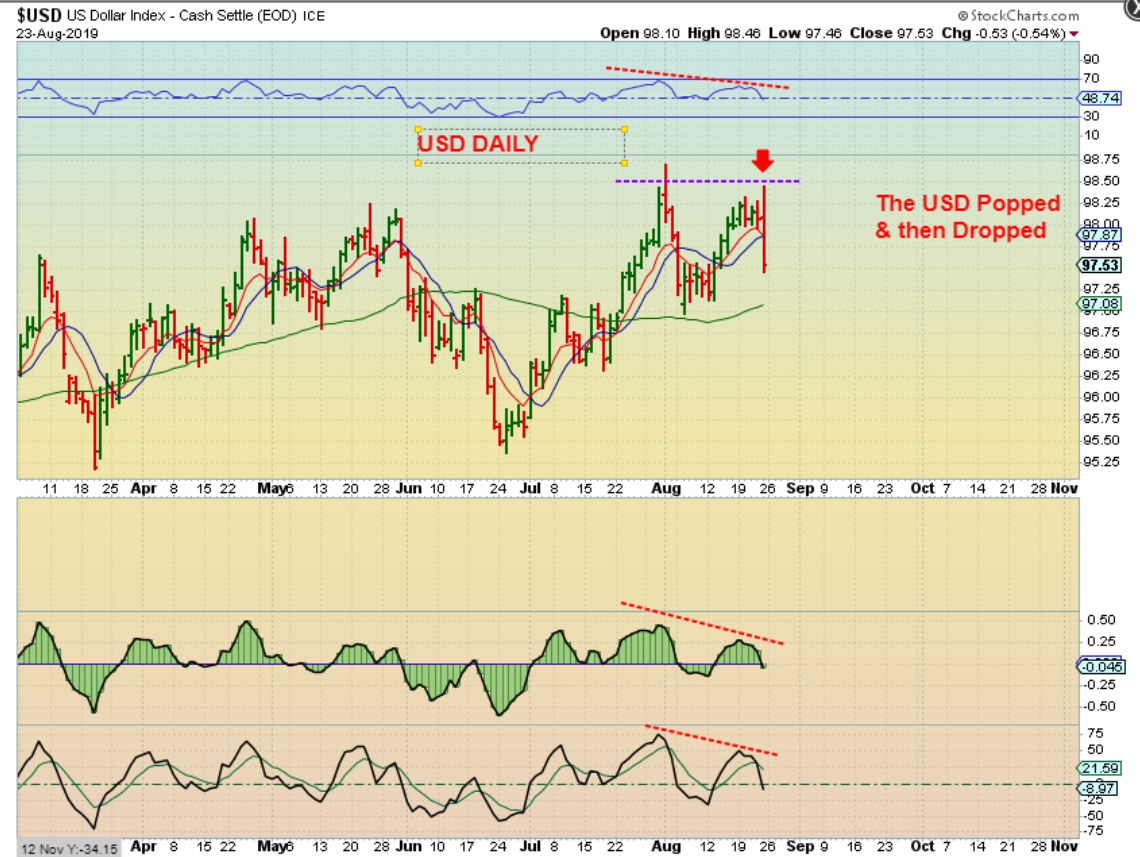
USD DAILY – Friday the USD Popped higher at first, and then sold off after the Jackson Hole speech. USD Down, GOLD up…
.
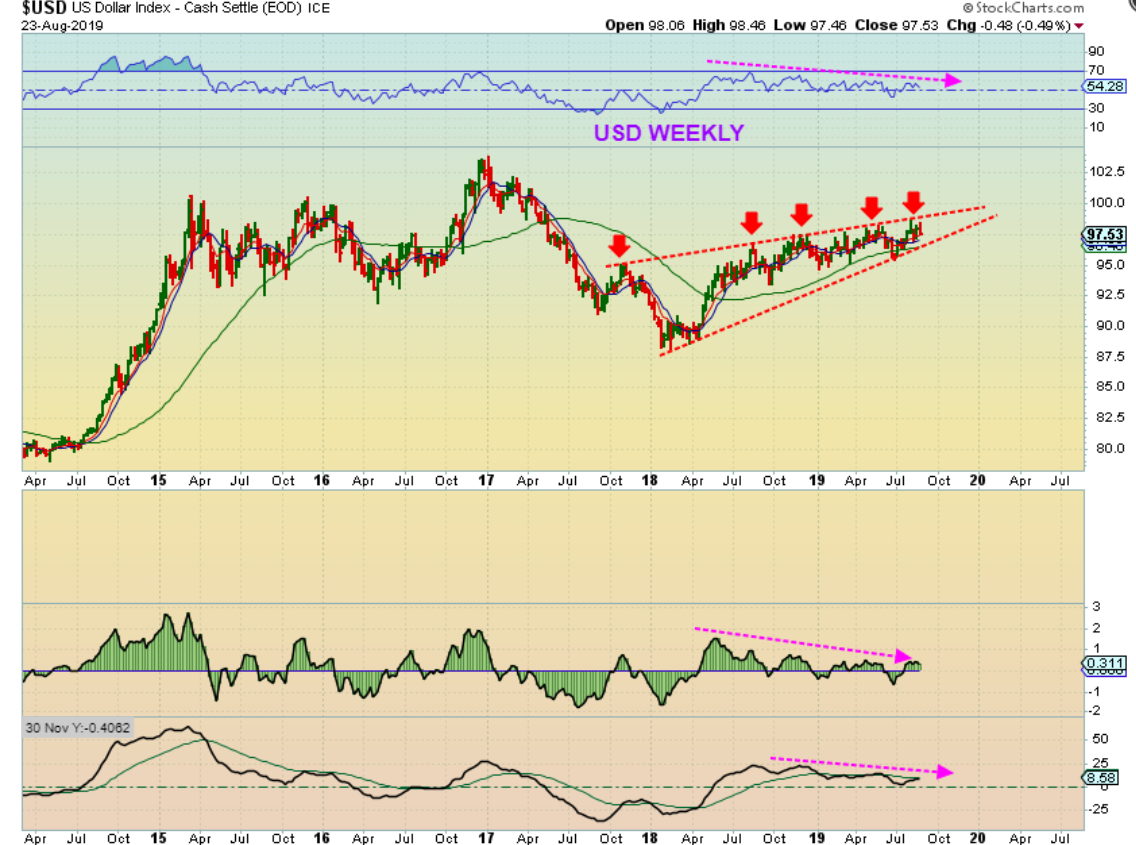
USD WEEKLY – I’ve been drawing this forever, and it should break down according to those longer term indicators, but so far it just travels deeper into the apex. The good news? The USD has been slowly rising, and the Precious Metals have been in a Bull Run the whole time.
I WANT TO WALK YOU THROUGH FRIDAY AS WELL AS SHOW THE BIG PICTURE HERE. THIS WAY WE CAN SEE HOW THINGS WERE DEVELOPING.
.
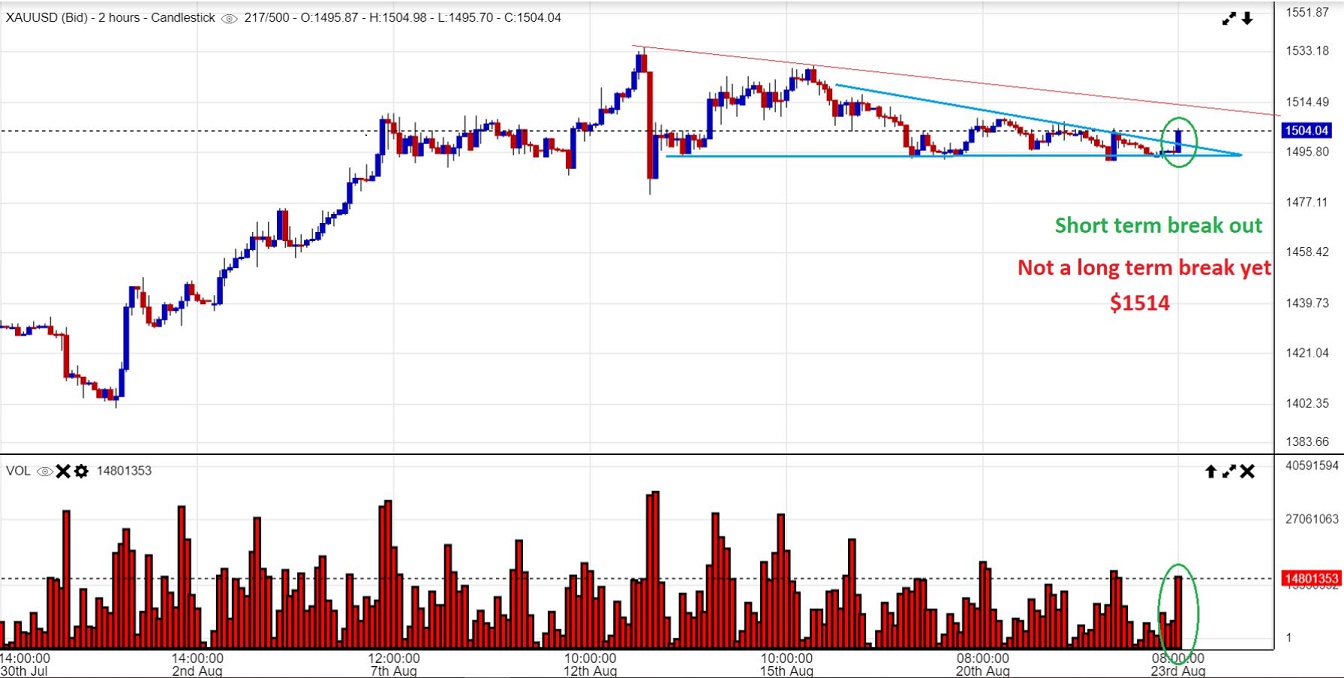
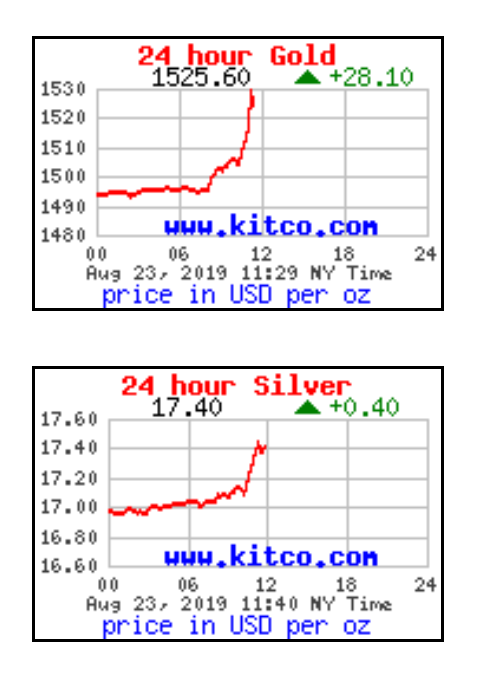
GOLD & SILVER POP – Gold & Silver moved a bit higher at 8:30 am, so I started discussing it in the live chat area, posting this bullish short term break before the open. This was Bullish, but a move over $1514 would become a longer term break out & even more bullish. ( Click to enlarge charts)…
.
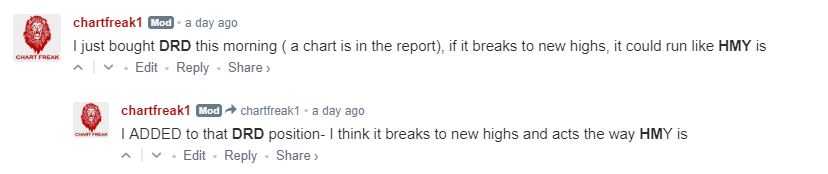
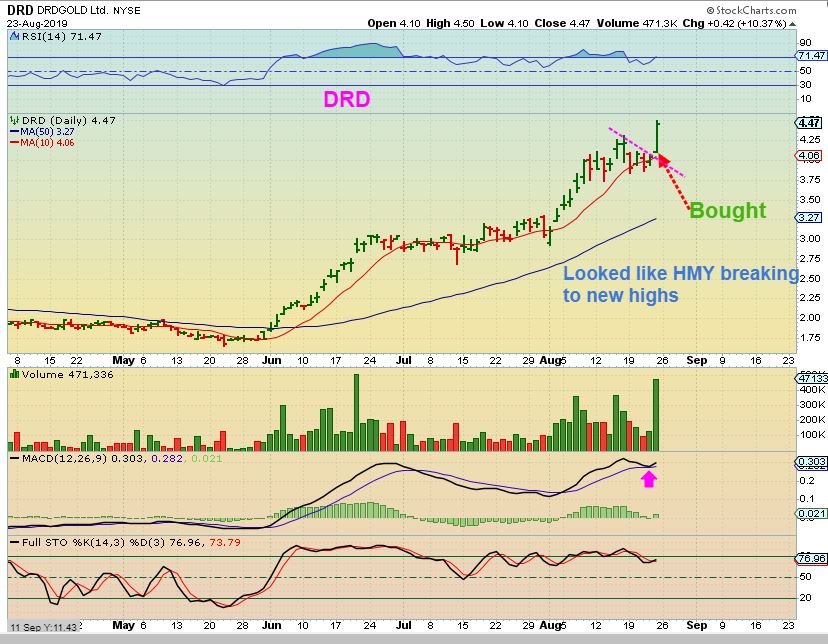
After that Jackson Hole speech, Miners began SLOWLY Climbing higher & it looked like a bullish stealth move. I mentioned that idea in the comments, and posted that I bought DRD near the open and discussed other Bullish miners too. It looked like we were on our way higher after the Jackson Hole Speech. Click to enlarge if necessary…
.
DRD was in my report with this chart , and was above the 10sma & I mentioned how well it held up as GDX sold off for 8 days.
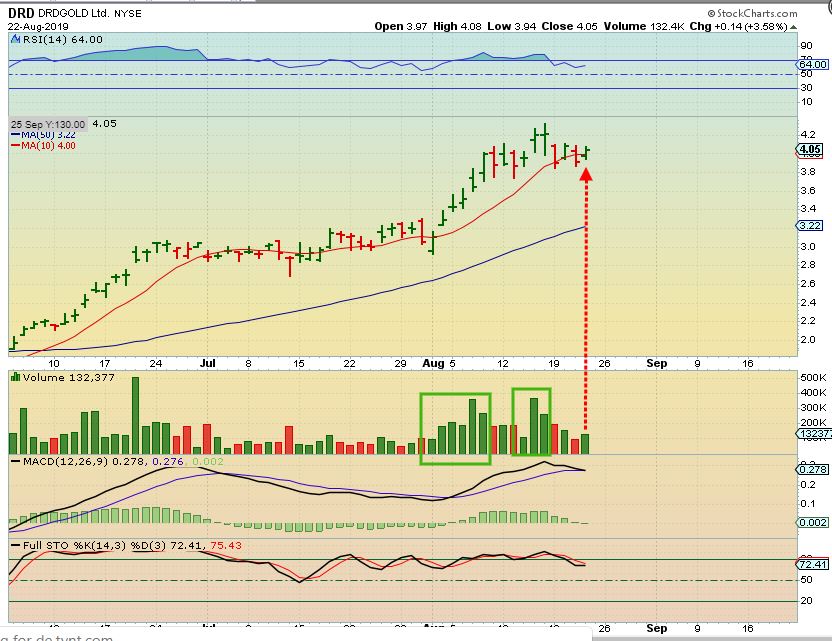
Now DRD was breaking above that small down trend line and Gold was moving higher, I thought that DRD could do what HMY was doing after breaking to new highs…
And this was HMY after breaking to new highs. I also mentioned … 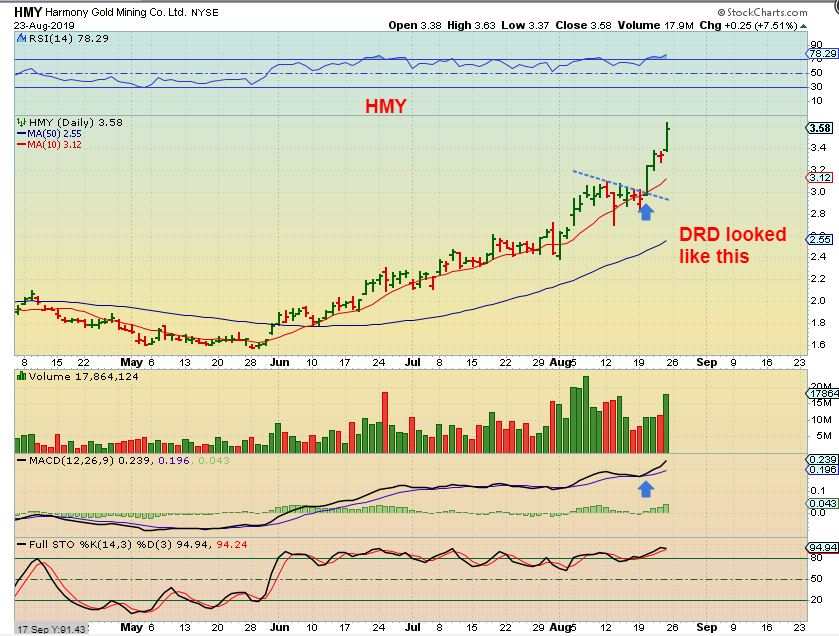
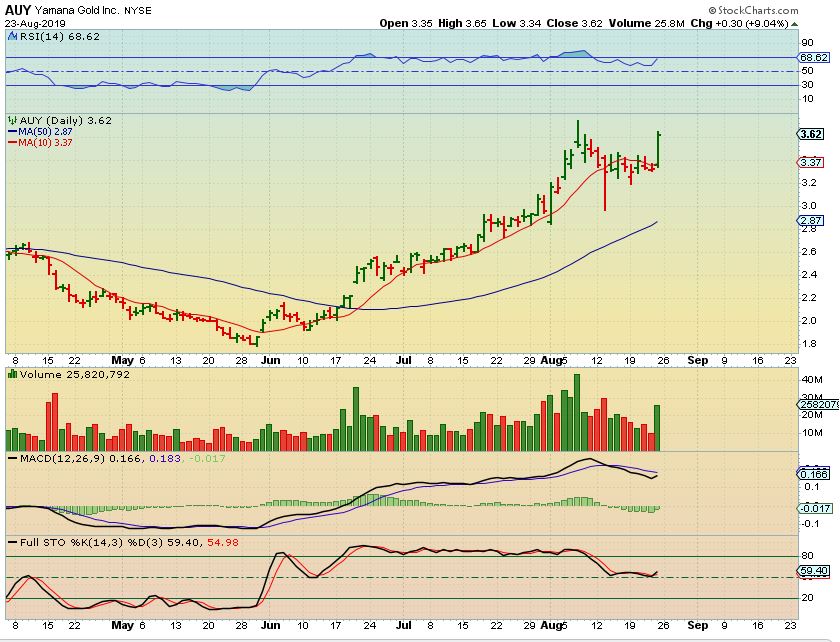
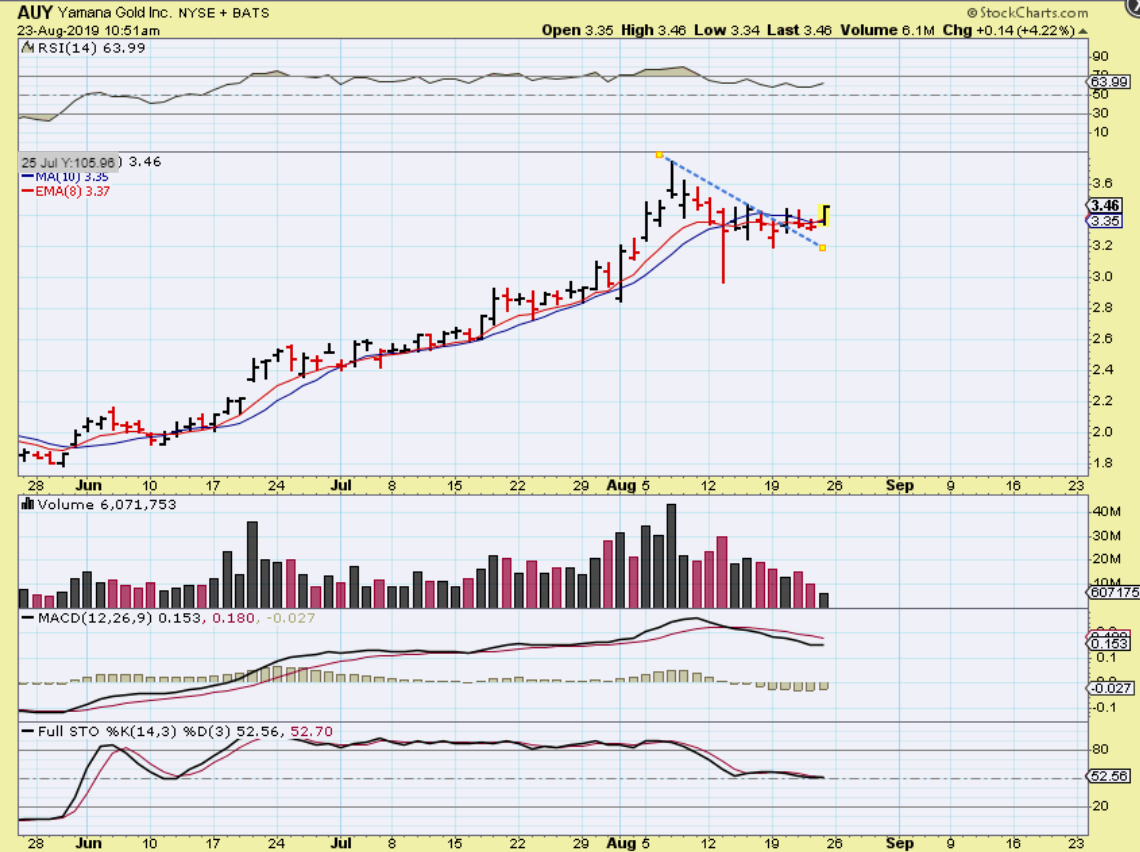
AUY was a good looking set up for similar reasons, I posted this as a buy after the open…
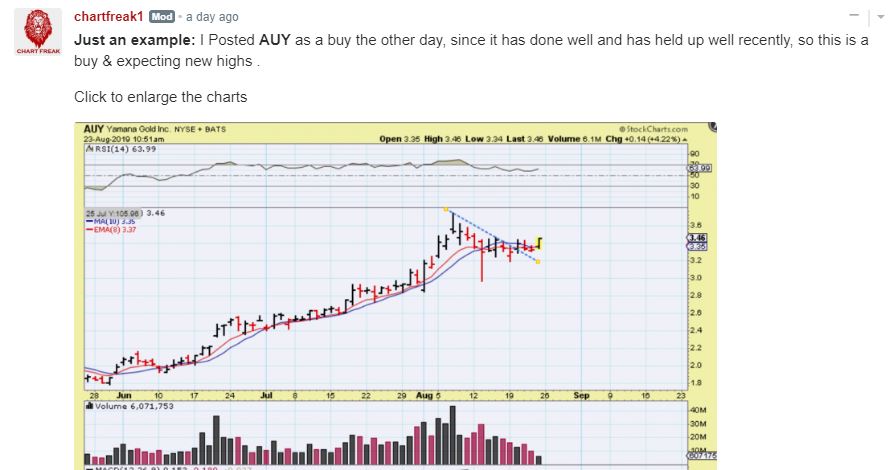
AUY closed nicely higher, heading for new highs too.
.
THE ABOVE BULLISH EVENTS OF FRIDAY ARE JUST A FEW OF THE REASONS WHY WE HAD TO ‘STAY FROSTY’ OR ‘ALERT’ DURING PIVOTAL TIMES. OPPORTUNITIES ( or even a sell off) CAN PRESENT THEMSELVES AT ANY TIME. THIS WAS SURPRISES TO THE UPSIDE, THOUGH WE DID EXPECT THAT ANOTHER POP & RUN COULD BE SETTING UP WITH A 1/2 CYCLE LOW.
And then Precious Metals REALLY took off. This was how it looked heading into Midday and it held the highs all day. That was just a little bit of Fridays action, step by step, now on to the bigger picture…
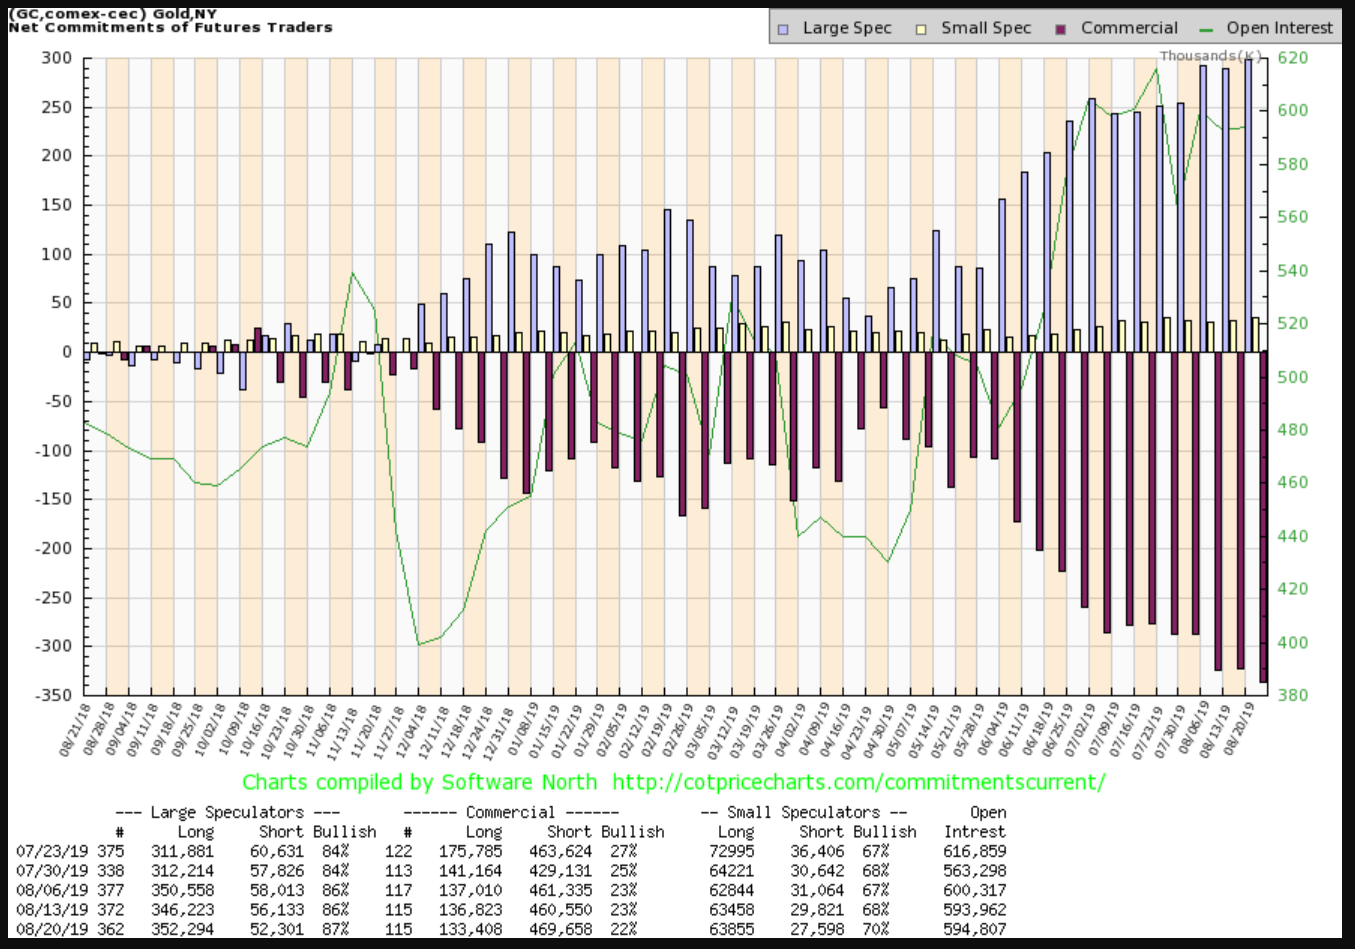
GOLD COT – THE COT has been seeing Smart Money Shorts continually rise. I wrote a report explaining this, it did NOT concern me, I said that I would not sell due to the COT under those circumstances in June or July. Now is the time to mention that WE DO STILL GET AN ICL in Bull Markets in the future, and the COT will reflect that. Lets take a look at the COT for GOLD 2016. ..
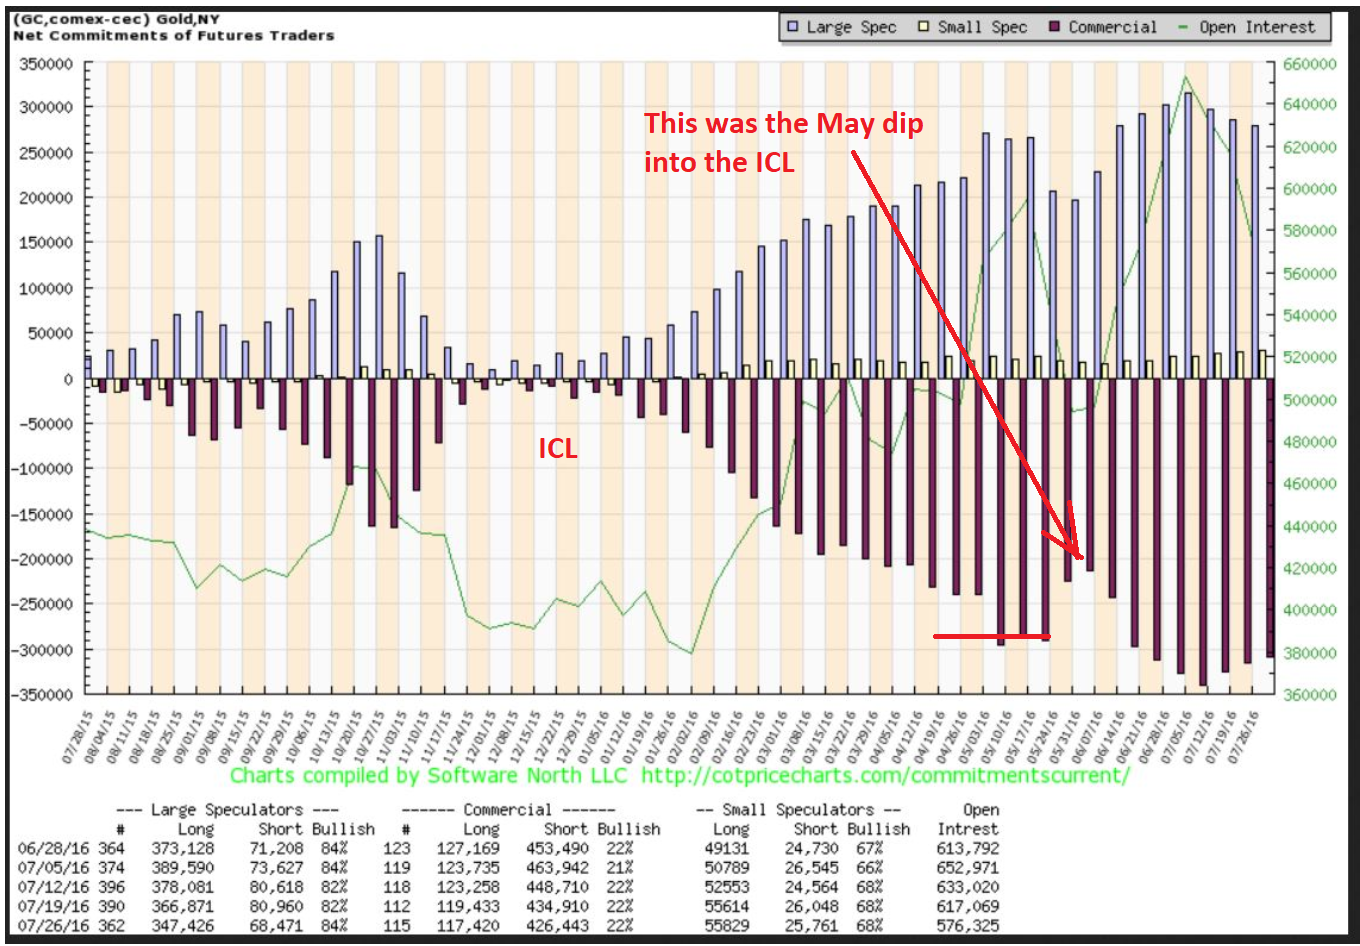
GOLD COT 2016 – In 2016 Gold bottomed in Dec 2015 & ran higher until an eventual dip into an ICL in May 2016. That dip caused the COT to lighten up for 4 weeks ( The month of may). After the ICL, the shorts can climb even higher. My point? Our COT grew and did NOT even lighten up on the recent chop & drop in Miners, so the ICL lies ahead. We are 3.5 months off of the May 3 low in Gold.
.
GOLD DAILY – So GOLD is back at the recent highs and may be heading for that target area of $1550-$1600. Let’s take a look at an even Bigger Picture…
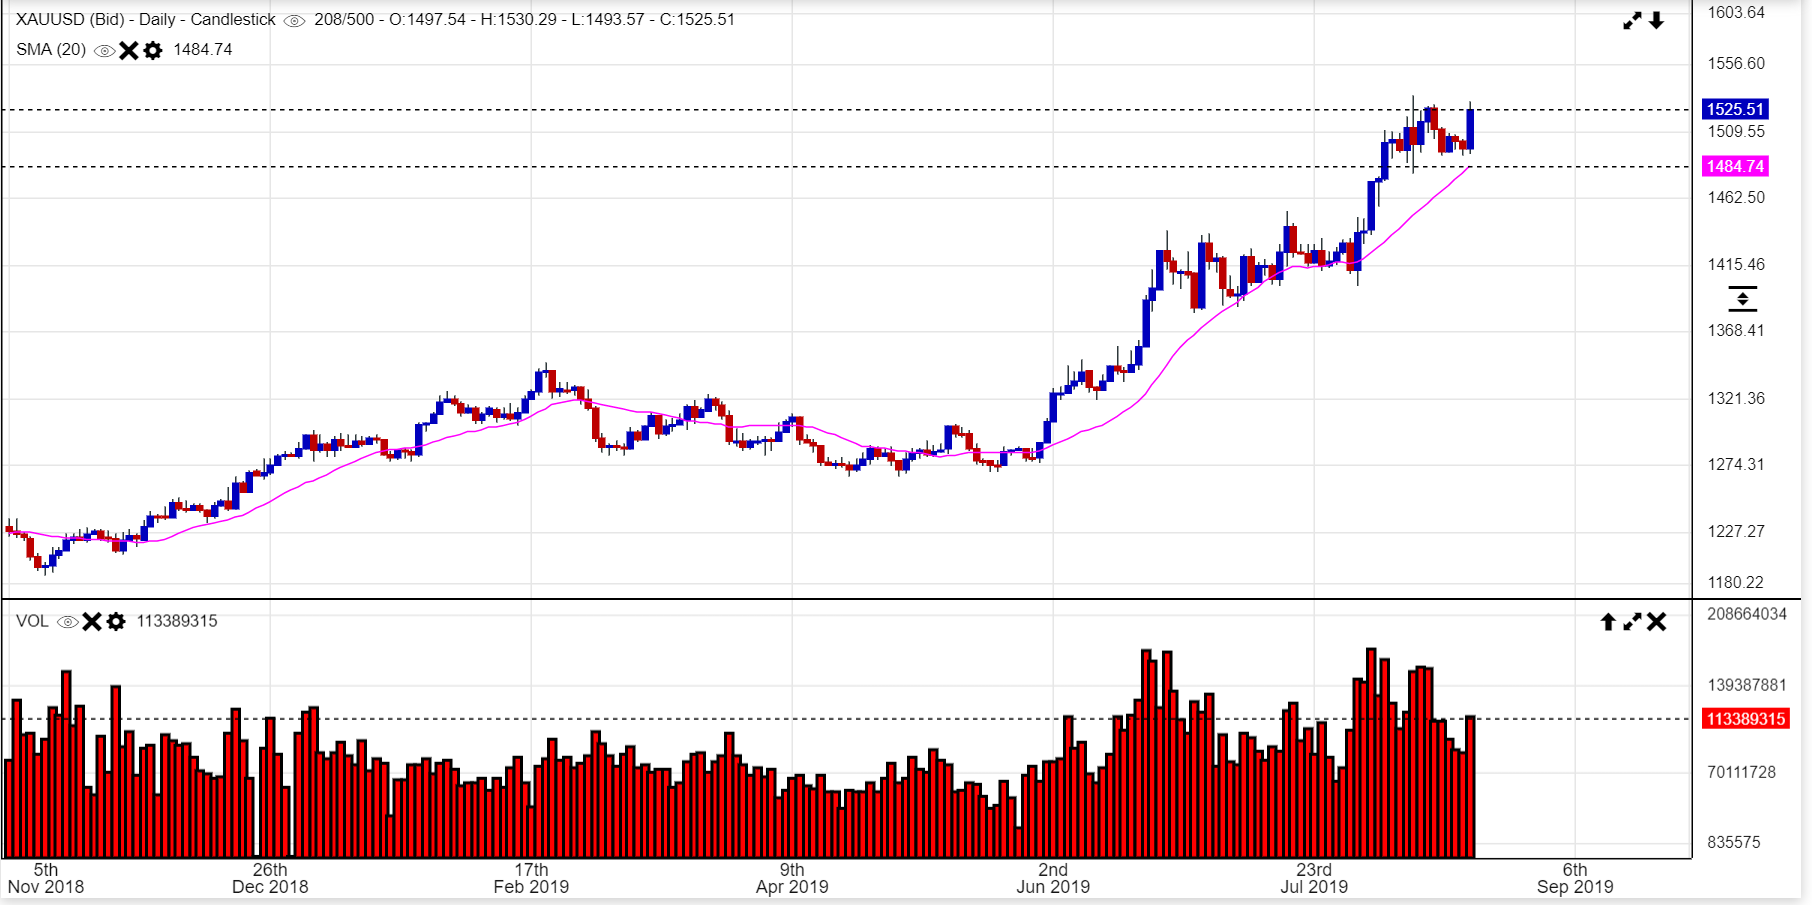
GOLD WEEKLY BIG PIC – We’ve reached the expected resistance zone. We have paused and gone sideways to build up energy to try to push higher. I would love to see Gold just chug along & push through this resistance, and I think eventually it will , but I have to be honest here- I think we will see a dip into an ICL before that happens. Let me explain…
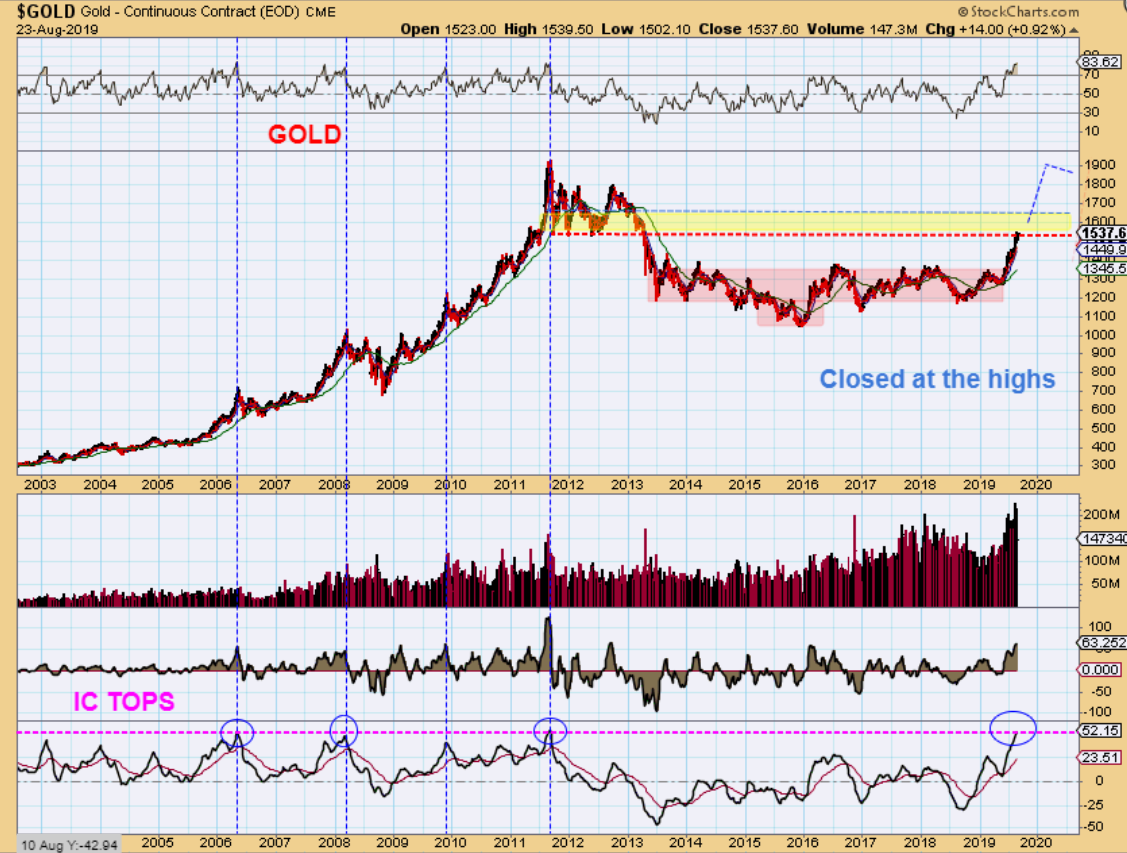
.
Look at my lower indicator. I have marked Major tops ( Intermediate Cycle Tops) DURING A MAJOR BULL RUN, and we are there now. Can we still get another week higher out of this? Yes, it’s a weekly chart, next week could rally. What about 2 weeks? Maybe, but I just have to use the tools that I have developed, and I need to view them ‘unemotionally’. My hopes , dreams, and desires are for Gold to rally to $1900 right now, but my charts are warning me that in prior Bull Market Rallies, it was time to begin a drop into an ICL soon. The best results may come from Using & raising stops as we run from here.
.
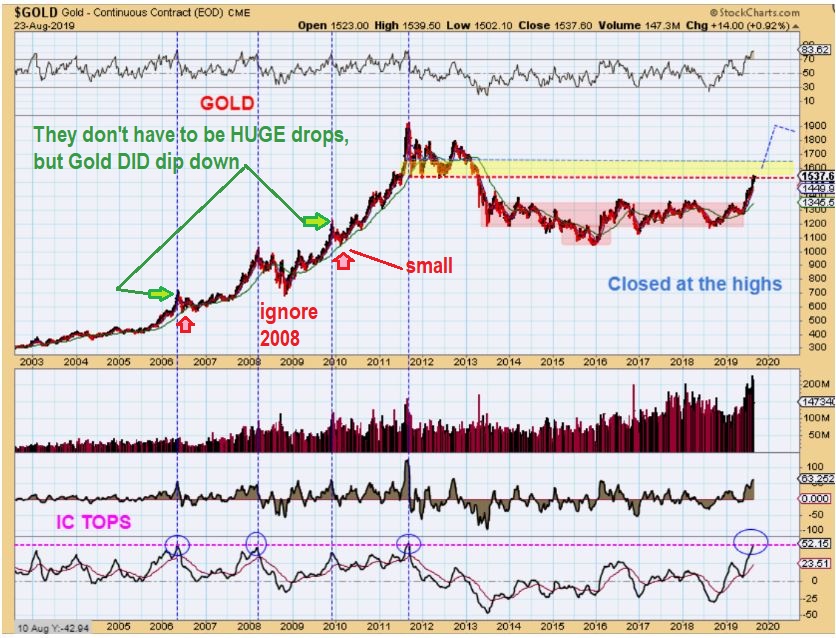
Same chart with 1 more added thought. The ICLs shown with Green arrows are not massive sell offs, but they are multi-week dips so we may just see Gold run higher this week, and then start a small stairway lower week after week ( around the Fed Mtg? ), or we may rally for a week or two, and sell off despite the FED Rate Cut. My guess? A rally now , but a dip into the fed mtgs, and then a 1/4 Cut disappoints, “sell the news” into a deeper ICL. THAT’s JUST A GUESS, but this chart covers almost 20 years & has a clear warning to me, we may be close to a weekly top! Stay Frosty my friends!
.
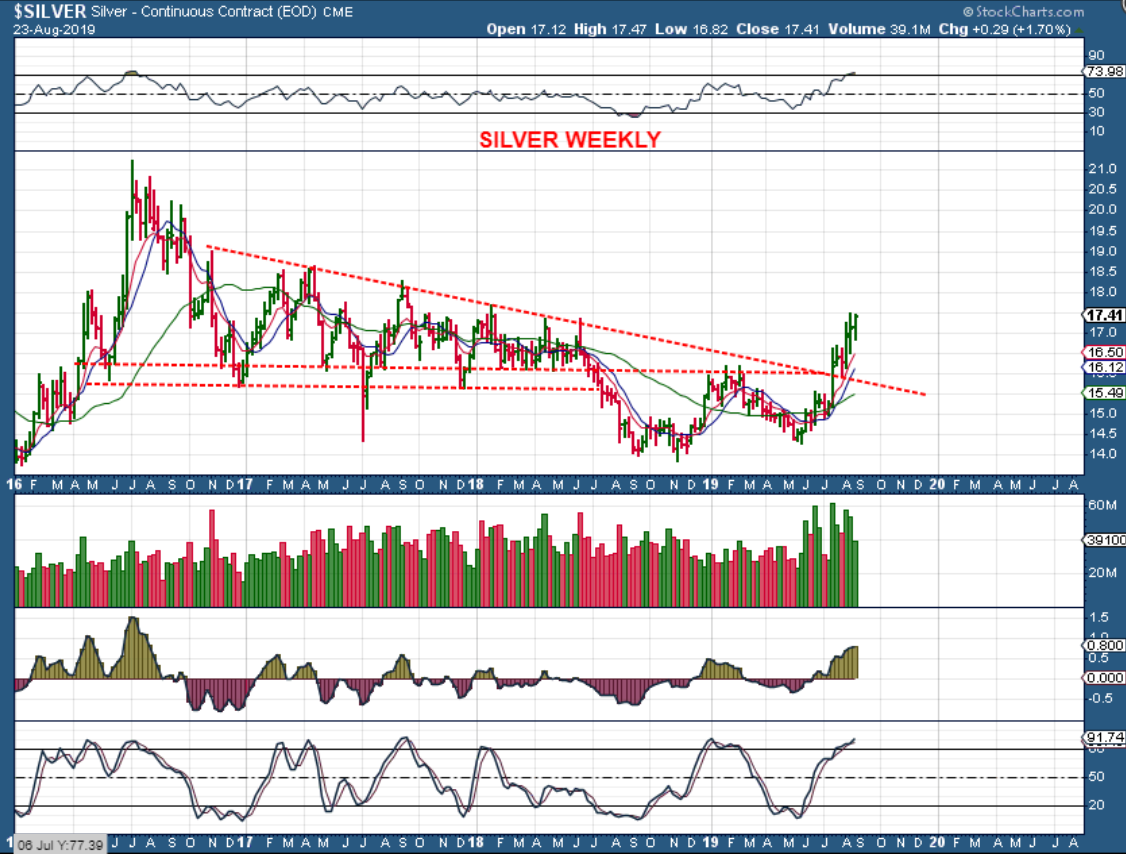
SILVER WEEKLY – Silver wants to run to $21 over time, but my first target area was $17.50 and we are there. It does look like it could easily go higher, but it is getting weekly overbought too.
.
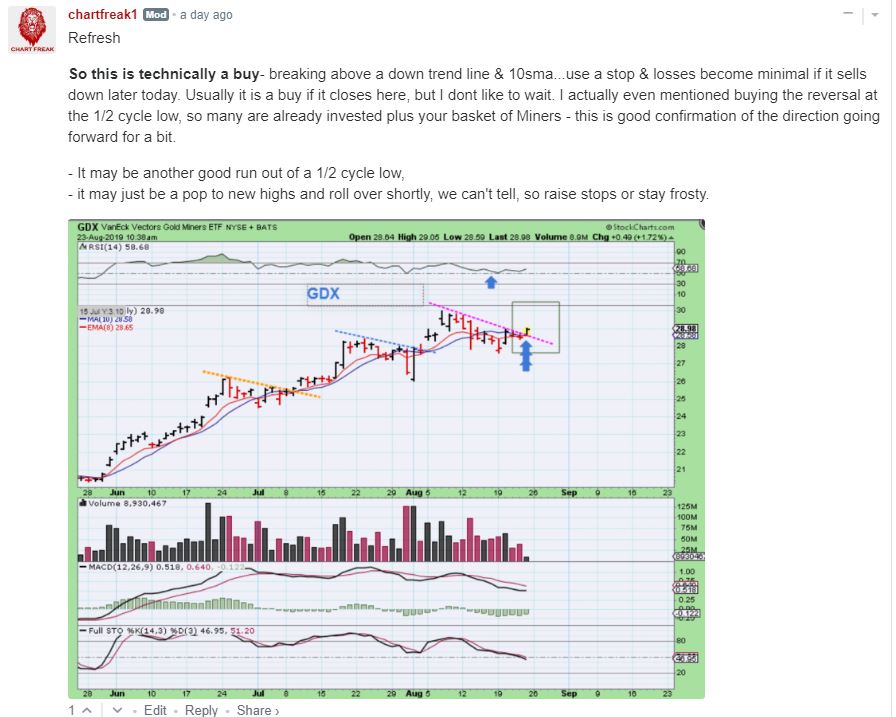
GDX AT THE OPEN – I posted this in the live chat area after the open as another technical ‘buy’, even though my reports already called the reversal a possible 1/2 cycle low ( Buy with a tight stop), this is further confirmation . Click on the chart to enlarge it & read it.
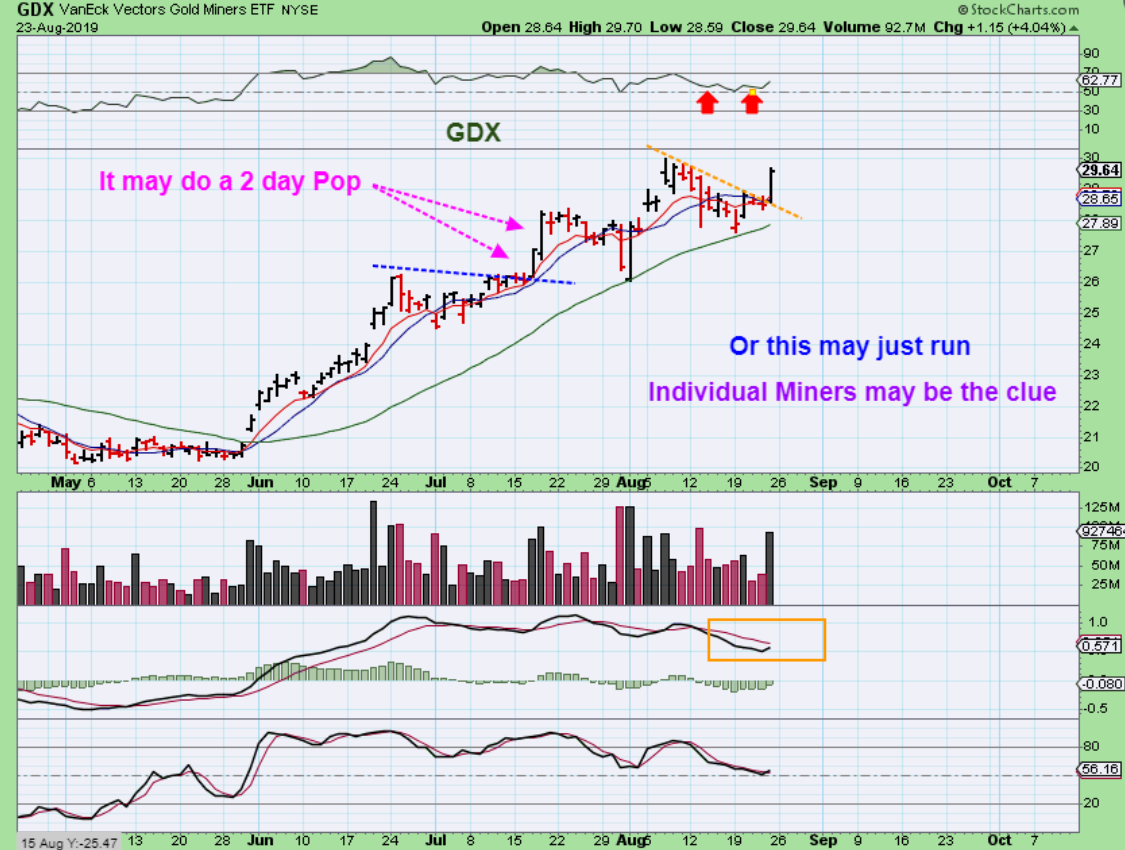
GDX AT THE CLOSE – GDX ran up 4% and closed near the highs, so this looks like it also wants to break to new highs. I have been targeting $30- $31 for a while now after reaching $28 . GDX had Great volume, so I do think that we could continue to rally next week, maybe to $31+. Note: INDIVIDUAL MINERS ARE ACTING ON THEIR OWN MERIT. Some are at new recent highs already, some are not, so I expect that results will vary going forward.
.
NOTE: I have already pointed out that INDIVIDUAL MINERS ARE ACTING ON THEIR OWN MERIT. I showed how some are at new recent highs and hardly pulled back when GDX dipped for 8 days, others dropped 38% or 50%. . I used HMY, AU, RGLD, NG, EGO, and others to visually show this. THAT MAY CONTINUE GOING FORWARD, so when we get a future dip, I will be pointing out Miners charts for varying reasons (Some may be “Holding near highs” or others may have reversed at a 50% Pullback with a good chance to rally to new highs”, etc etc ., so I expect that results will vary going forward. The good news: At the next ICL, we will have MANY opportunities to buy lower & ride another rally to good gains! 
.
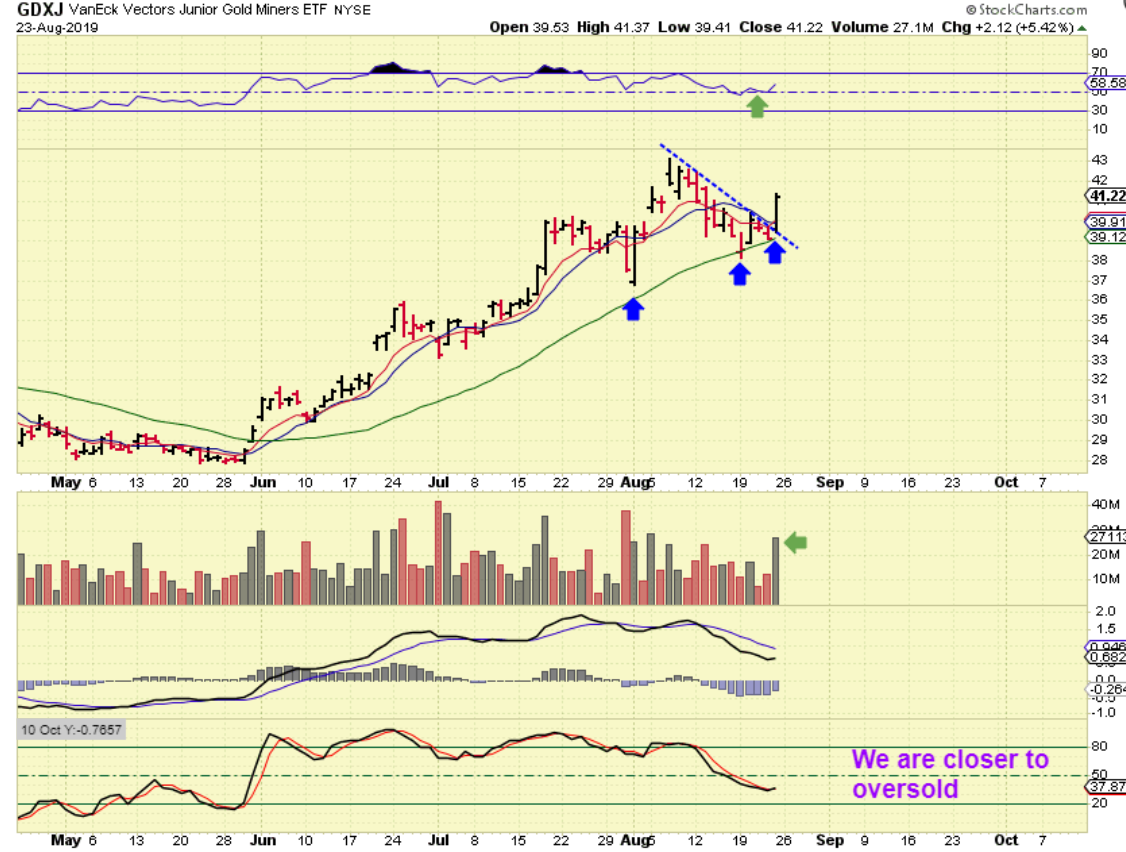
GDXJ – GDXJ outperformed and closed up 5.42%. I bought this reversal earlier as a possible 1/2 cycle low, and it could run to new highs. Excellent volume came in on Friday.
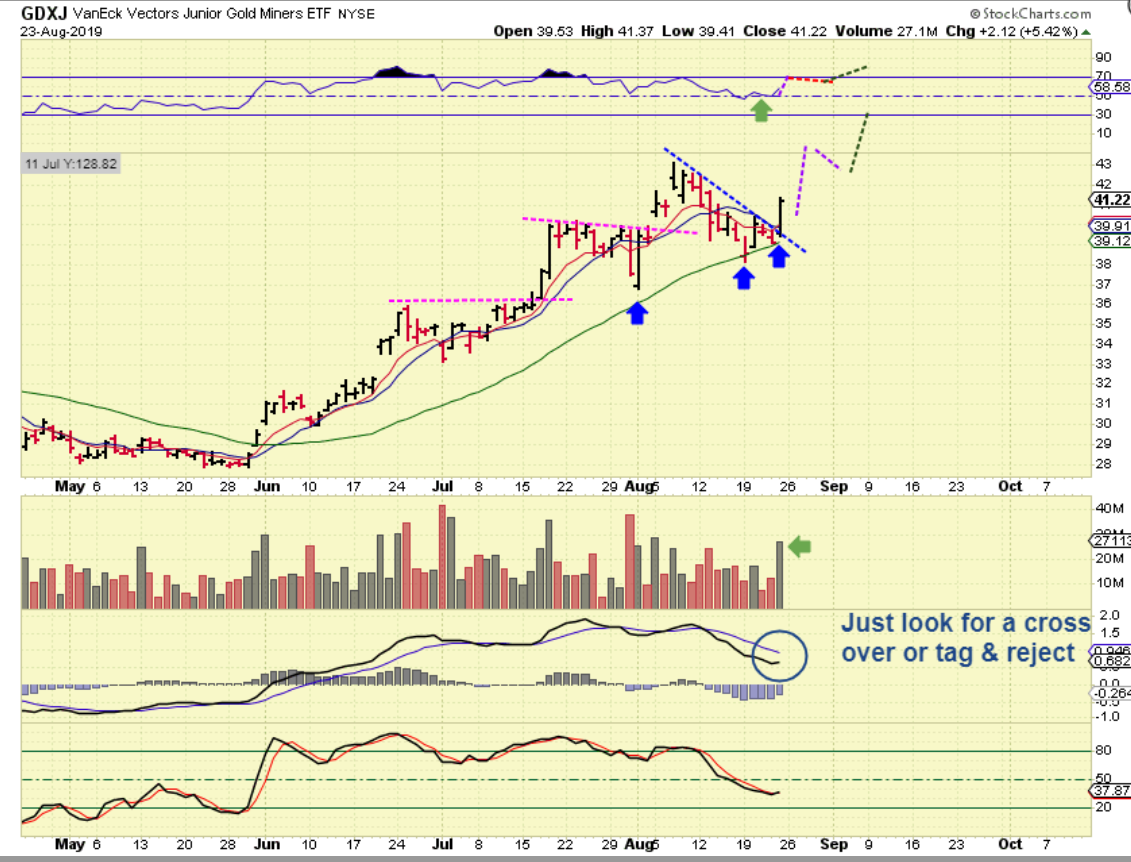
GDXJ – I’ll be watching that MACD as we advance. A ‘Tag’ instead of a cross over is a short term warning to proceed with caution. Based on my chart of GOLDs weekly situation & IC Tops in this area, I am thinking that this will be a top with big divergence soon. I will watch for that, and…
.
Oh Alex- You’re not pulling up one of those old charts again, are you? 🙂 YES, I AM ! For learning and for confidence going forward. Since last year I had been mentioning that this BASE could lead to a run to former highs, creating a large Cup or Pan. This chart is from one of my January reports. That run would lead to $30-$31. We have now seen that happen. I had plenty of naysayers back in May when we loaded up the truck with leverage, especially on Twitter. Now, a chart like this will build your confidence going forward. We have filled our pockets, and…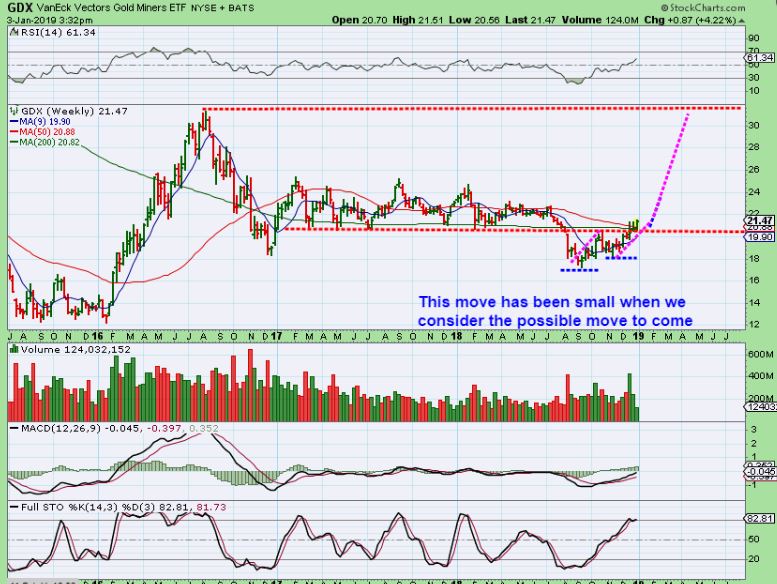
.
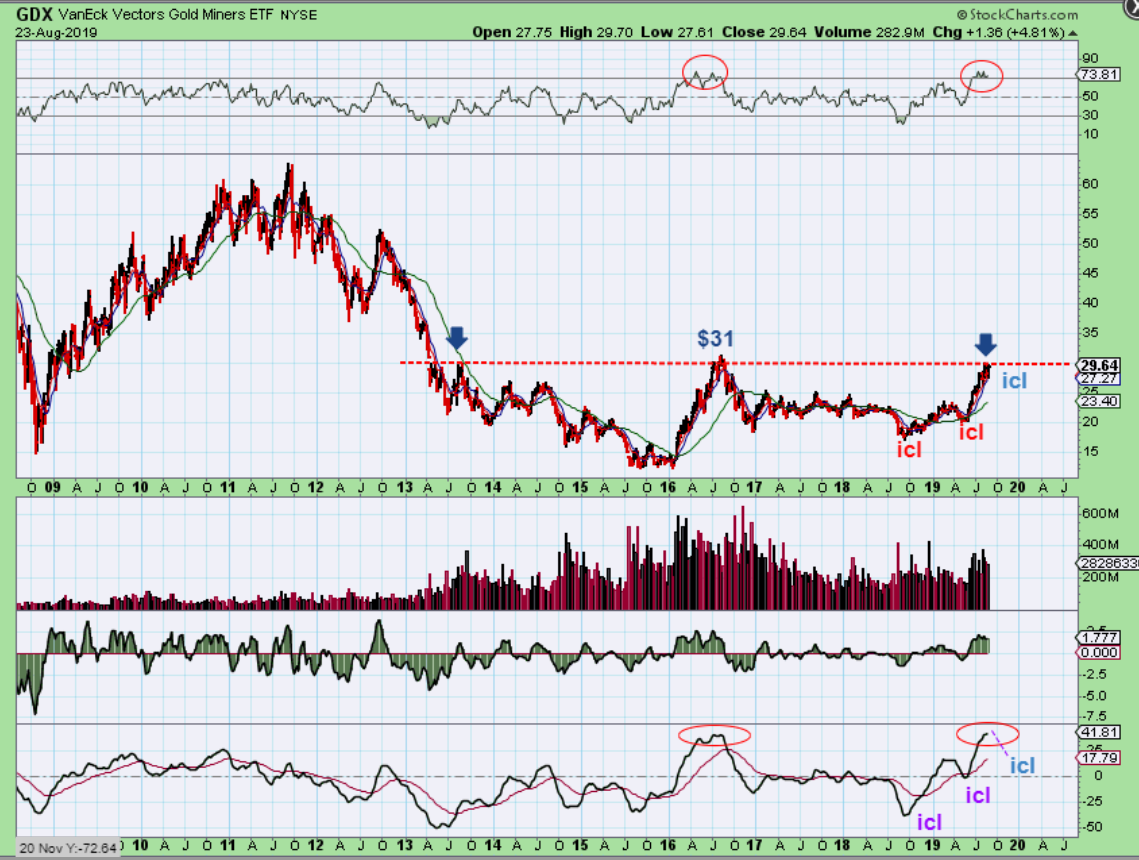
GDX WEEKLY BIG PICTURE – That rally has completed the original call for a ‘cup’ or ‘Pan’, but it also leads us to this is massive base formation. The future is Very Promising. My first Big Picture target was to complete that cup to the 2016 highs area. My Point now? : Bigger picture, if the sector remains bullish, we can work our way out of this base and then reach GDX $60. $20 to $30 was awesome, image $20 to $60! SO THIS COULD BECOME A VERY PROFITABLE BIG PICTURE. but understand that it will not just be straight up. We will have bumps along the way, we could conceivably stall & pull back to an ICL even from this area first, so let’s just accept that and use stops.
.
This was another choppy sloppy week, until Friday came along. 🙂 Especially after the Jackson Hole speech did we see the Markets completely roll over & sell off, and Precious Metals rallied Very strongly. That 1 day pop has Miners closing at the week highs, so this was a good week for Miners. This rally can continue into next week, but my report showed ( see the Gold Big Picture Review) that we are at a point where prior Bull Market Rallies topped temporarily. I personally plan to Stay invested, but also Stay Frosty.
.
I love what I am seeing in the big picture and we are still making money from this run since may, but I have to keep it real, right? I have to report to you what the charts are showing me. There are ‘exceptions’ at times, and things can get extended under very bullish conditions, but I don’t plan on exceptions, I plan ahead based on the charts. What I showed you in Gold was also during a very bullish run. I cannot tell you where the exact top will be right now, but that Gold indicator is flashing a signal that we may be near a short term top & begin a drop into our next ICL. I vew that as a Buy Opportunity in the future. From here we don’t have to bail out, that is a Weekly Gold chart, so there could be another week or so of upside. Going forward we can simply continue riding positions and raising stops to assist us in locking in gains. I take things step by step in the daily reports, so that will be helpful along the way too.
.
Have a great weekend, Rest Up, Next week could be an exciting one too!
.
~ALEX
,
AUY By Request – This strong reversal was a Buy recently breaking the down trend & again on Friday. I posted this in the live trading area and I still think it can break to new highs and do as HMY, NG, AU are doing.
.
AUY – Even though it rose almost 10%, I think it can run higher, so if you bought it, I’d hold on. Sometimes after a big Pop, we see a Monday dip before the rally continues, so if you see a slight pull back on Monday on light volume, it may be a buy again at a lower price or you could add a little for a short term trade. My stop would now be raised to Thursdays low though ( under the 10sma)
.
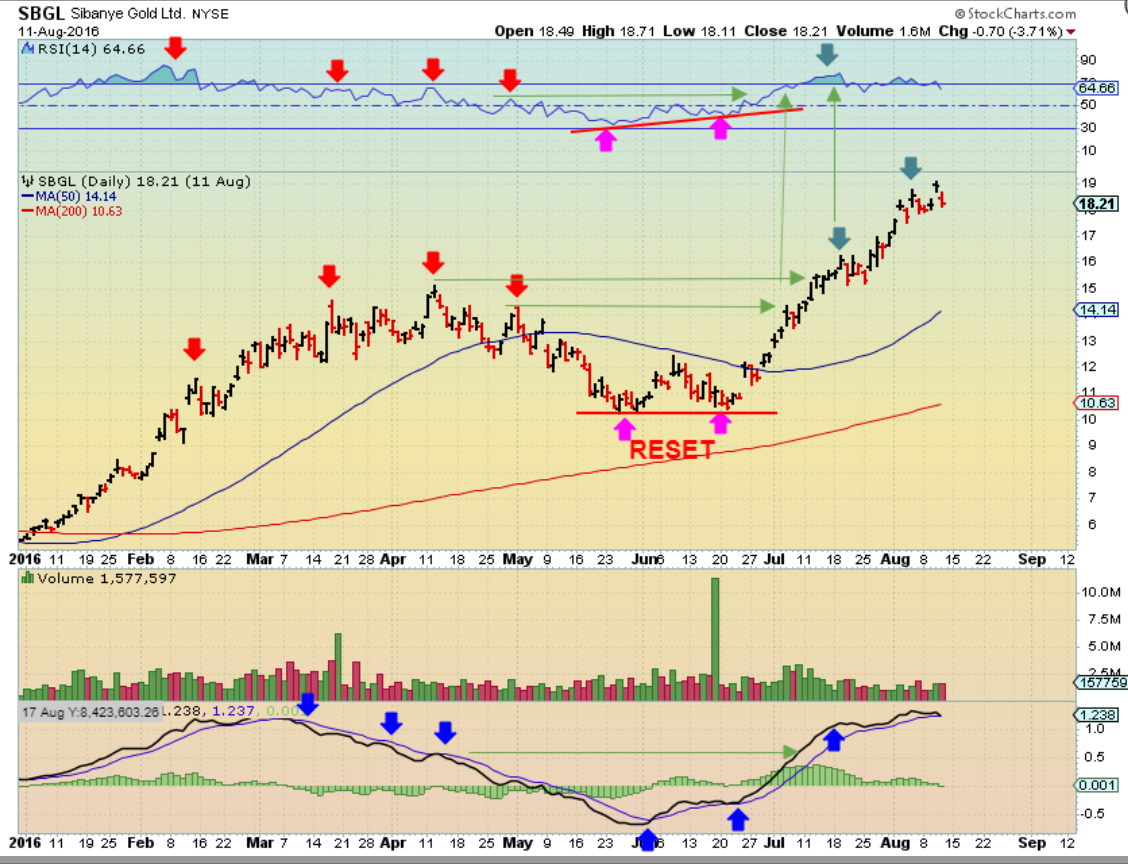
RESETTING INDICATORS – SBGL 2016. A healthy dip resets the indicators. When I say that I see each new high with divergence & I expect a pull back, this is a good example of what I mean. This was a very strong run, but each new high showed RSI weakening, so I become cautious & simply raise stops (see red arrows ).
We then got the May 2016 ICL, and the indicators kept dropping. NOTICE THE MACD. It NEVER crossed upward again from March bounces to new highs.
SBGL dropped during the month of May until reaching the ICL- then it quickly recovered & put in a Bullish divergence double bottom low. I look for this and several other things when expecting a bottom. The RSI reset on the double bottom low too & the next peak had an RSI higher than the past peak.
.
The same SBGL chart: So you can look at this chart and say, “I could easily ride that out, since it went higher eventually.” True, but look again. That was a $15.25 top to $10.25 drop. NO ONE can ride that down and love what that does to their account, so I try to sell leverage & maybe 1/2 of my basket of Miners somewhat near the possible highs, and re-buy near lows.
.
HMY- When I see a base breaking out though, I know that the reaction can be a strong one, so I try to stay invested in these. This was my June 19th chart of a Base in HMY showing a run to around $4 & then a dip…
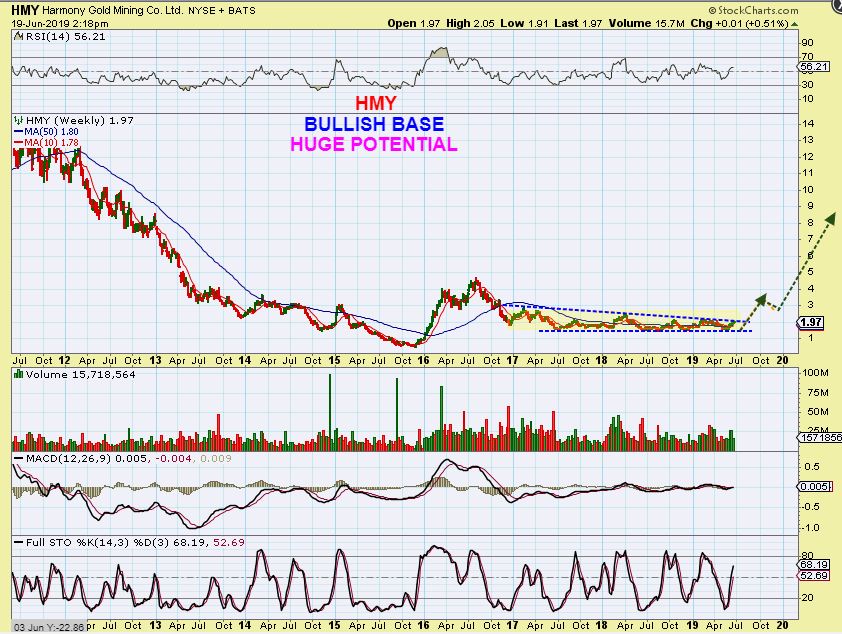
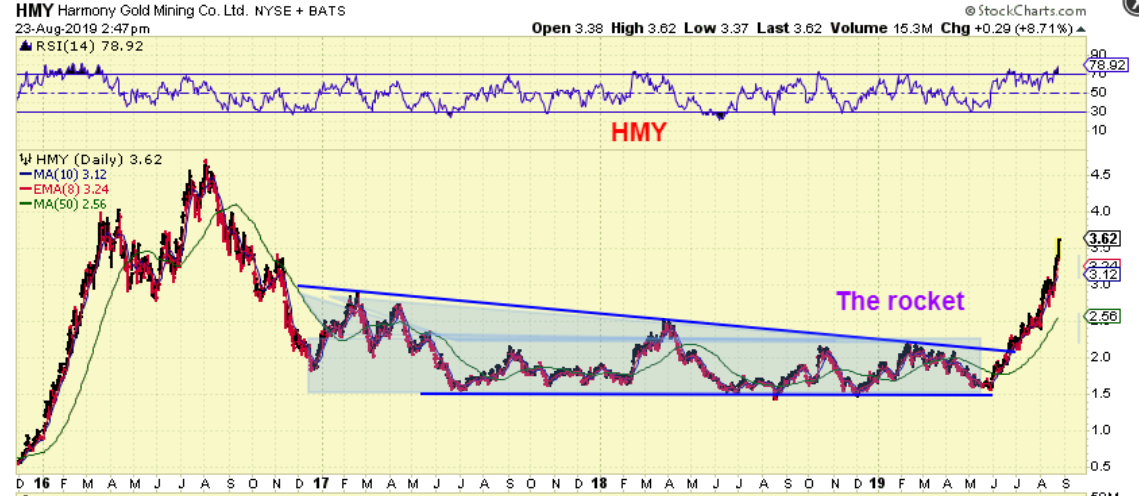
HMY – HMY has run to near $4 ( maybe this week?) and the reward has been the rocket ship ride out of the base.
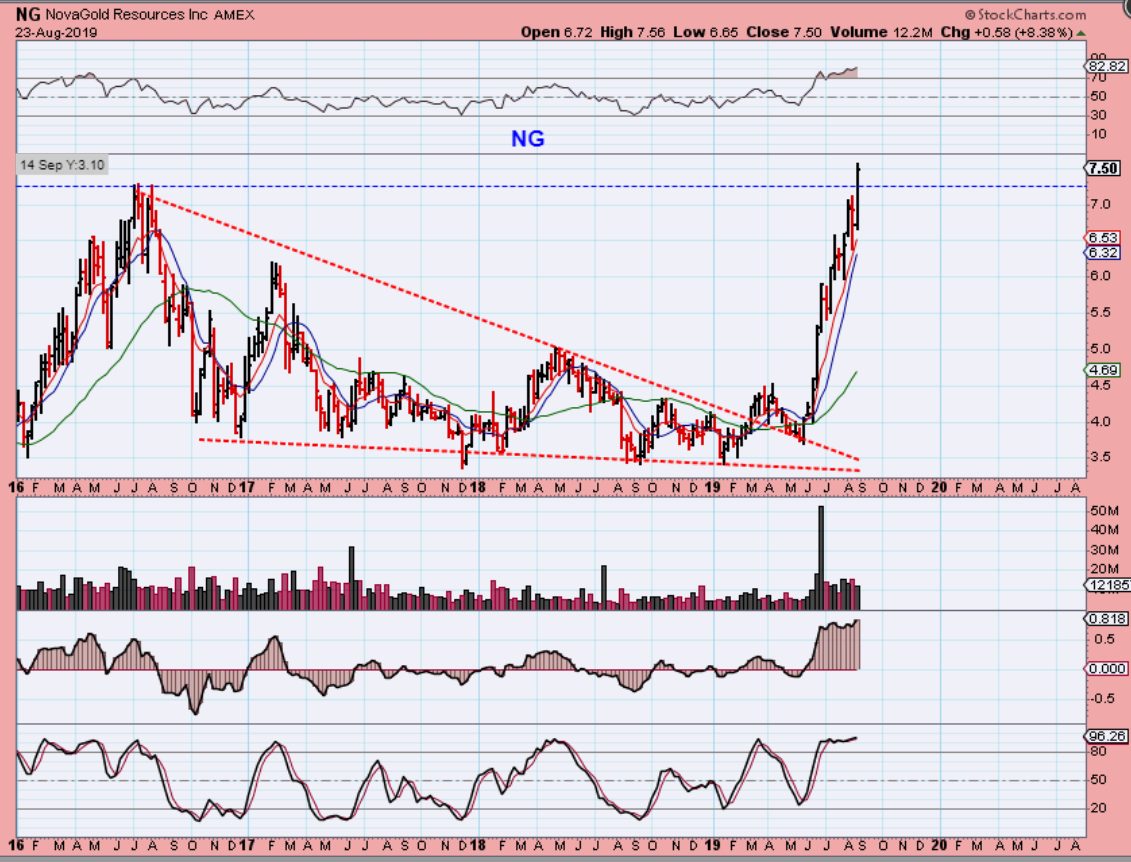
NG BIG PICTURE – Another base that I pointed out was NG as it back tested the break out, and it too has rocketed higher. This is at NEW highs, but is also very extended, so what if it pulls back to the $7 ish area?
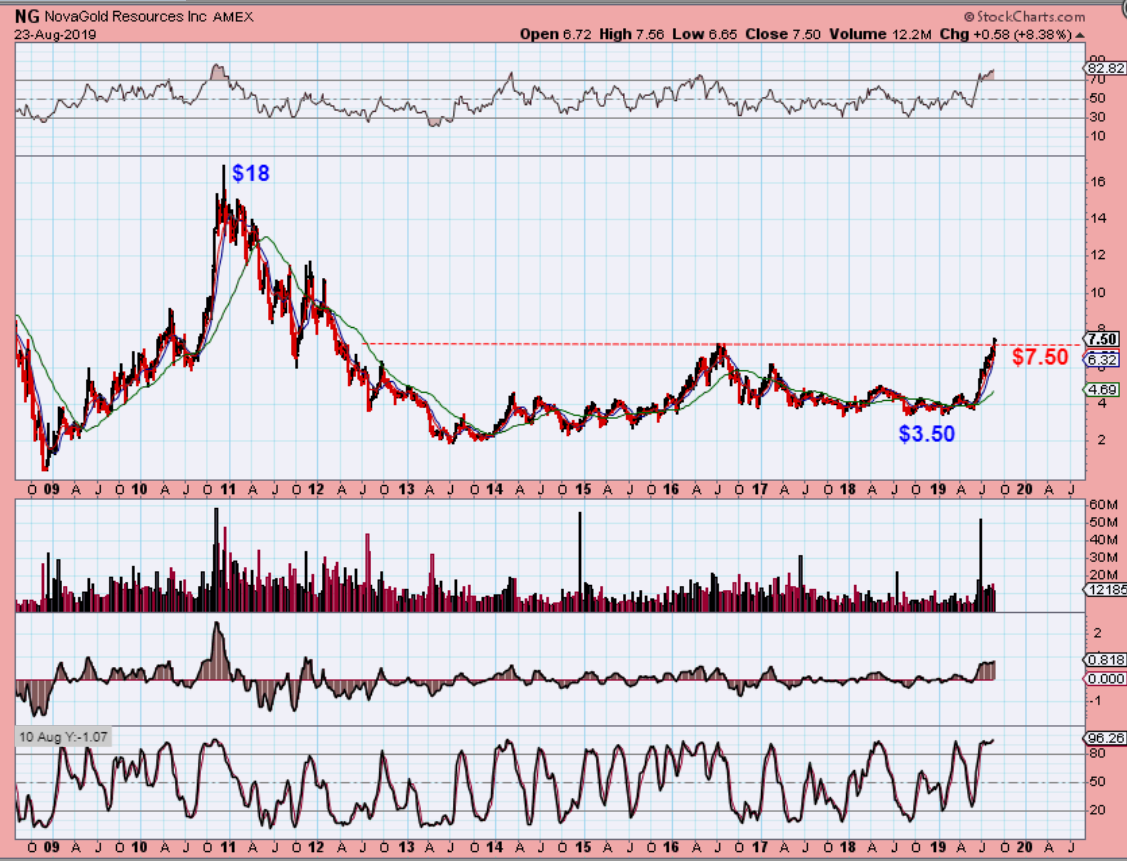
NG BIG BIG PICTURE – The base is completing, we formed a cup or pan, but the next ICL could launch NG even higher. These charts are very Bullish, and…
Remember: GDX & GDXJ are now sitting in similar multi year bases !!
.
RECENTLY I made the statement that when Miners sell off for even 8 days, 1 or 2 good days can erase all of the losses , concerns, etc.
The saying is that a Bull Market undoes all the losses & pain over time, as long as it remains a bull market . Well AUY gave me an example of that on Friday, so I’ll just show this chart with that thought in mind.
AUY sold off & chopped around for about 11 days, but what happens with 1 good day like Friday? Look at it this way, AUY ‘closed’ higher than it has ever closed since January 24 of 2018. 

