August 20th – A little More Chop
.
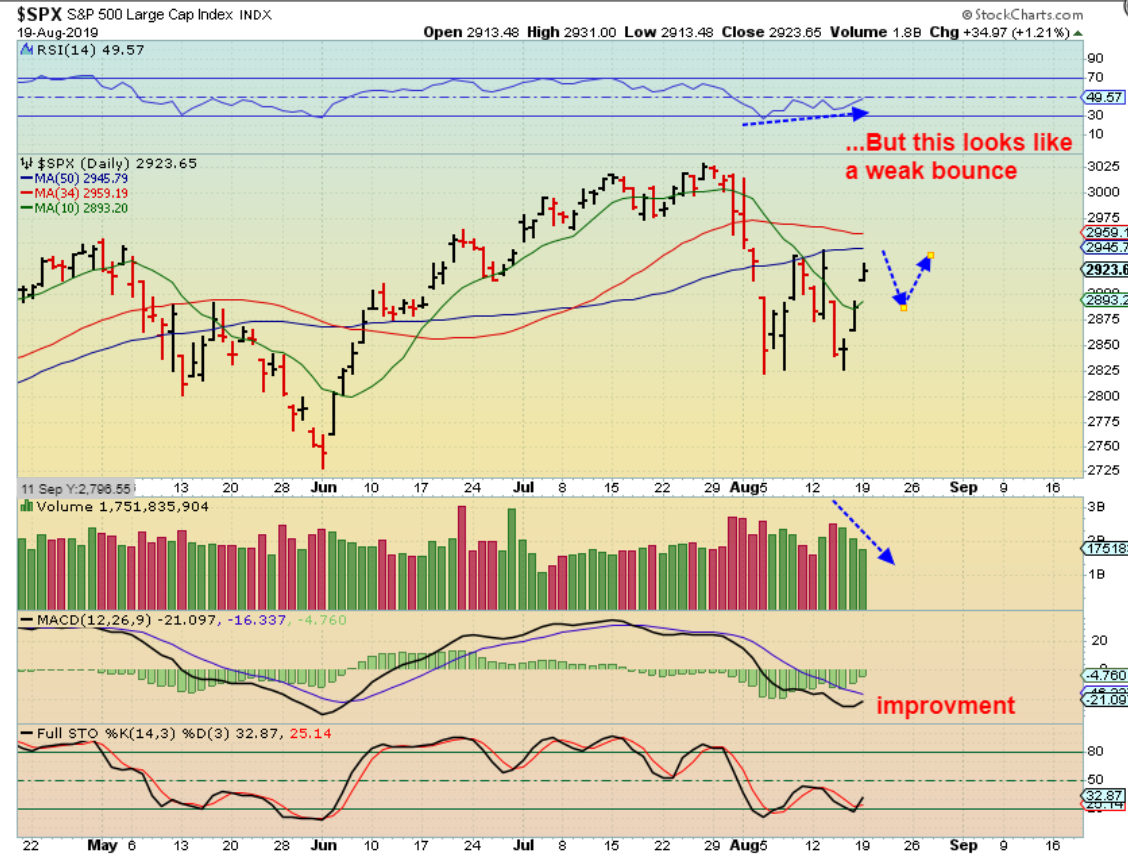
SPX – The General Markets gapped open again, and the 50 sma has been acting as resistance, I see ‘improvement in the MACD & RSI, but volume was weaker and this gap may fill sooner than later. It is still oversold, but …
.
QQQ – When I look back to the 2018 year end sell off, I see a very similar set up – a choppy sideways sell off, even though the MACD was improving. We need more time to see how this plays out, but again, if you bought the reversal 2 weeks ago & wanted to be long the Markets, raise your stop to the higher low.
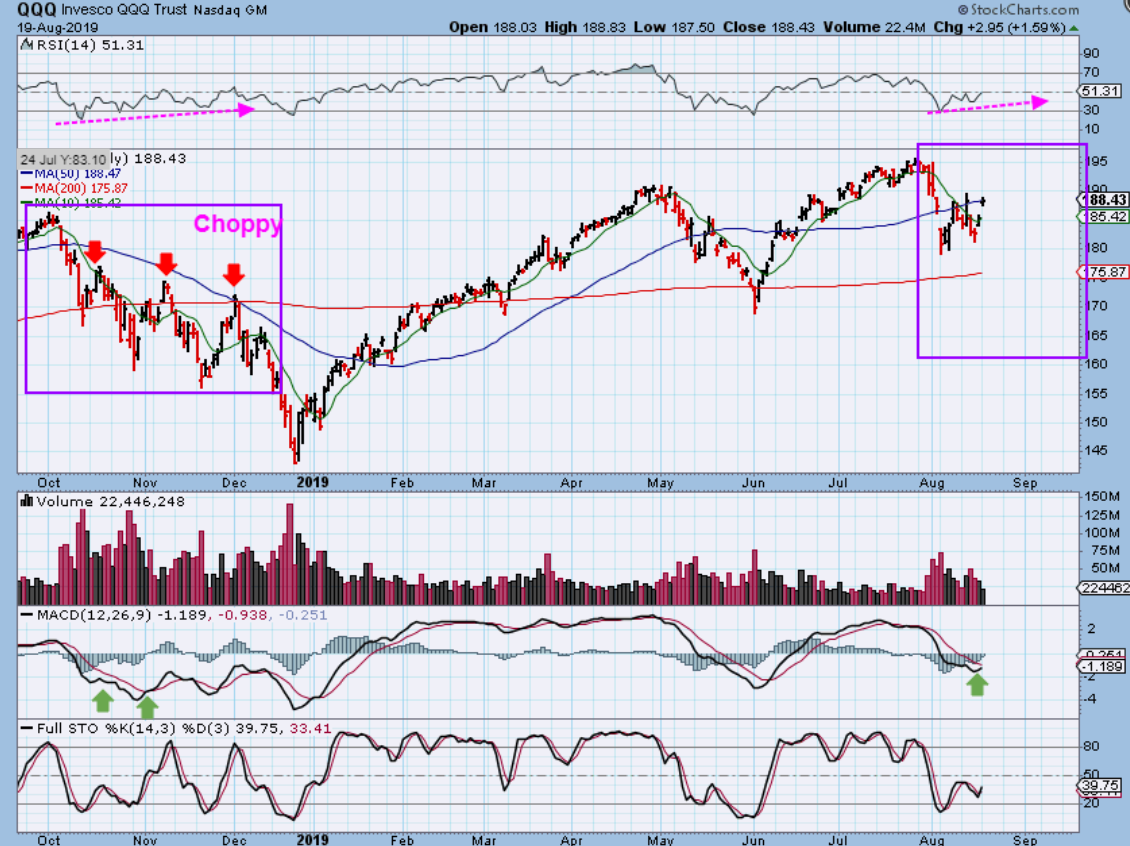
I will say that I do see some stocks setting up bullishly, while others are still not quite right, so this choppiness can continue & the sell off can too. It will take a little time to see how this plays out .
.
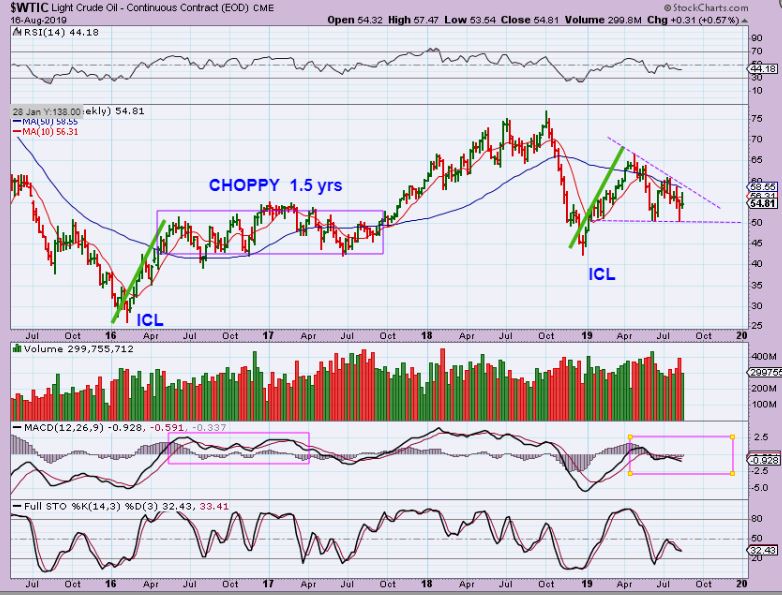
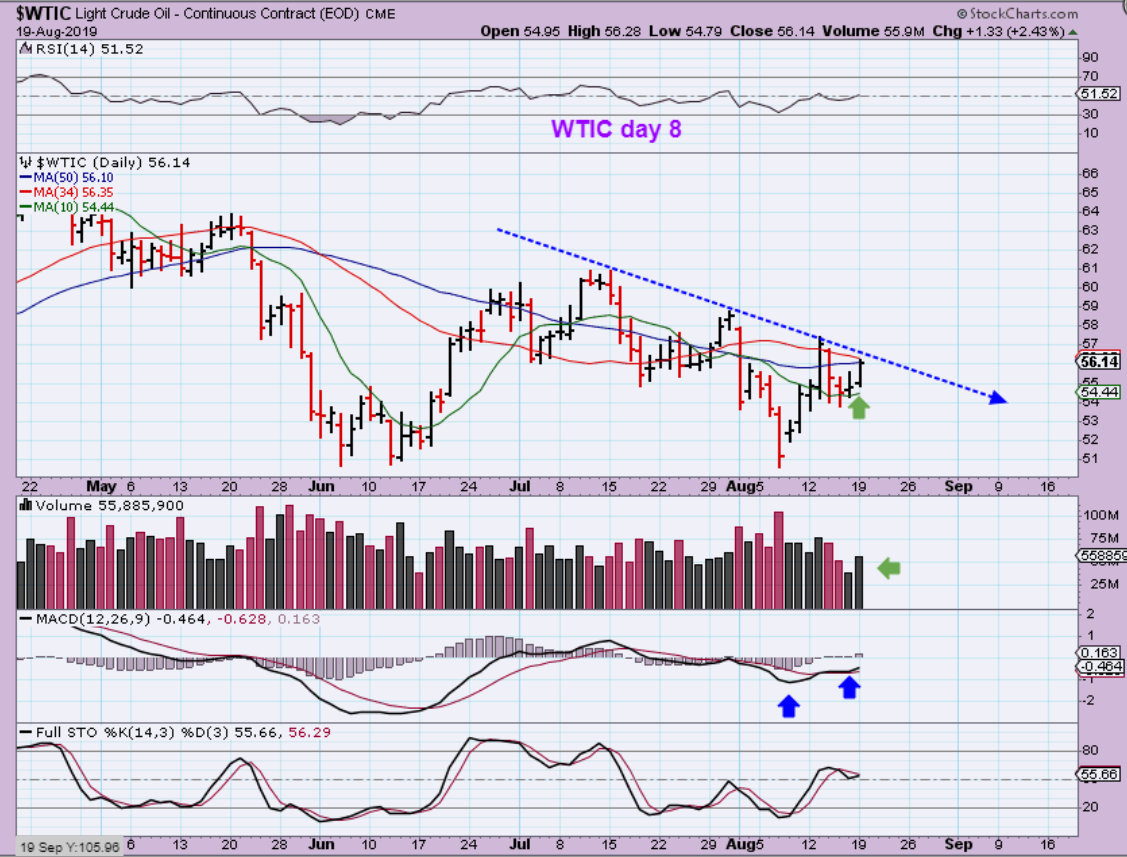
With OIL, I have mentioned my choppy expectations here in this big Picture report, but notice that Oil is also forming a triangle too.
.
WTIC – Oil actually looks like it could break out, but so far it has been more of the same chop. Here we see that Volume increased and the indicators turned bullish, but it also has been rejected in this area of the 50sma repeatedly. We may know by Tuesday which way this wants to go, but then we have to contend with Wednesdays Oil Inventory report ( They have caused Oil to sell off lately).
.
XOP – The XOP, XLE, and OIH do look like they could put in a bounce, and some of the Energy Stocks also look to be trying to bottom. We have seen that before, but they keep failing…
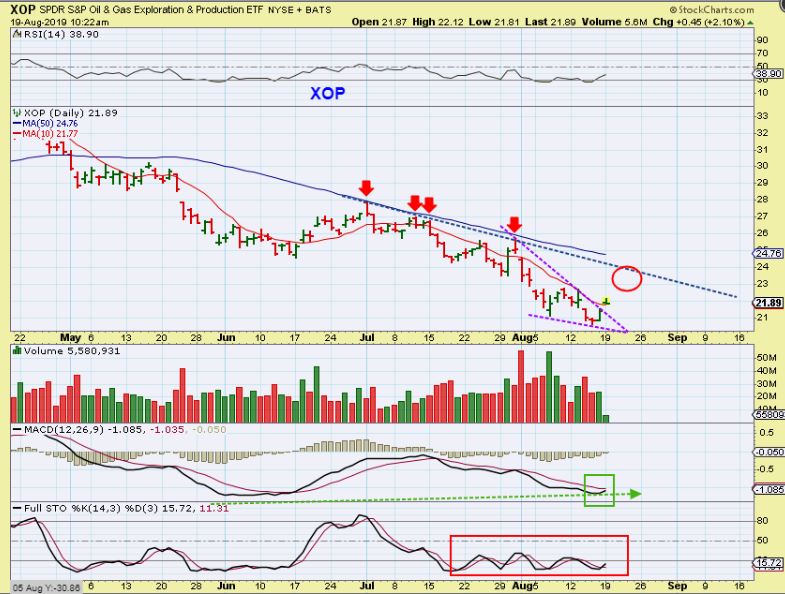
So let’s just look at a few Oil / Energy Stocks
.
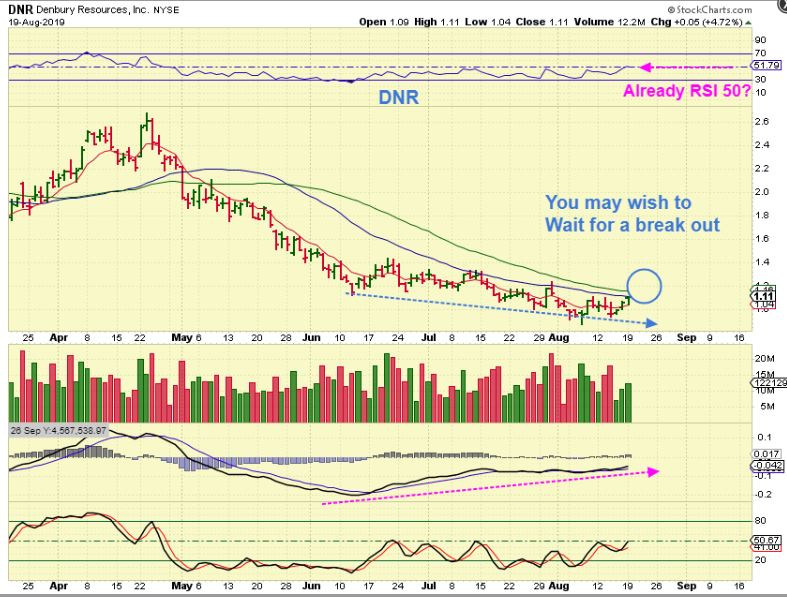
DNR – DNR, OAS, LPI, WTI, etc. still have that ‘Bottoming’ look, so I’ll keep my eyes open on this area for trade set ups. There are a few set ups now, but you may want to wait for OIL, especially after the Oil inventory report tomorrow.
.
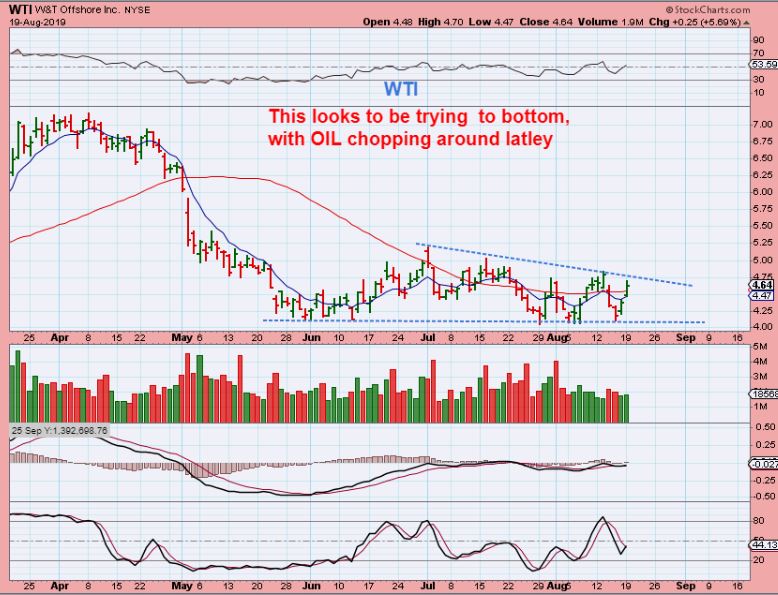
WTI– With Choppy Oil, W&T has been choppy, but it has more of a bottoming look to it. It closed above the 50sma yesterday, but it has done this & then suddenly failed recently, with Oil popping & dropping. It IS a choppy sector, but may be shaping up for some better moves soon .
.]
CHK – Chesapeake had a nice small pop to the 50 sma ( That is a 15% pop actually), so you can keep an eye on this one , and see if it breaks out above the 50sma.
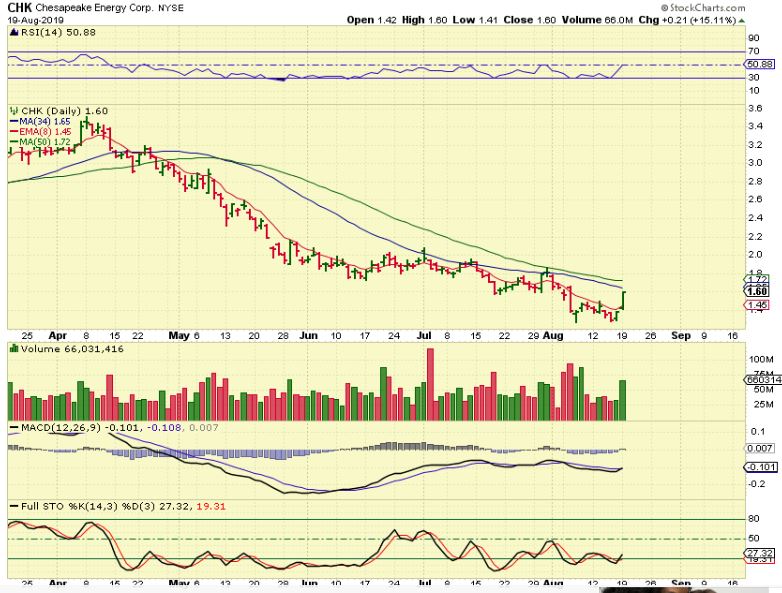
Like I said above: I’ll keep my eyes open on this area for trade set ups. There are a few set ups now, but you may want to wait for OIL, especially after the Oil inventory report tomorrow. You can also look at charts of Shippers like SALT, NM, DCIX, FRO, SB, EGLE, NBR, DRYS, and many more. They also started to move off of the lows.
,
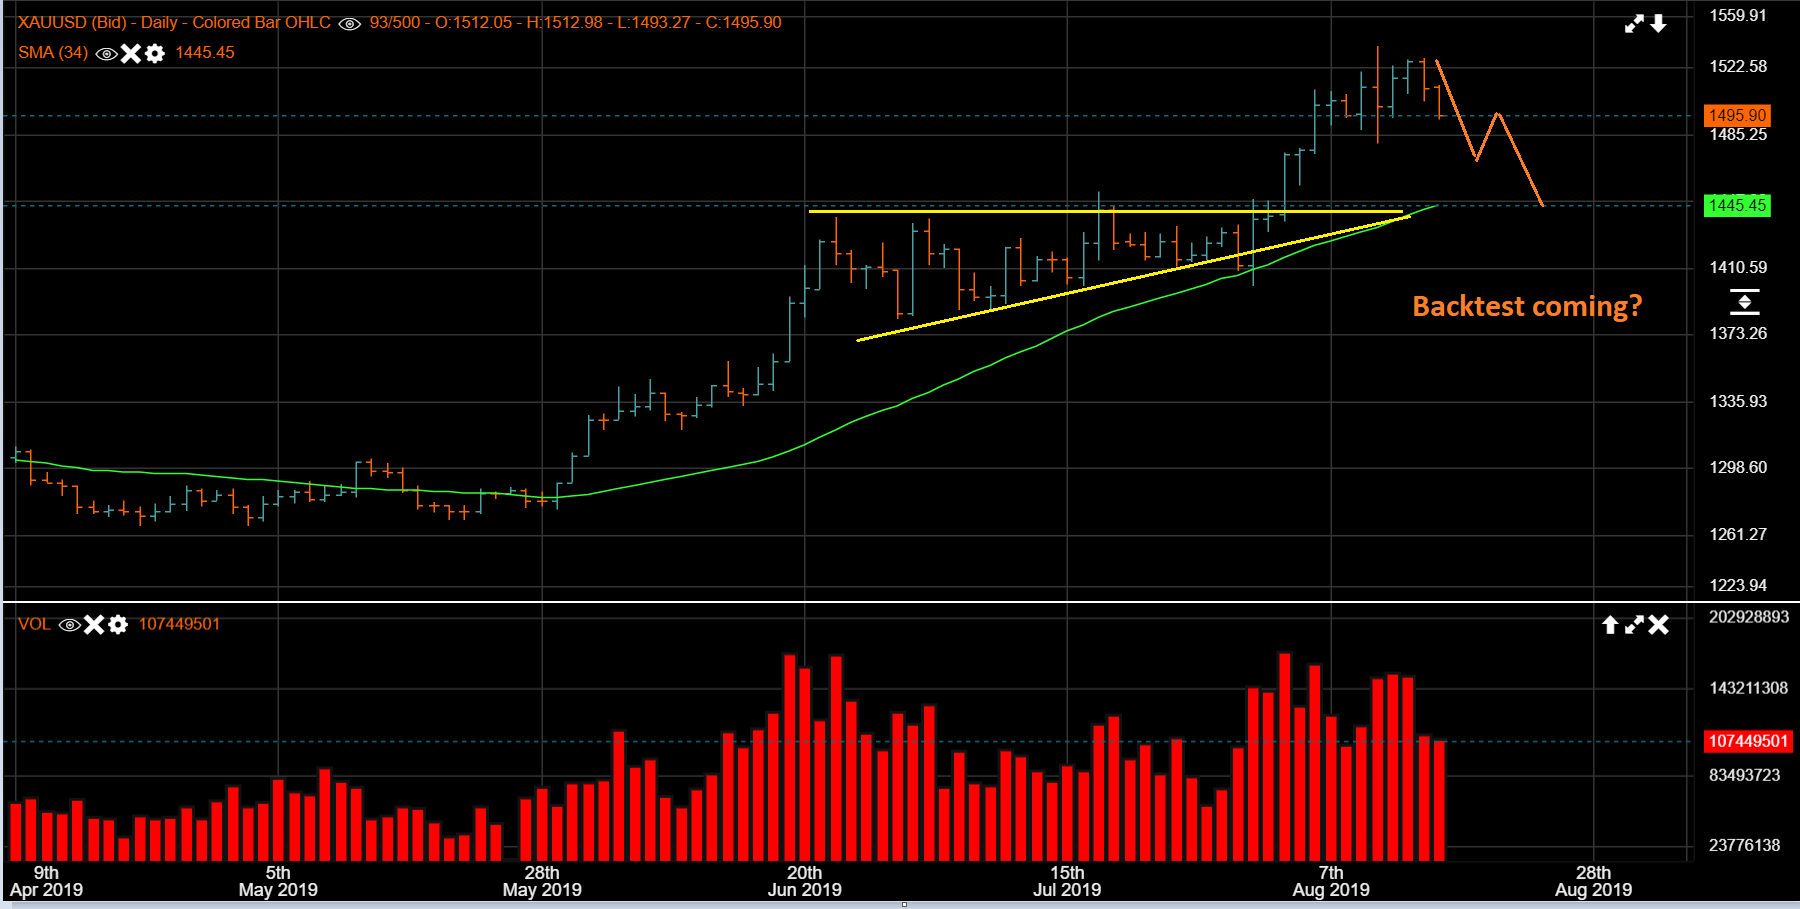
This week we have 2 events that often affect Precious Metals. Wednesday is the release of the FOMC MINUTES, and Thursday we get the meeting at Jackson Hole. These often move a choppy market in 1 direction of the other, so lets take a look…
.
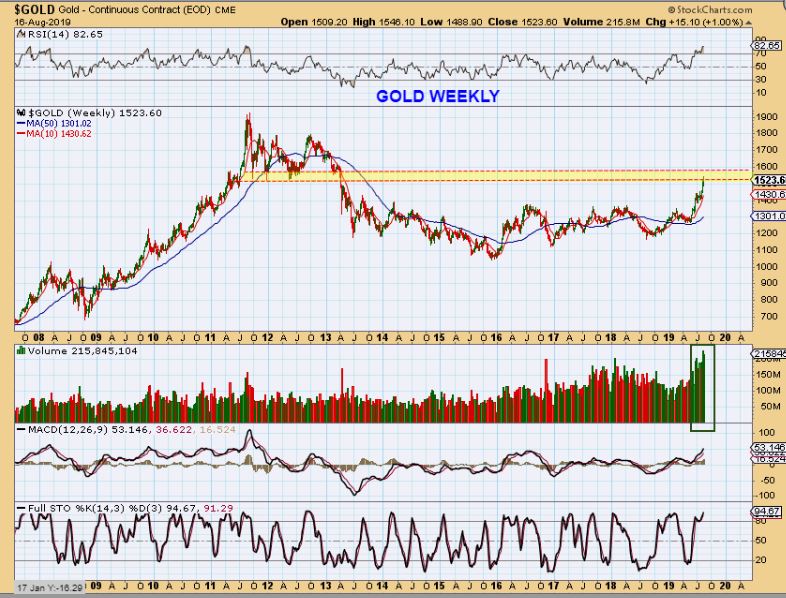
GOLD – Gold has been pointed out as hitting up into the resistance area. That can stall the price advance, but I do expect a break & run higher over time. Gold moving back to the 2011 highs is very likely, and also we should see it break out & continue higher, but for now at this resistance zone….
.
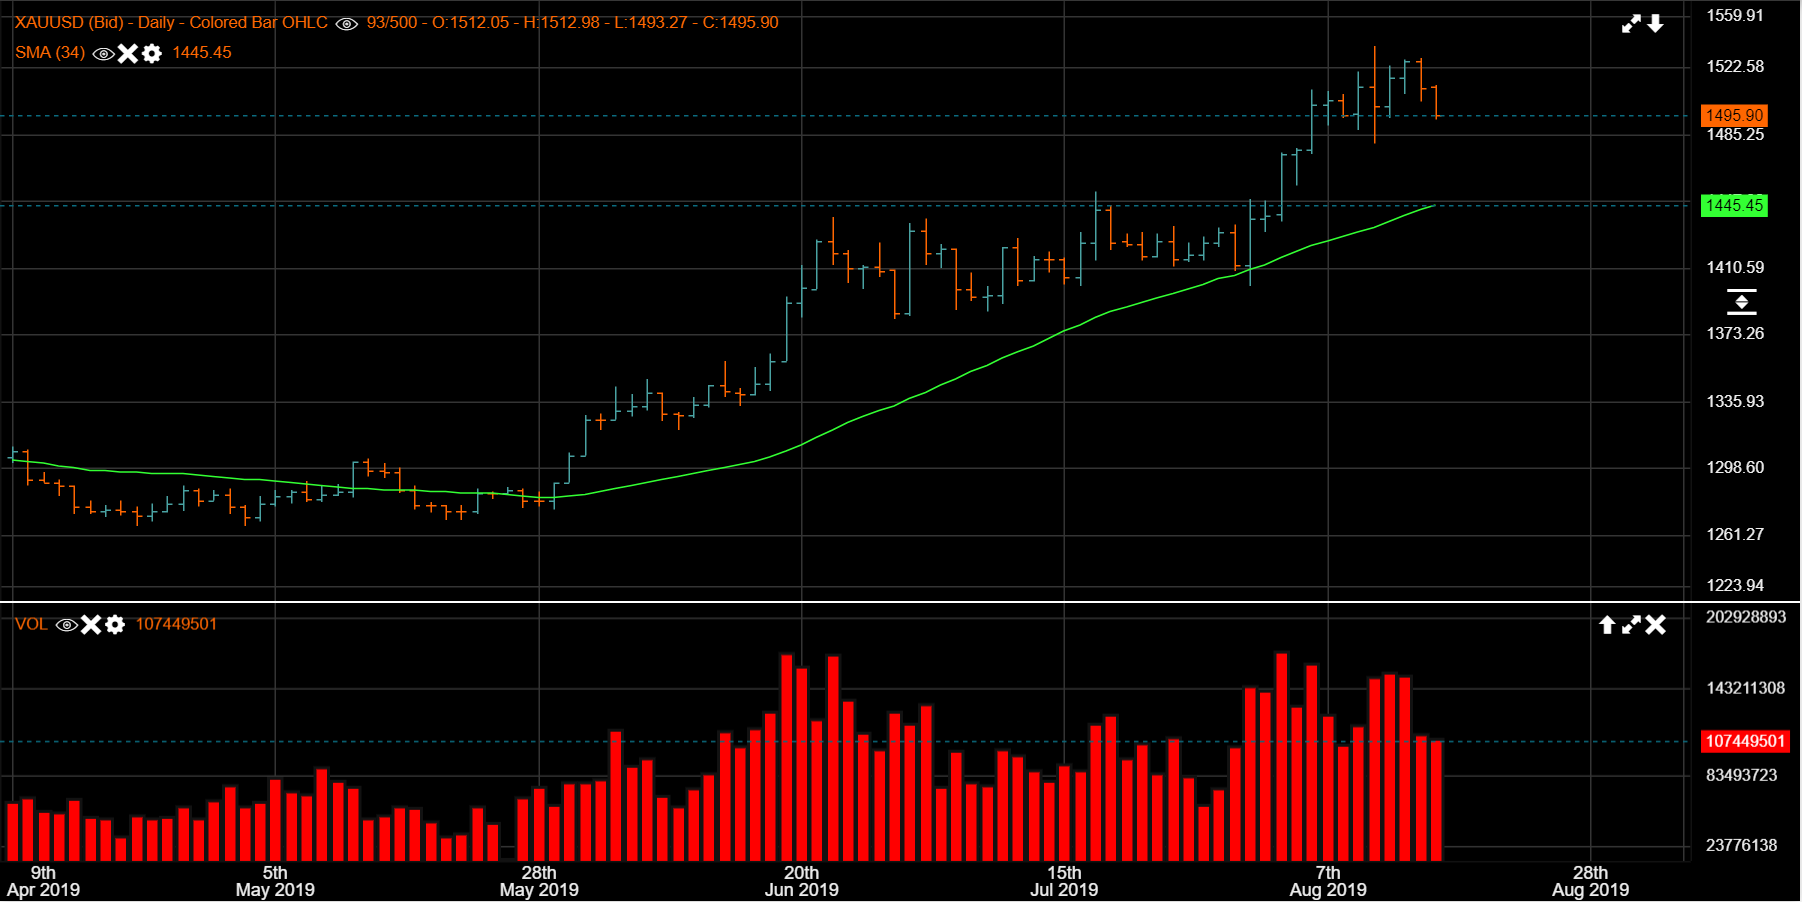
GOLD – For the short term, Gold started to sell off after hitting the resistance area. Let’s look at this a bit closer…
.
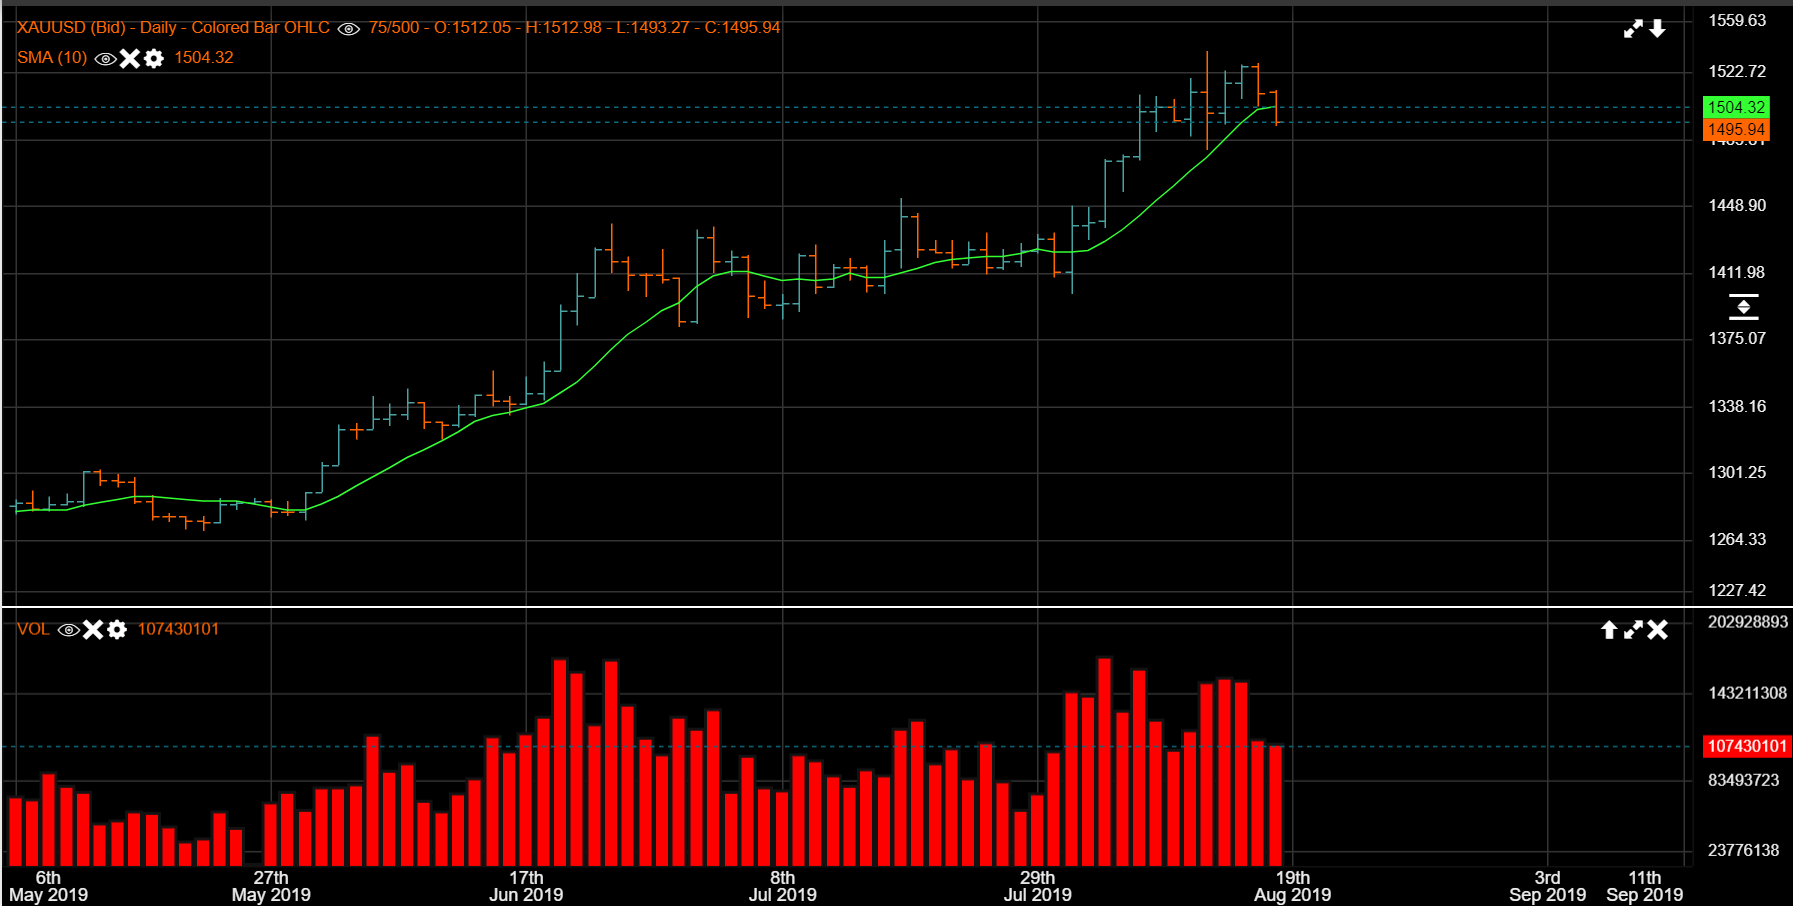
GOLD – So we notice that Gold closed under the 10sma. That usually happens during a dip or at least a choppy time period, so Gold may become choppy here again as it builds energy to break through resistance.
.
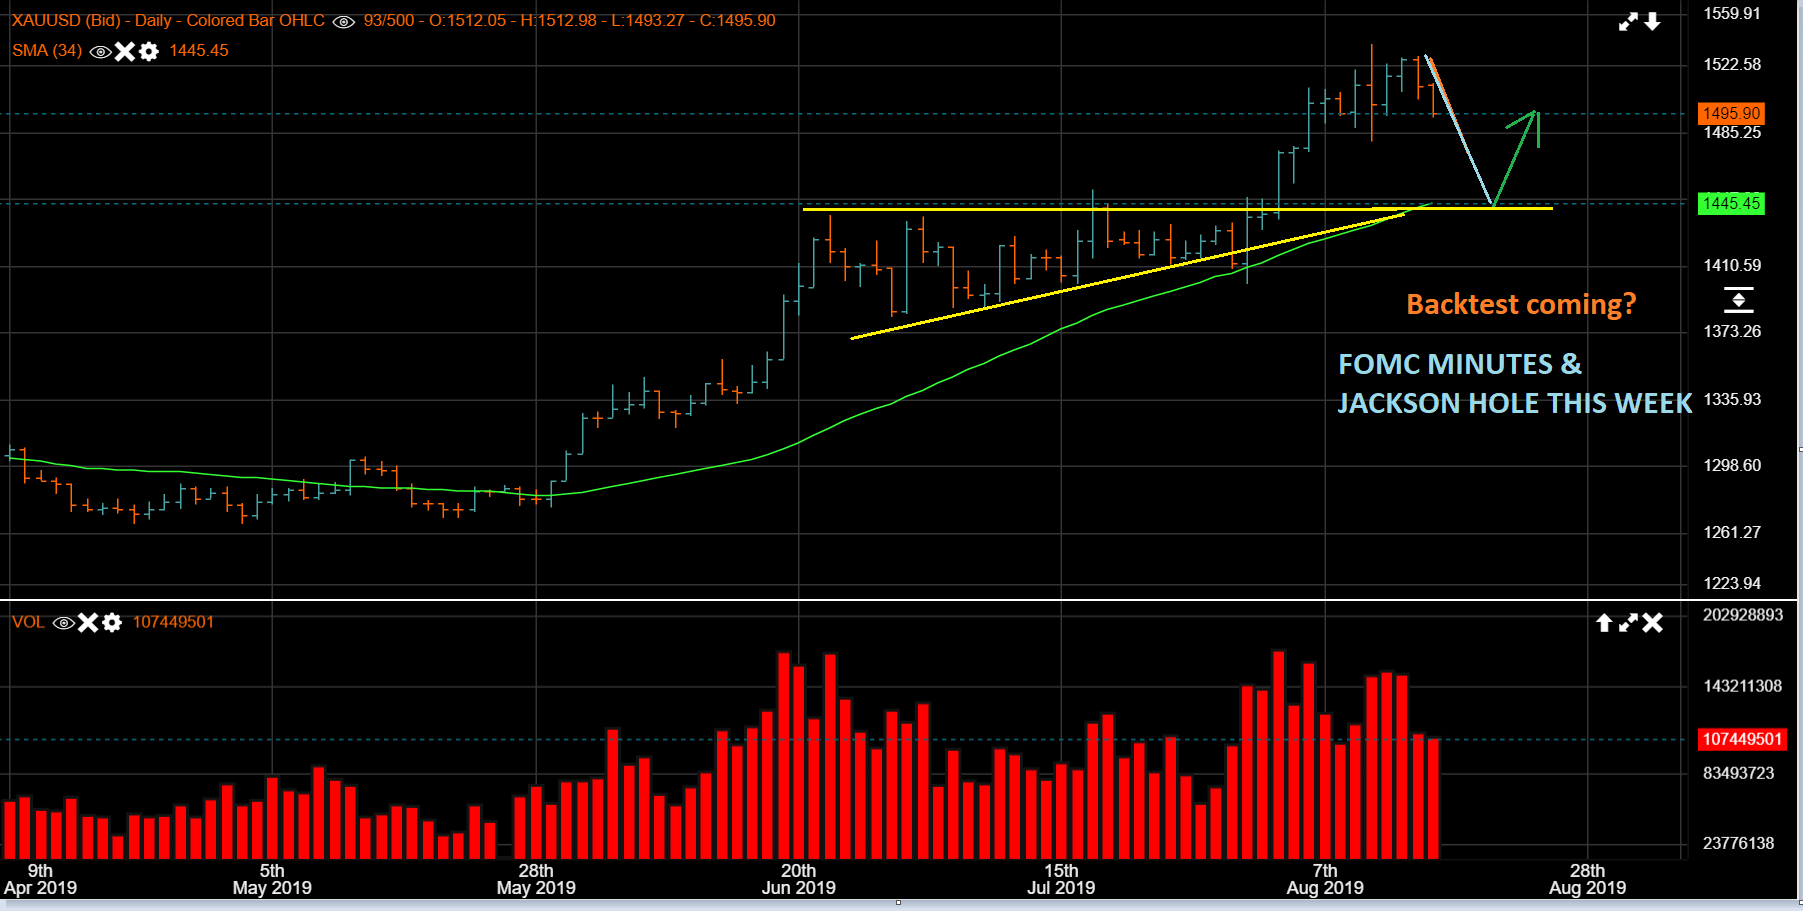
GOLD – 1 idea to watch for is possibly a drop now into a DCL ( Daily Cycle Low), since that could simply lead to a back test of the recent break out. The $1430- $1450 Yellow wedge would now act as support if Gold gets down there. Here I drew an a-b-c drop , however…
.
GOLD – A fast sell down into the Fed minutes Wednesday or the Jackson Hole Mtg Thursday is not out of the question. A rally after Jackson Hole would look like this. As I have pointed out several times in the past, Cycle Counts are often unclear with a triangle formation so we just have to watch for various likely possibilities.
.
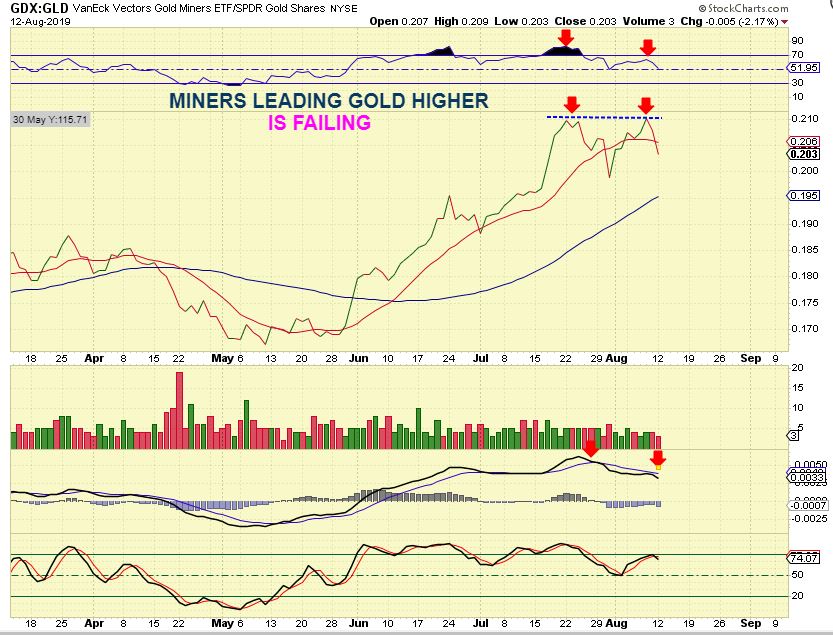
This was pointed out on August 12- a warning that Miners were no longer leading Gold higher, they were starting to draw back. I ( & others that followed me) was holding JNUG from the MAY lows and mentioned that I was finally getting out of leverage and cutting back on the size my basket of miners ( I will continue to hold a basket of Miners to catch any surprises to the upside.) Reversals higher can really come QUICKLY in Miners.
.
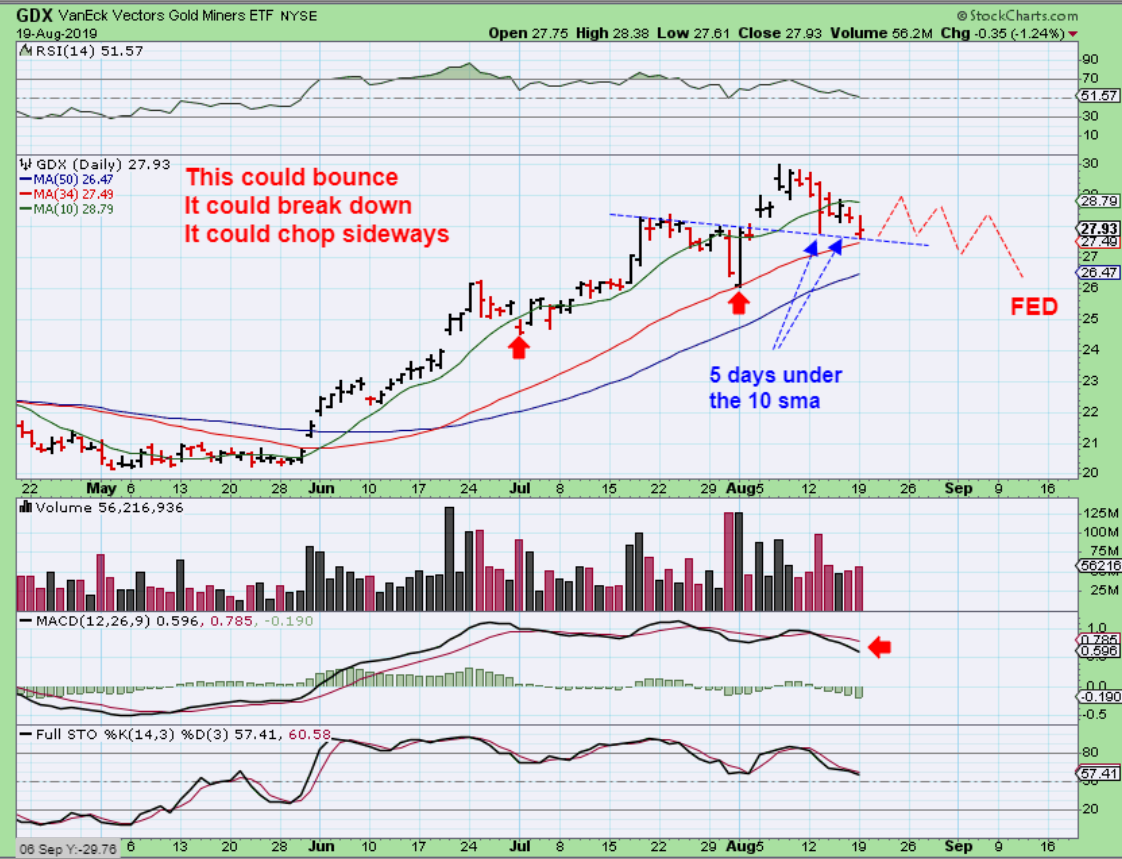
GDX – On Monday, GDX gapped down, bounced & turned green, yet then sold off into the close. Notice that Miners started to sell off 8 days ago, but Gold just started 2 days ago. With Miners leading this move down, I’d LOVE to see the selling in Miners slow down first as Gold keeps selling down. That could indicate that Miners will bottom first. GDX has now spent 5 days under the 10sma.
.
GDX – So this is the situation in a snapshot: This week we have 2 ‘events’ that usually move precious metals.
1. The FED MINUTES are to be released Wednesday and Thursday is the Jackson Hole mtg. Pop or drop?
2. We also have what should be another Rate Cut in September. Pop or drop?
3. Will any of these be a catalyst to continue higher- or could they be a ‘sell the news’ event?

.
I remain very Bullish on the Precious Metals sector, it is just the short term that needs to reveal its intentions. It could do that by starting to move in 1 direction or the other around the time of the Fed minutes, Jackson Hole, or the next fed meeting. I’ll discuss a few more ideas a bit further at the bottom of this report. For those looking at other trade ideas, the General Markets & Oil have honestly been choppy, but there are some ‘set ups’ that could play out bullishly. Shippers are popping, we have discussed Bullish Solar stocks, etc, so I may point out some of these set ups in future reports, and I could throw a couple in below too.
.
We have a lot to watch going forward, Enjoy your Tuesday trading!
.
~ALEX
.
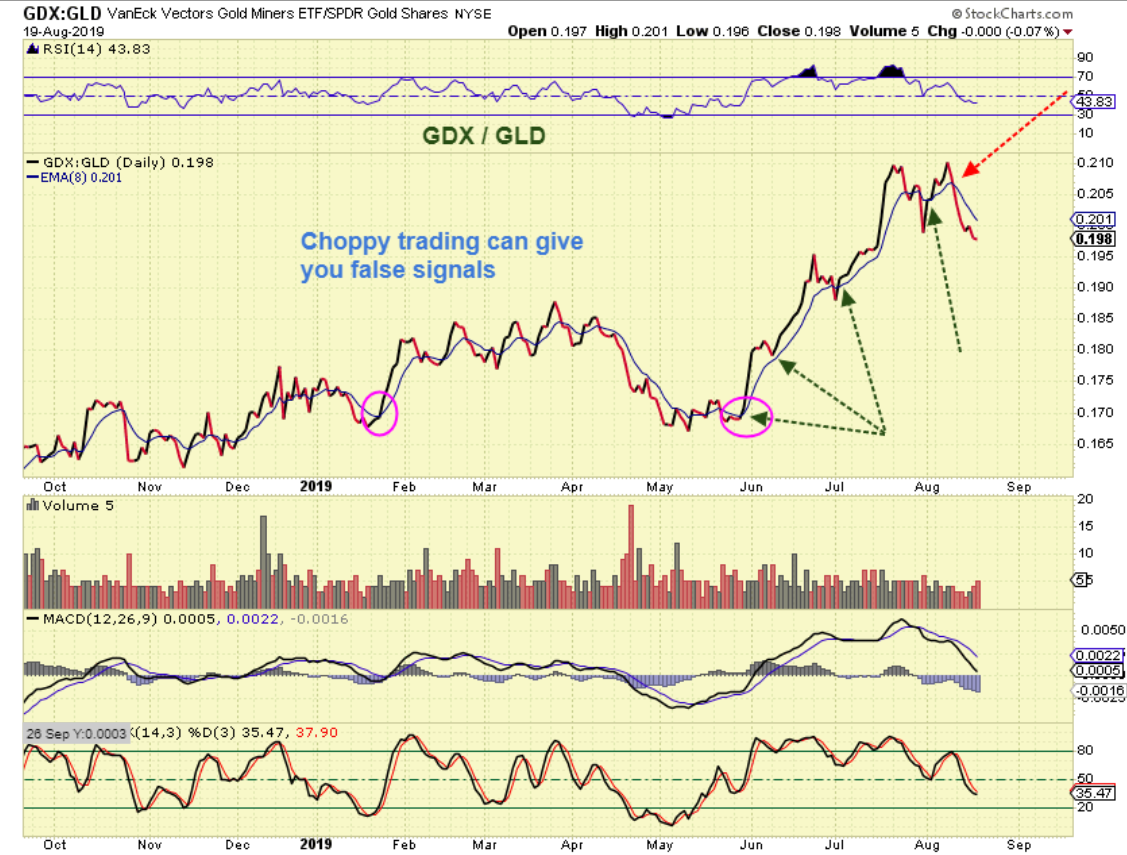
THIS IS THE CURRENT GDX & GLD RATIO – Miners are still leading the sell off lower, it has not turned up.
.
A FEW GDX & GDXJ IDEAS THAT I HAVE BEEN WATCHING FOR WITH MINERS
.
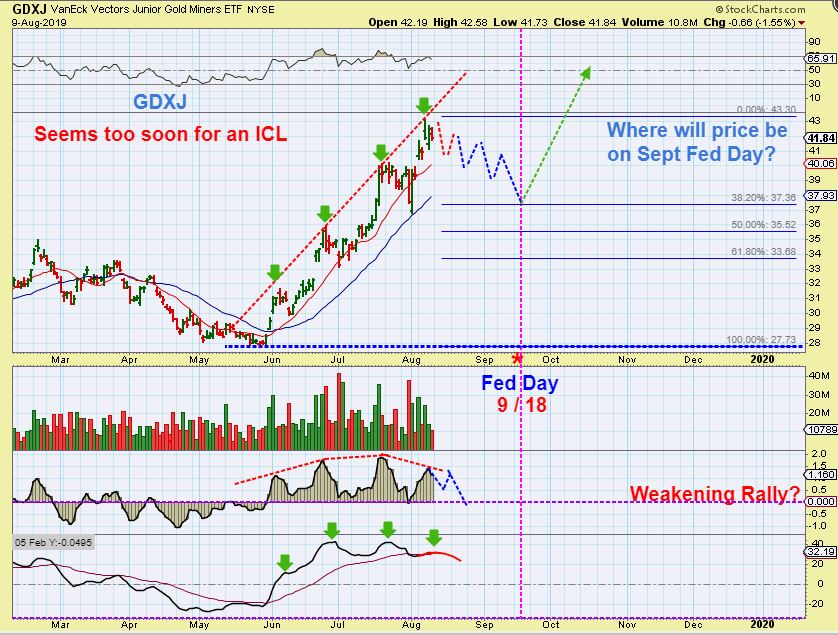
GDXJ – On Aug 14 on day 9 I posted this chart, so now we would actually be on day 12 if that Fed slam was the DCL. We would be 21 days from the Fed day, and a 30+ day daily cycle is very possible. This idea would put a dcl on or around the Fed day.
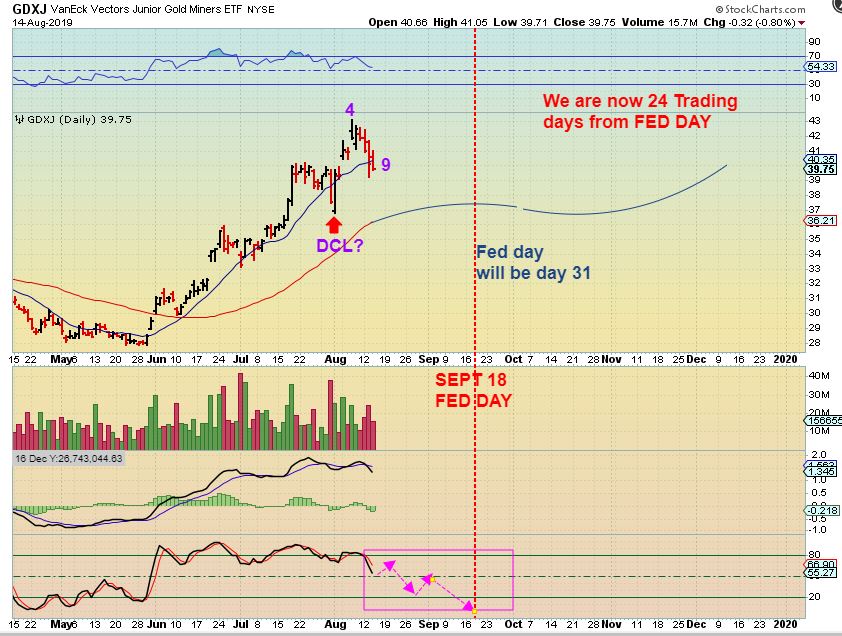
GDXJ CURRENTLY– So this tag of the trend line would now be on day 12 if that Fed slam & reversal was a DCL. THAT MEANS THAT THIS COULD BE A 1/2 CYCLE DIP ON DAY 12. IF IT IS, the Fed Minutes or Jackson Hole coverage could lead to a move higher, and possibly then a ‘peak’ & drop to a dcl after the Fed Mtg. Let’s take a look at what this would look like…
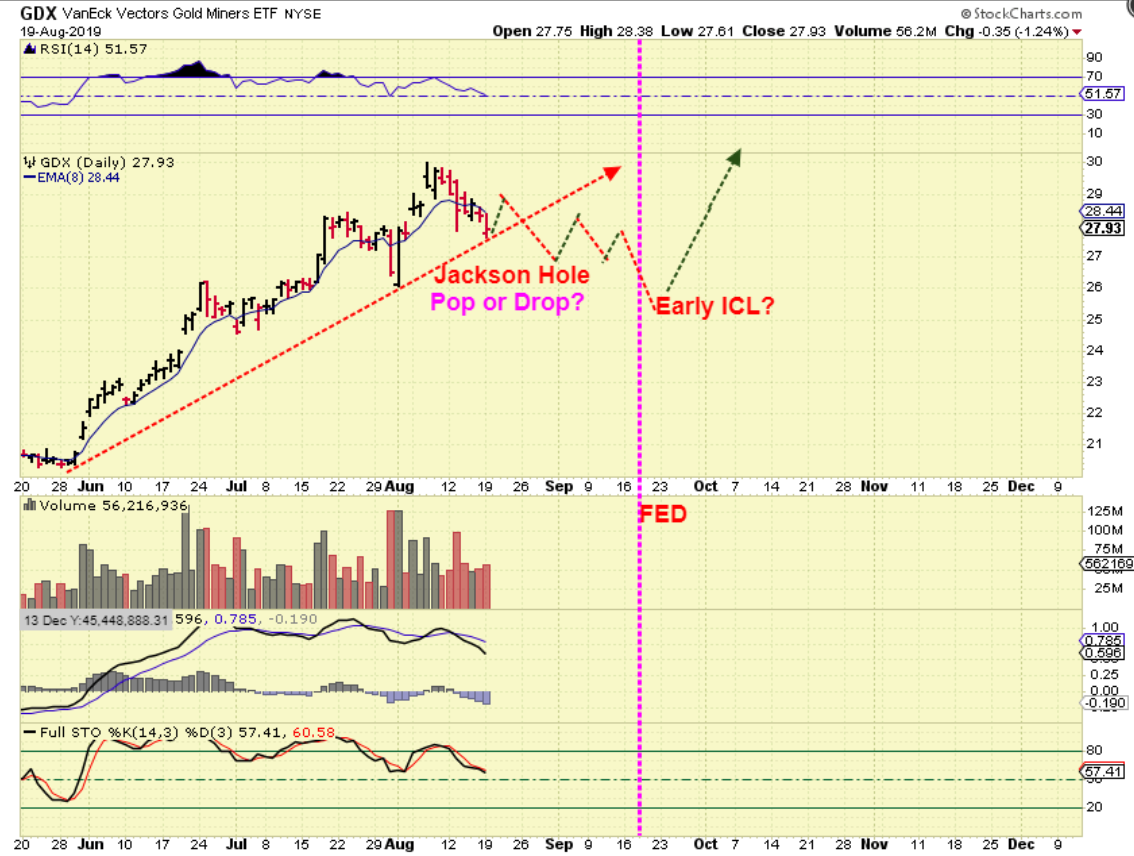
GDX – It may look a little something like this, so we want to watch the next couple of days and see if GDX / GDXJ look to be strengthening? I am also looking to see if we see GOLD selling down ( lets say $10-$15), while GDX holds up? That could be Miners bottoming first with this as a 1/2 cycle low. IF NOT…
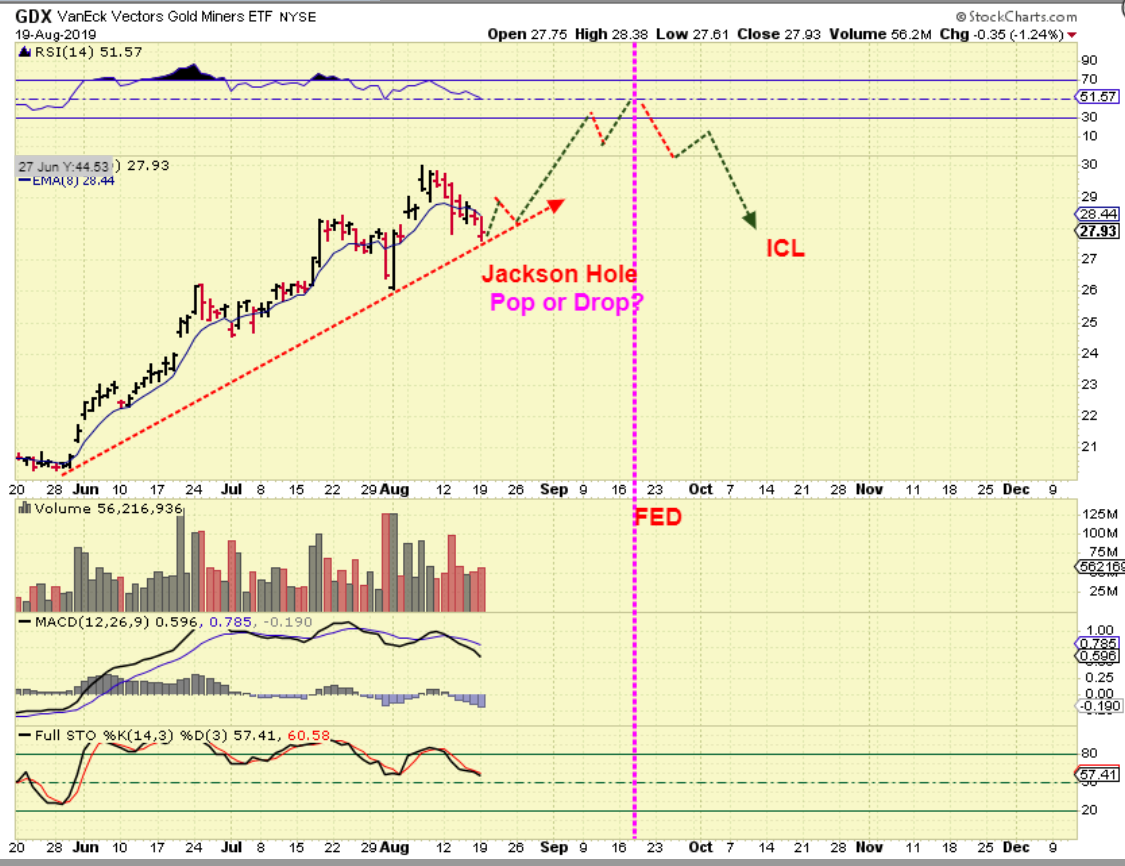
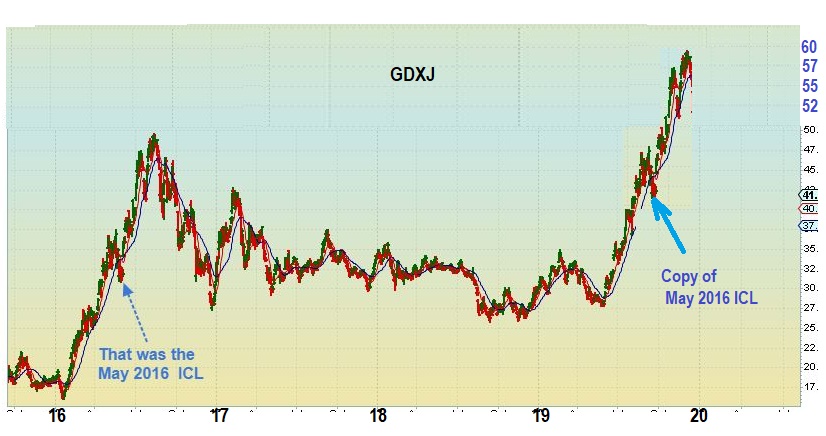
GDX – We could sell off with Fed Minutes/ Jackson Hole, and form an ICL 4+ months after the one in May.
.
GDXJ – So I mentioned that it could simply become a choppy ride lower over the next few weeks, and if it is, I will start putting the Fib Numbers in the charts for price targets to look at as possible buying opportunities if price reverses there. …
.
THERE ARE STILL MANY POSSIBILITIES WITH THE CURRENT SET UP – We have had a great run from the May lows to the recent peak, and we caught every bit of it, but now as this run possibly starts to get choppy or maybe even a bit toppy, we just have to be alert to various possibilities. Another ICL will form in time, and another strong run will likely unfold, so we will catch that move too. For now we want to hold our gains and try not to over trade the set up. That can be difficult.
GDX – And of course, the encouraging BIG picture remains very bullish, no matter how choppy this short term move becomes. 🙂 Don’t allow the choppiness to bother you, we could simply be at one of those choppy sideways period that leads to another run higher.
.
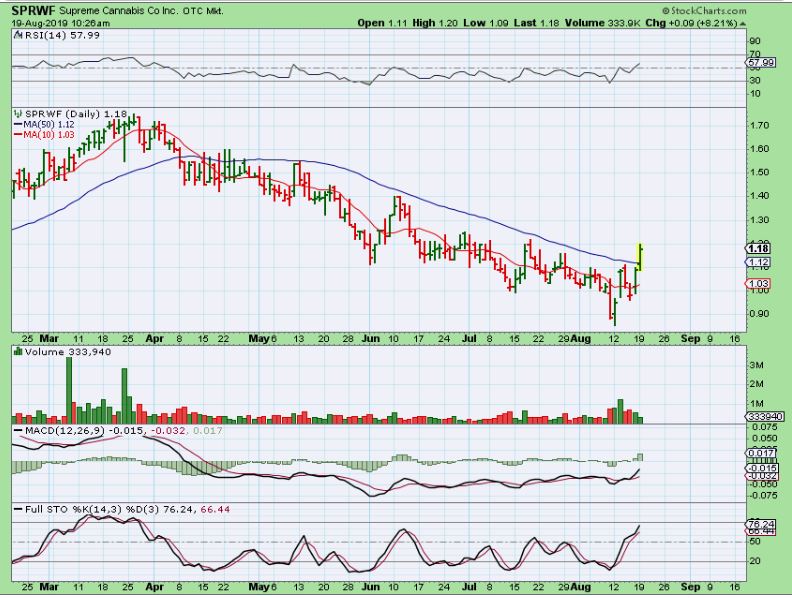
SPRWF – I mentioned buying this last week, and yesterday it broke the 50sma. They reported good results and are being rewarded for that. Several MJ Stocks look to be setting up/ bottoming.
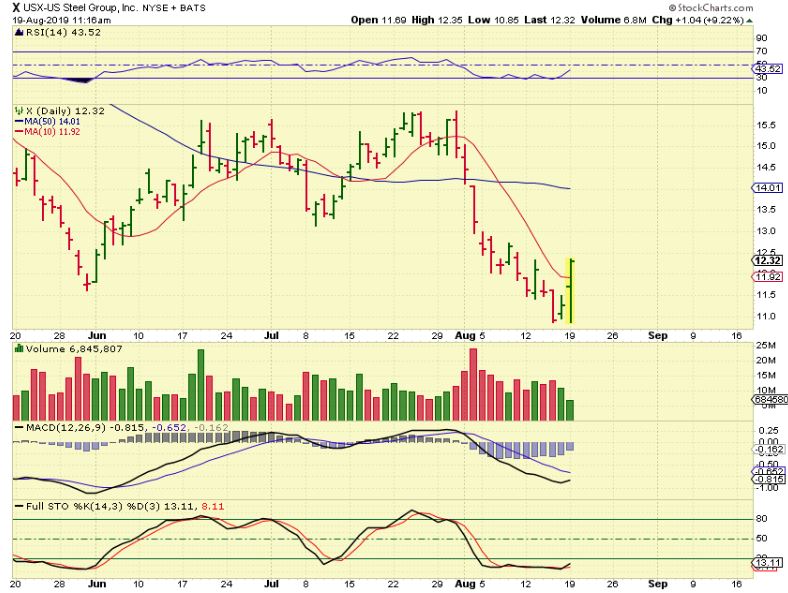
X – Suddenly yesterday, X, AKS, CLF, CENX, AA, and other ‘Metals” stocks popped and started to move higher, so this is another sector that may start to shape up.
.
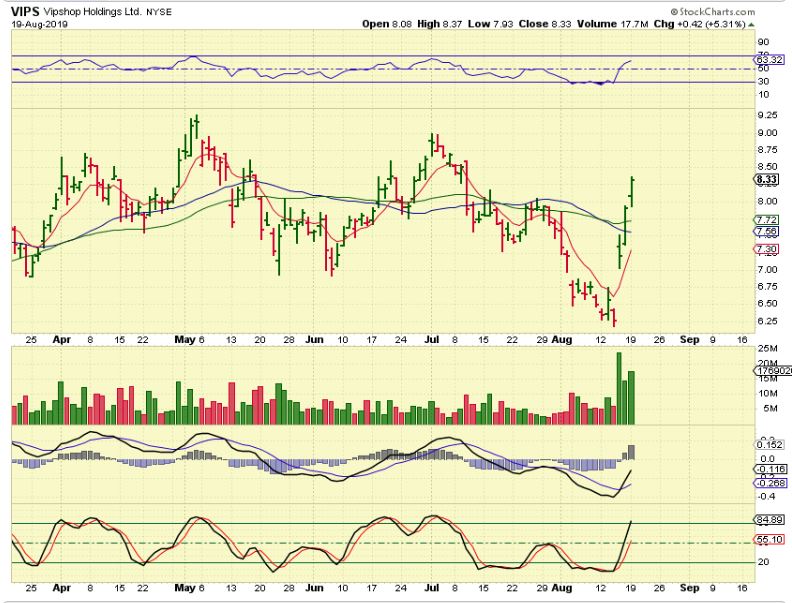
VIPS – And many of the Chinese stocks are perking up too. I mentioned VIPS last week, but also see charts of HUYA, IO, etc etc.