Tuesday July 9th
SPX – As time moves forward the SPX still remains healthy looking. It has stalled again, but if it moves higher we will likely see a R.T. Daily cycle, and that would keep things on the bullish side. My weekend report discussed ‘break out to new highs’ and various ways they play out. For now, if you are long, you are still in the trade, stop at the 1/2 cycle low or raise it to the 10sma if you are more comfortable with that.

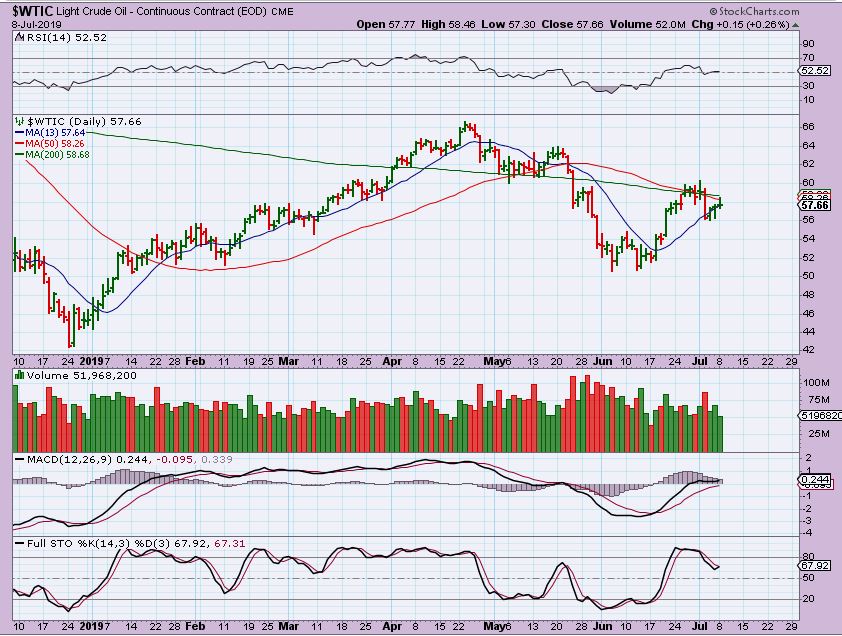
WTIC – No major change yet from resistance ( Oil inventory release is on Wednesday Mornings Eastern Time).
.
REVIEW & CLARIFY – I read my weekend report and I thought I was pretty clear about the Big Picture. I see Bullishness. I discussed possibilities going forward to show what I am looking for. I will quickly review my thinking .
.
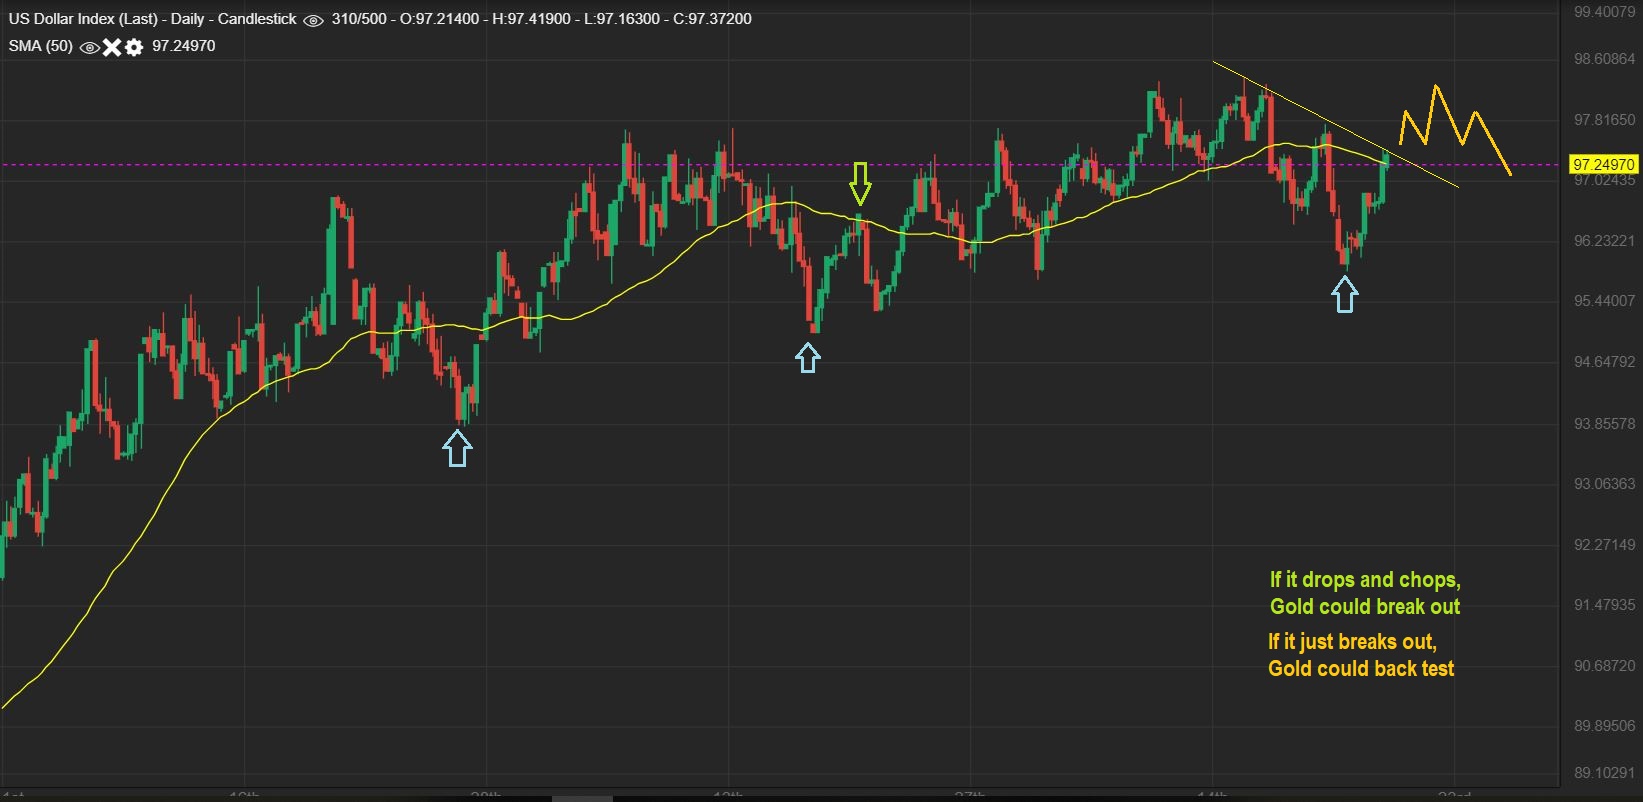
USD – A back test on Golds break out is possible, since they do happen often. Also, the USD may have put in an ICL & could run higher, so I showed how GOLD COULD DO THAT BACK TEST. I said that it is NOT necessary, but possible. I’ll review. Read the USD chart…
.
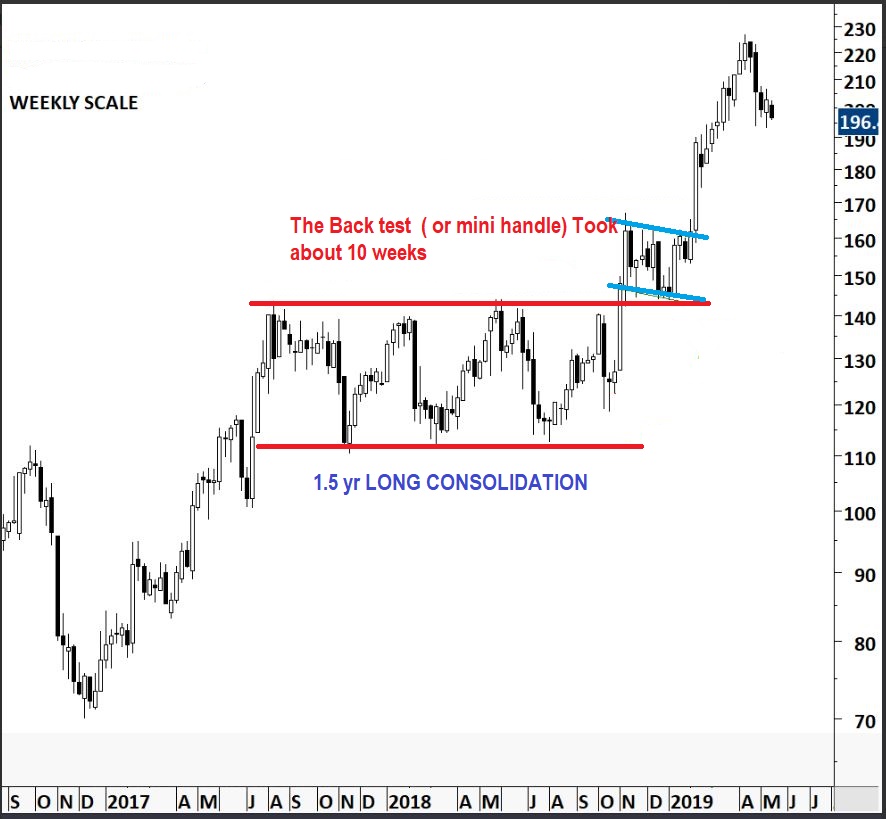
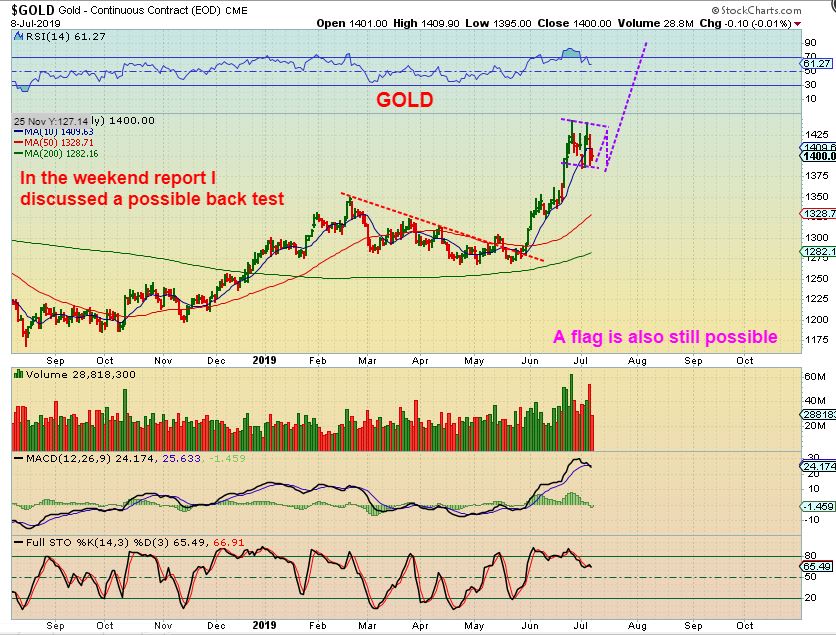
This is a chart that I used to represent a pull back in Gold for the weekend report. It showed a back test that took weeks and I pointed this out in case Gold remains choppy. So Gold MIGHT stall & could do something like this.
.
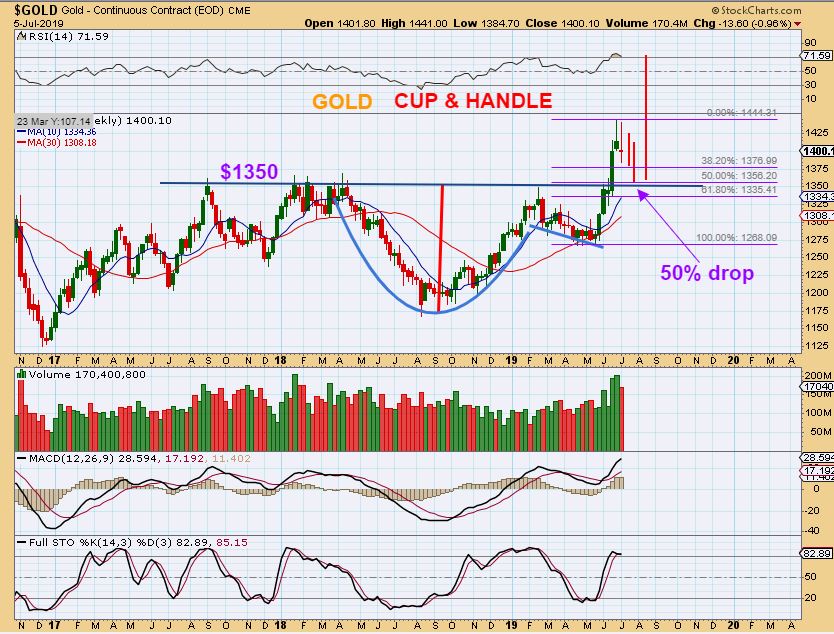
GOLD -I drew it this way.
.
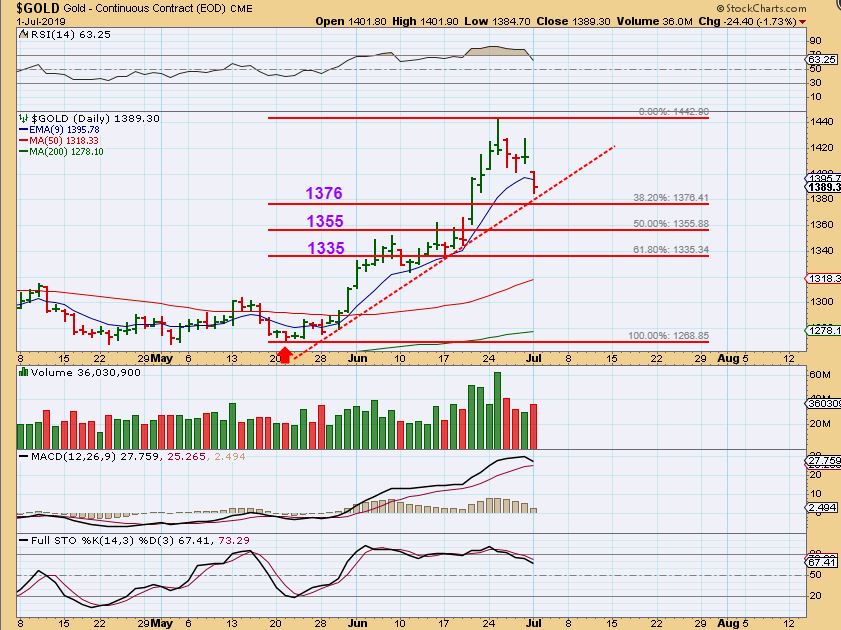
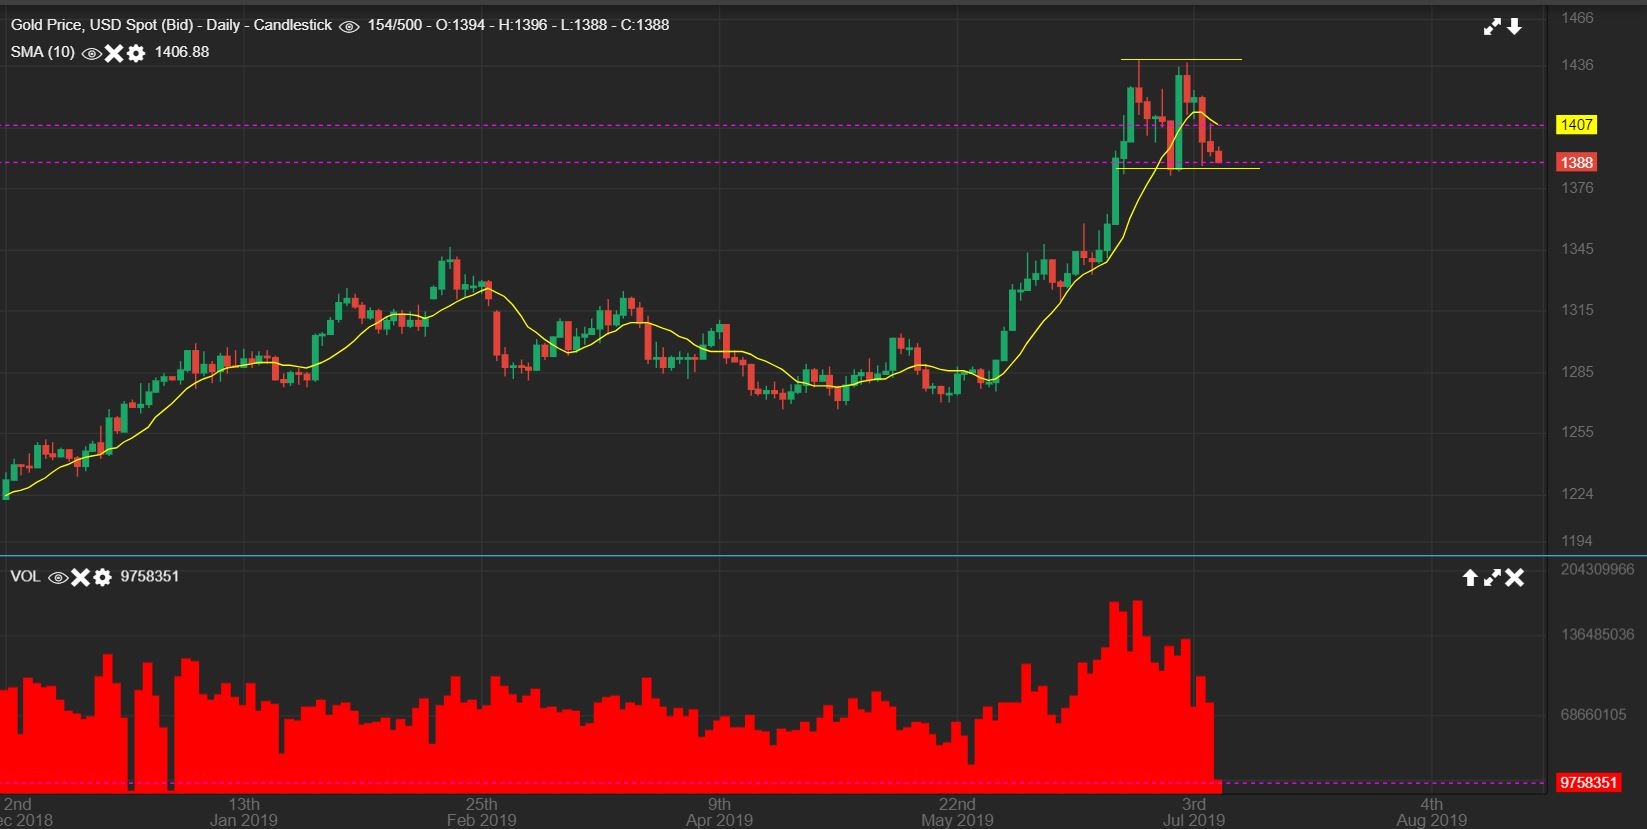
GOLD – We do want to keep in mind the FIB Numbers that I mentioned on this chart and the one above. $1376 & even $1350ish are normal pull backs too.
GOLD – At the same time, a consolidation can be a flag, a box, a pennant, etc. You may just see this and Gold could take off at any time. STAY FROSTY…
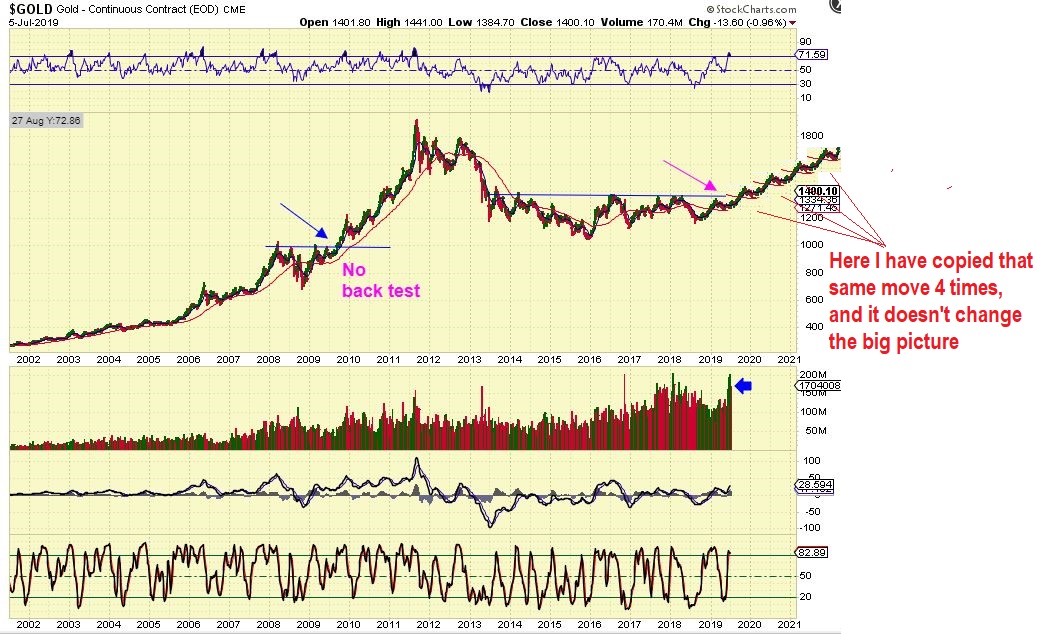
I also used this chart & briefly mentioned that on the left side (2008) Gold did NOT have that kind of a back test after breaking out.
.
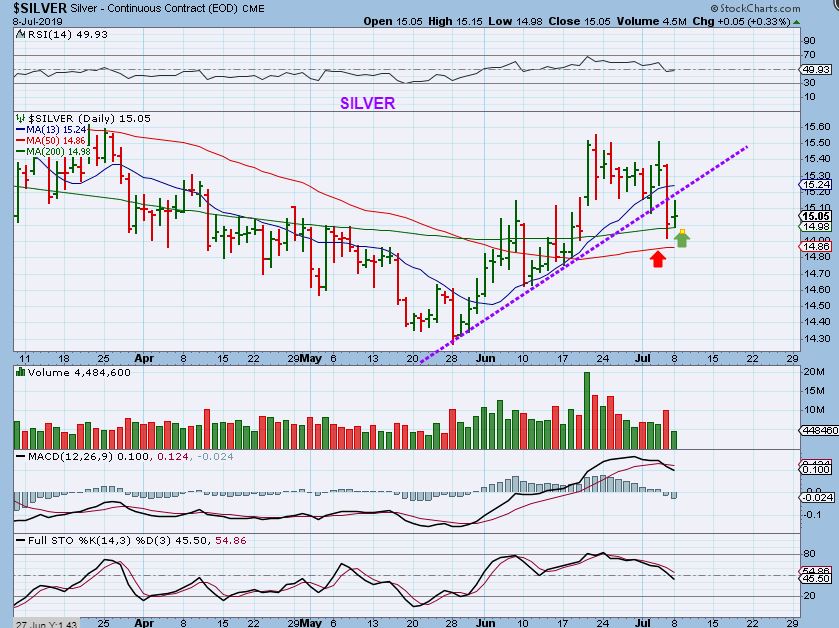
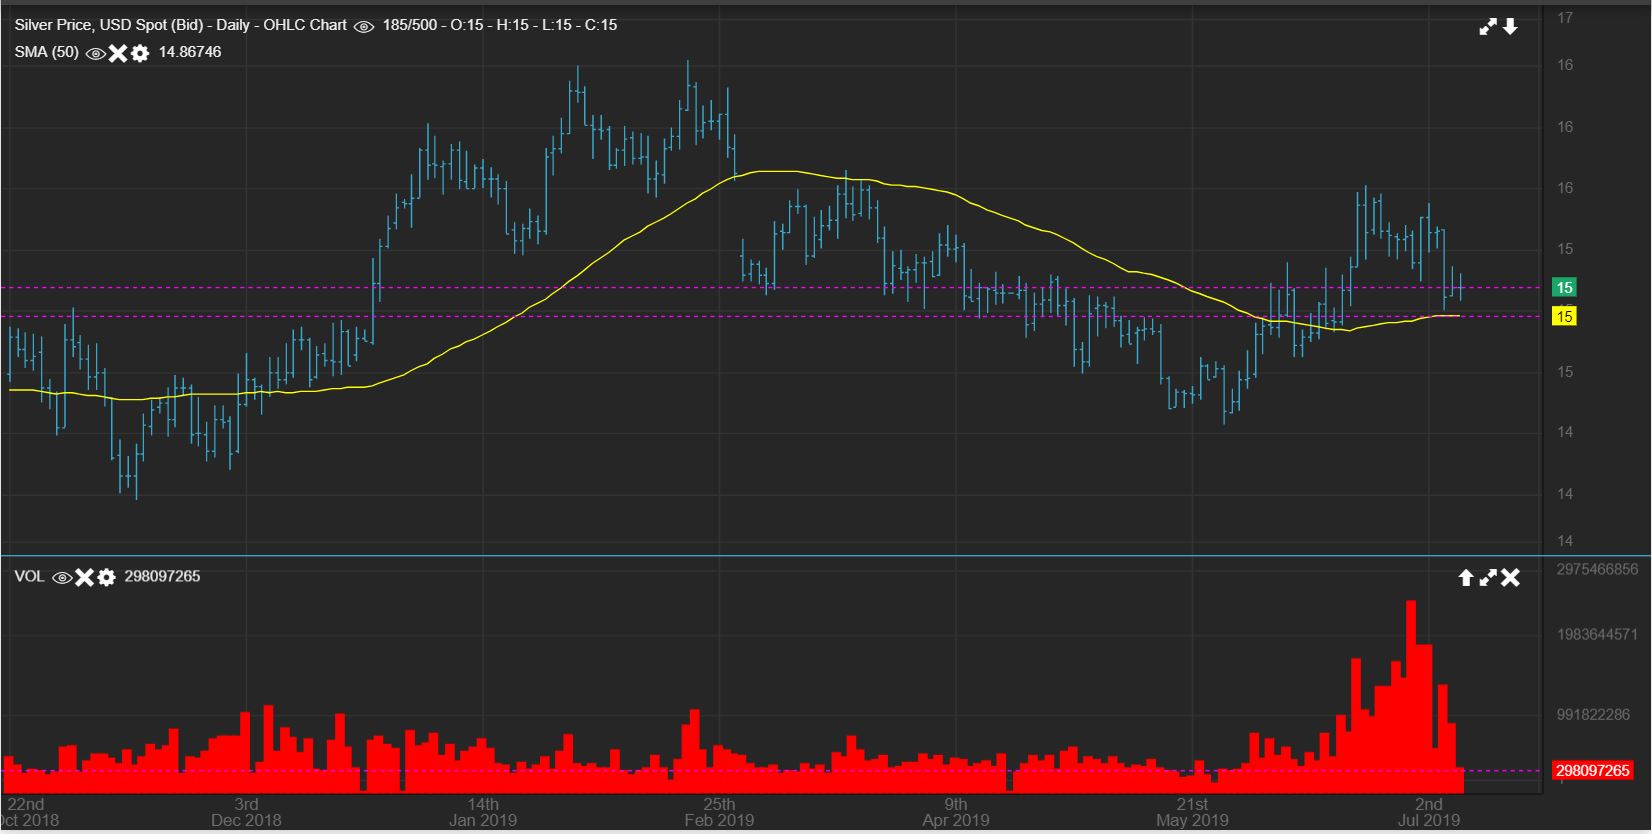
SILVER– Honestly, Silver crashed Friday and looked weak (Thankfully, most silver stocks ignored that completely). At least it is above support and was Green Monday when Gold was down, but it really needs a better sign of strength soon. It should NOT lose the 200sma in my opinion. With all of this, many Silver stocks look Bullish, so that is good.
.
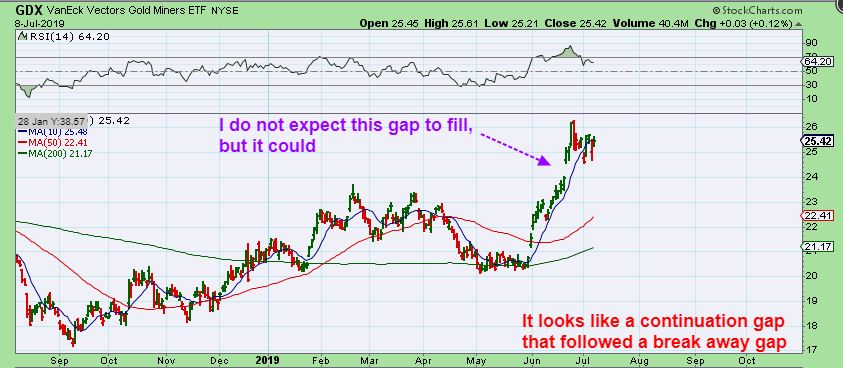
GDX #1 – So looking at GDX, I have mentioned also that this gap does NOT have to fill. It could, but it doesn’t have to. I have seen this in the past as a ‘continuation gap’ and they do not always fill.
.
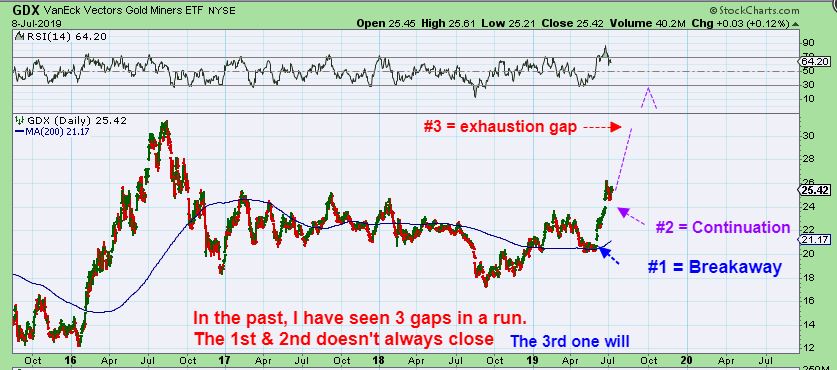
GDX #2 – This is how I have seen this play out.
1. We get a Break away gap, a strong burst higher that does not fill.
2. Then a continuation gap shows the Bull continuing to leave people behind. Now those waiting to buy that dip try to buy the gap fill , but they may get left behind again if that gap doesn’t fill.
3. A FINAL GAP is what I am watching for….the ‘exhaustion gap’. Heads up: That is always my sell all leverage signal, just to be safe.
.
GOLD – RETURNING TO GOLD & THE POSSIBLE FLAG, PENNANT, BOX CONSOLIDATION DISCUSSION …
.
SOME MINERS MAY BE LEADING THE WAY HIGHER…
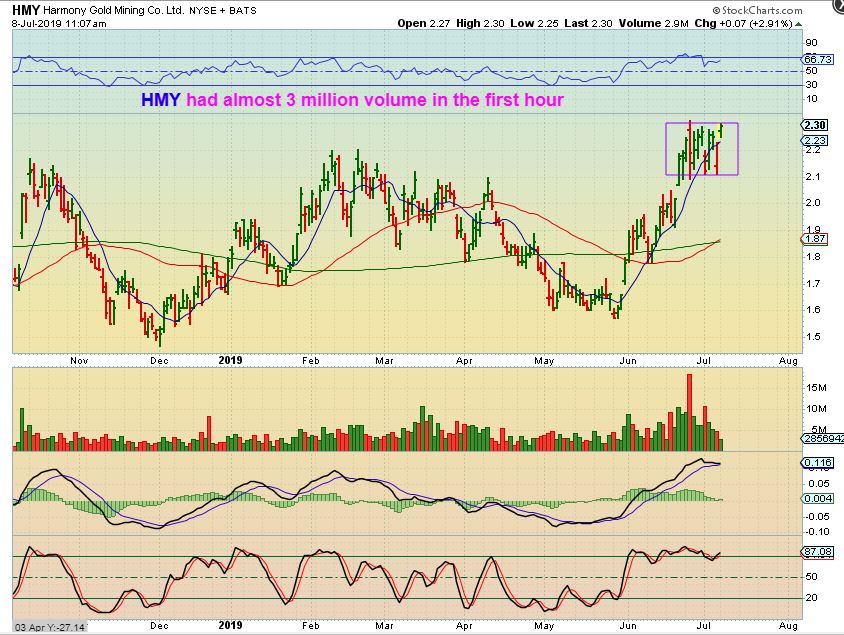
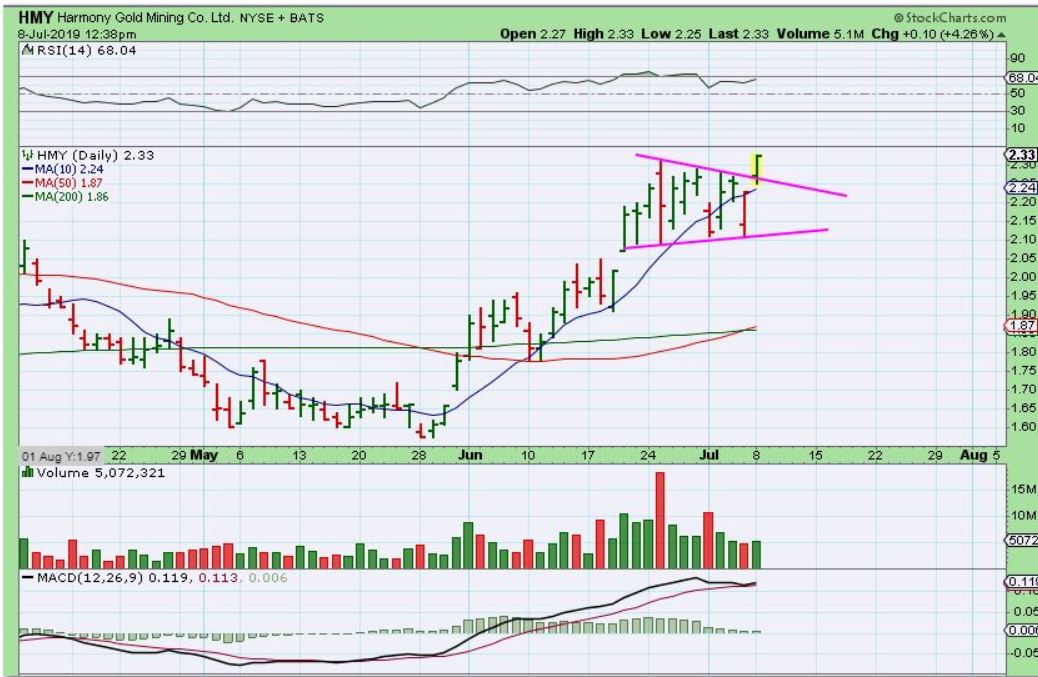
HMY – I saw Volume creeping into HMY Monday morning, so I posted this chart live a little over an hour after trading started. This looked like it was going to break from the box with good volume.
.
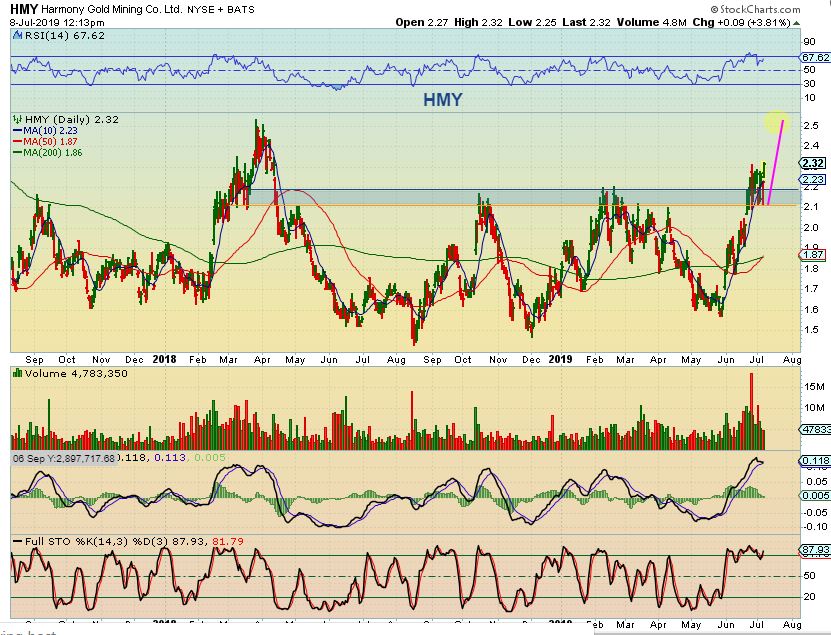
HMY – An hr later, I drew this to show the bigger picture and also that a quick 10% from here could be added on as it runs to 2018 highs.
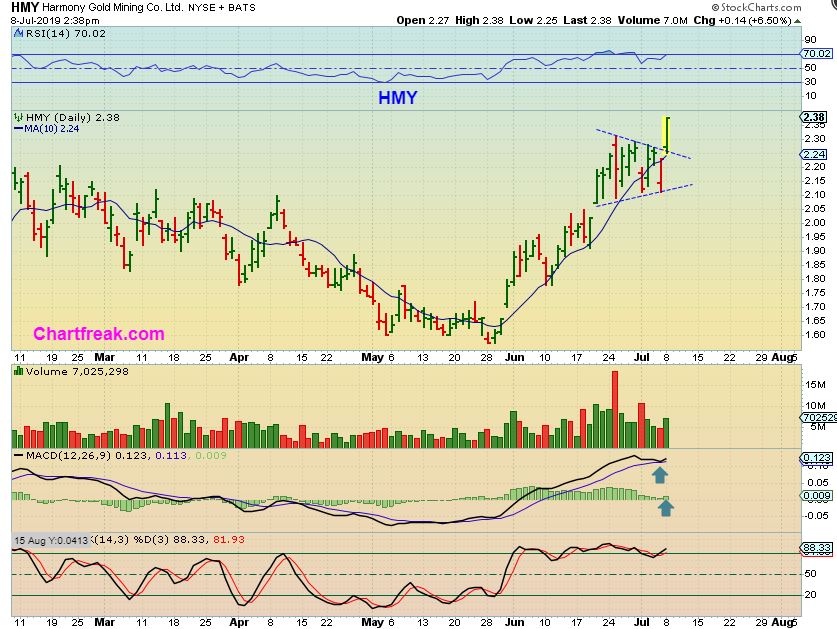
HMY – I also drew it like this and notice that at midday the Volume midday was as big as it was on an average day already (MACD turning up too). Bullish 🙂
HMY – As the day went on, HMY was up over 6% and this looks to be that valid break out. THIS IS WHAT I MEAN BY SAYING THAT GOLD MAY JUST FLAG & BREAK OUT.
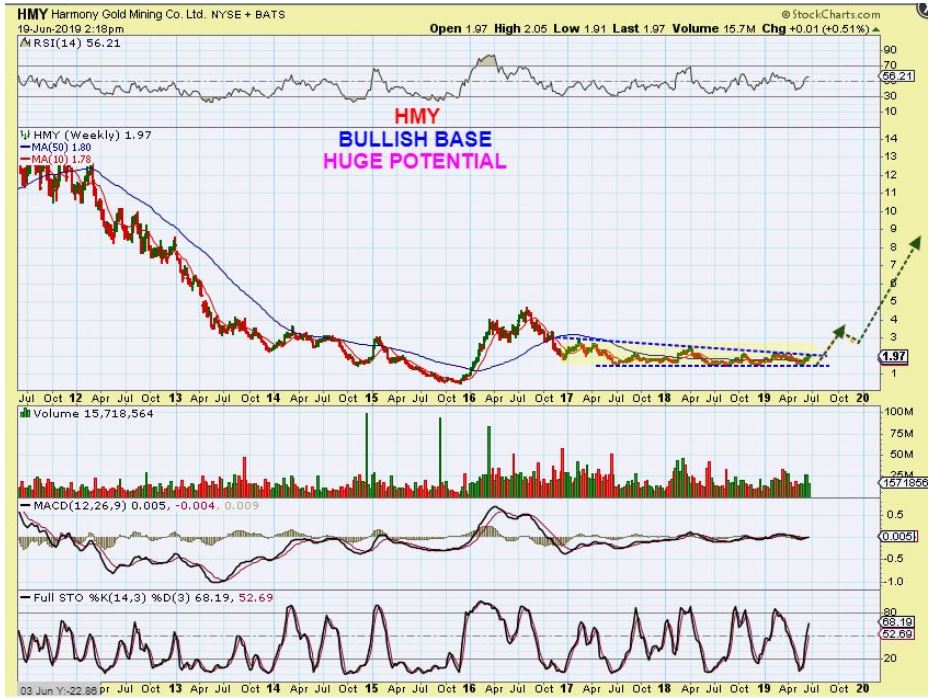
HMY Big Pic from June 19th- Of course, the BIG BIG PICTURE shows great potential for HMY is not just 10% higher in the long run.
.
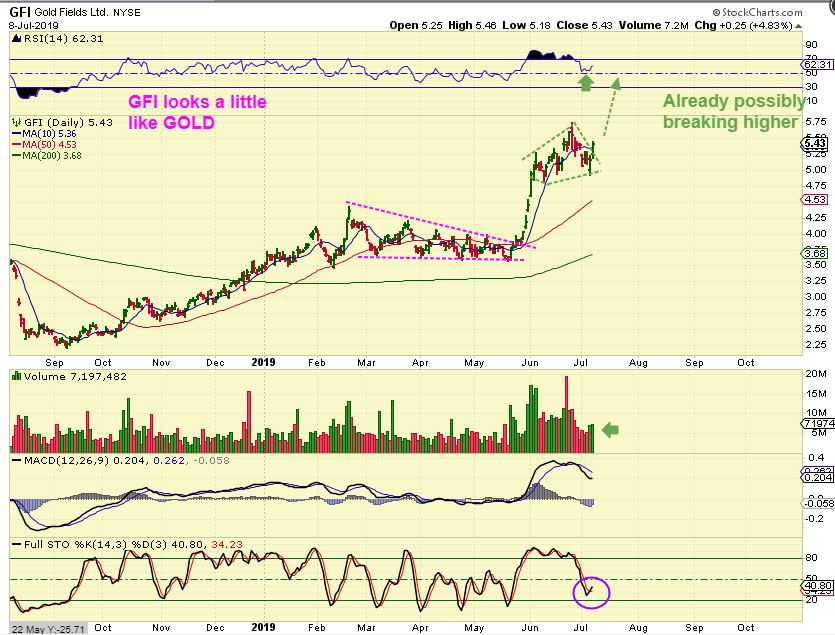
GFI – I also mentioned GFI & AU Monday. This is a bit of a sloppy choppy consolidation, but the run higher was straight up, so that is fine. It started to break above the 10sma & a downtrend.
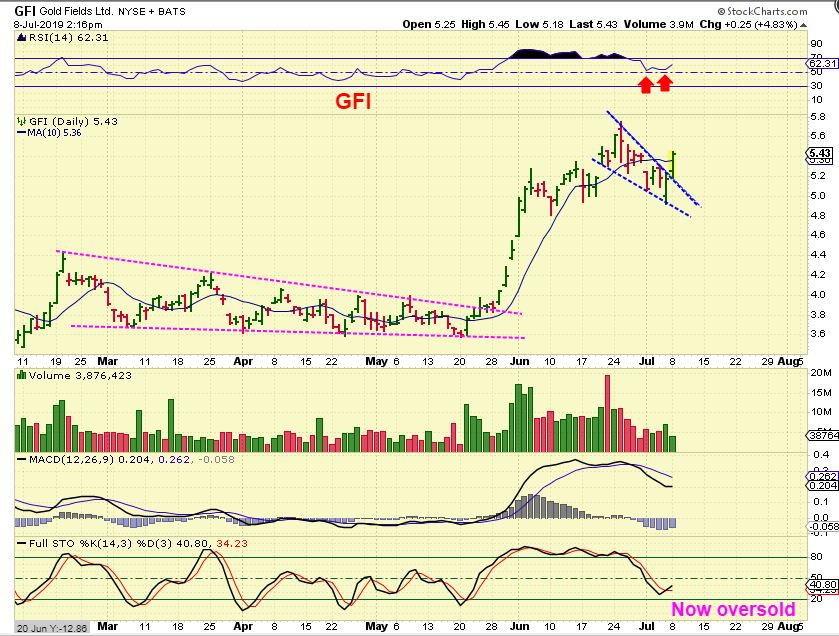
GFI – A break out from here often leaves this consolidation behind as a midpoint pause. This has 3 gaps below that may not fill for years .
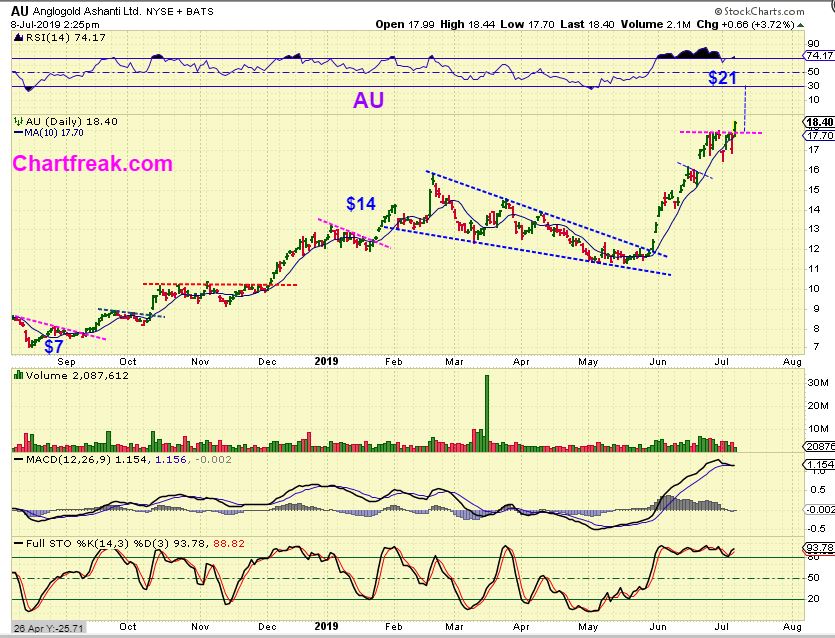
AU – AU also looks like it wanted to break out and volume was pretty good…
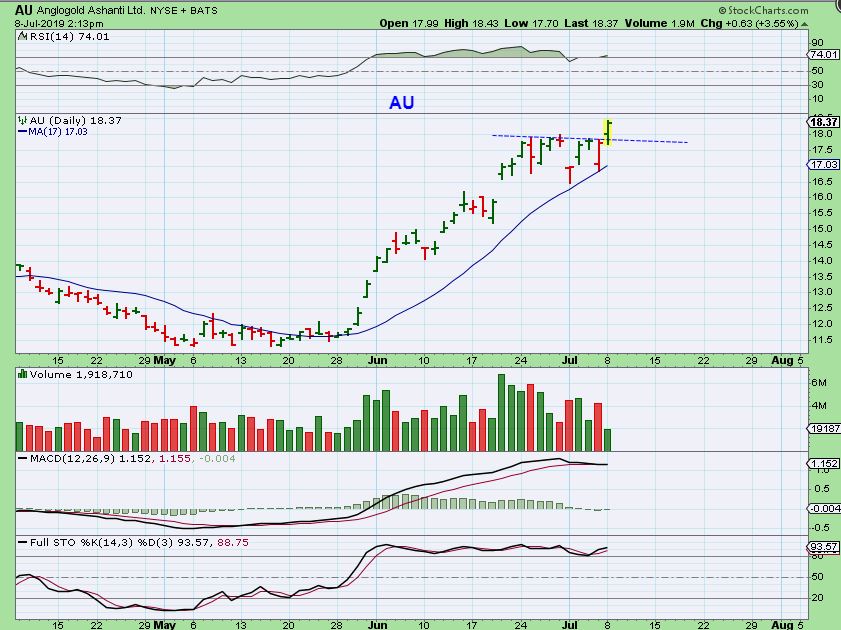
AU – AU has almost tripled from the ICL in Aug 2018.
.
As we have seen recently with KL, AEM, DRD, AU, TRX, MAG, etc – some miners can take the lead early, so yes, that may be happening here. Another idea though, is that this also may be indicating that Buyers are stepping in now and with Miners leading the way, GOLD may begin to climb very soon out of its flag-like consolidation too (instead of that back test).
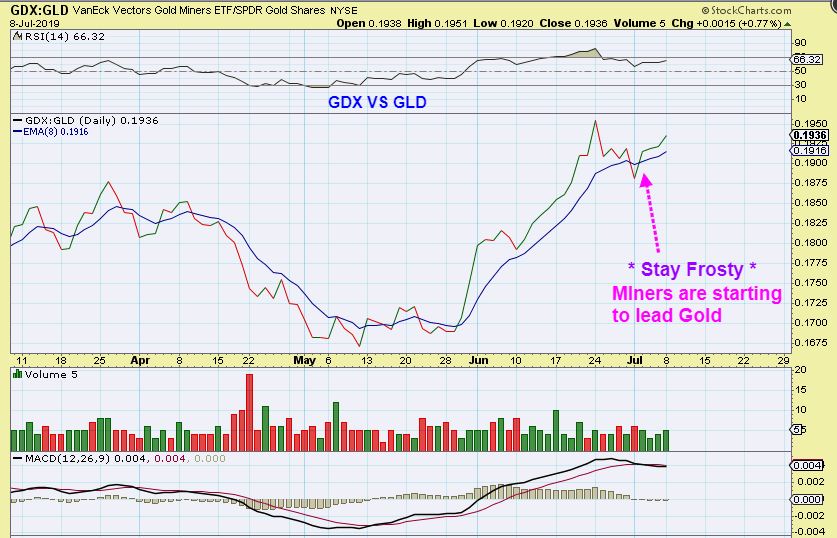
GDX / GLD RATIO – MINERS ARE STARTING TO LEAD. Gold can drop & Miners can hold up better.
.
These things take time to play out, so I look for clues along the way ( That is what analysis is), and things are still looking very good. As I have been saying all along, you really don’t want the wiggles & consolidations to rattle your nerves and cause you to bail out & sell your positions. I’m all for locking in some gains, trading a few extended positions, and so on, but going to ‘all cash’ in a bull run and trying to buy the dip can make it very hard to re-position if they just go sideways and suddenly up and take off again.
.
You can trade them or pocket some change, but you always want to own something. Let’s see what Tuesday brings our way!
.
~ALEX
.
GOLD LIVE 6:30 a.m. Eastern Time – Gold is showing up as down $8, and this is what it looks like so far. Will this area hold? Or do we drop even lower to a Fib Number ? We’ll see what Today brings in this sector.
.
SILVER LIVE shows silver only down 4 cents. If Silver holds above the 50 sma & Gold drops, that can be bullish for the SILVER vs GOLD RATIO
.
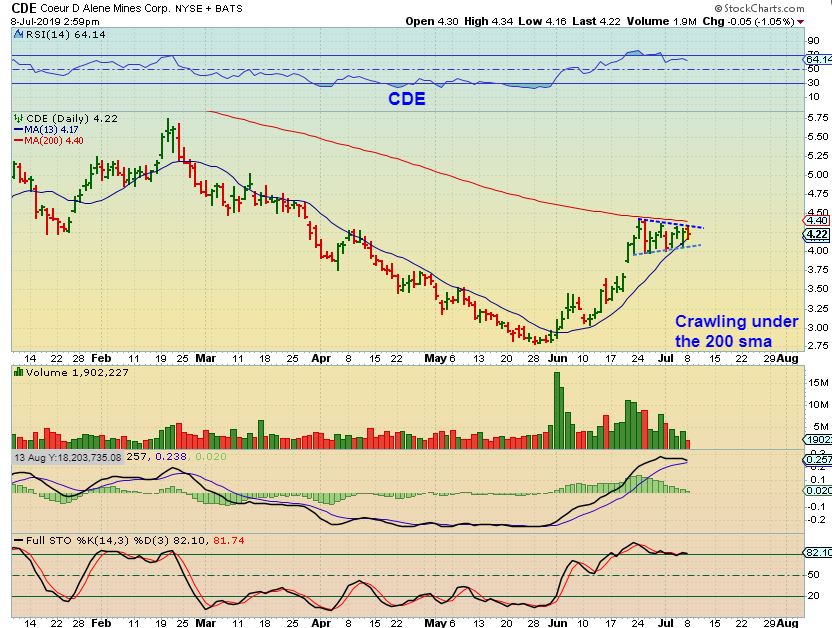
CDE – Yes, I’m showing CDE again 🙂 Why? Because this is that crawl under the 200sma that can also just break out at any time. You can buy it here, or buy the break out, but that is a nice flag. It is a Silver stock hugging the 200sma, when Silver is lagging.
.
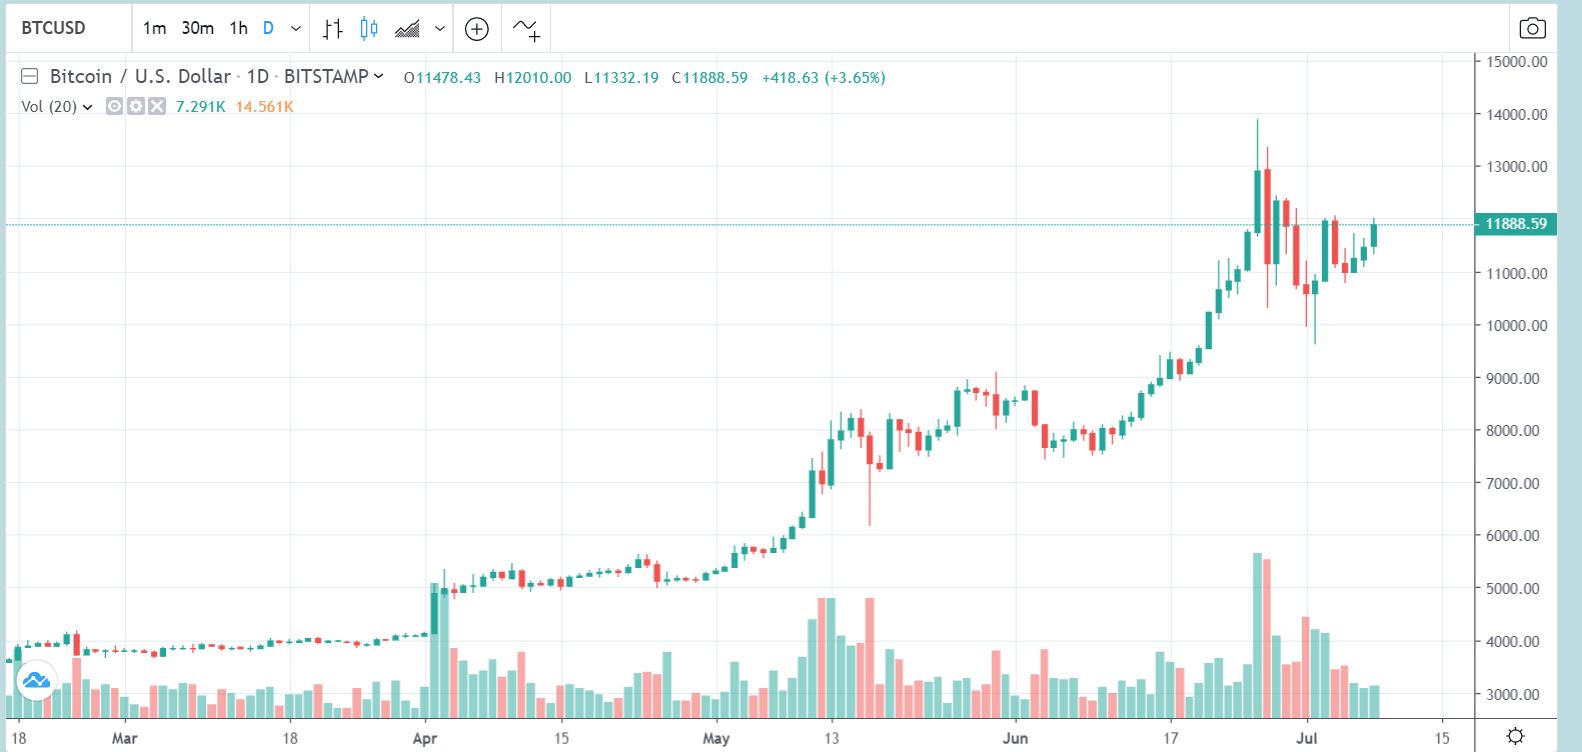
BITCOIN – Monday I tweeted out that Bitcoin has formed a Bullish consolidation too. Look how choppy Bitcoin got, but it is a Bull Run, so if GOLD gets choppy, try to remember this chart and not allow it affect your emotions too much.
.
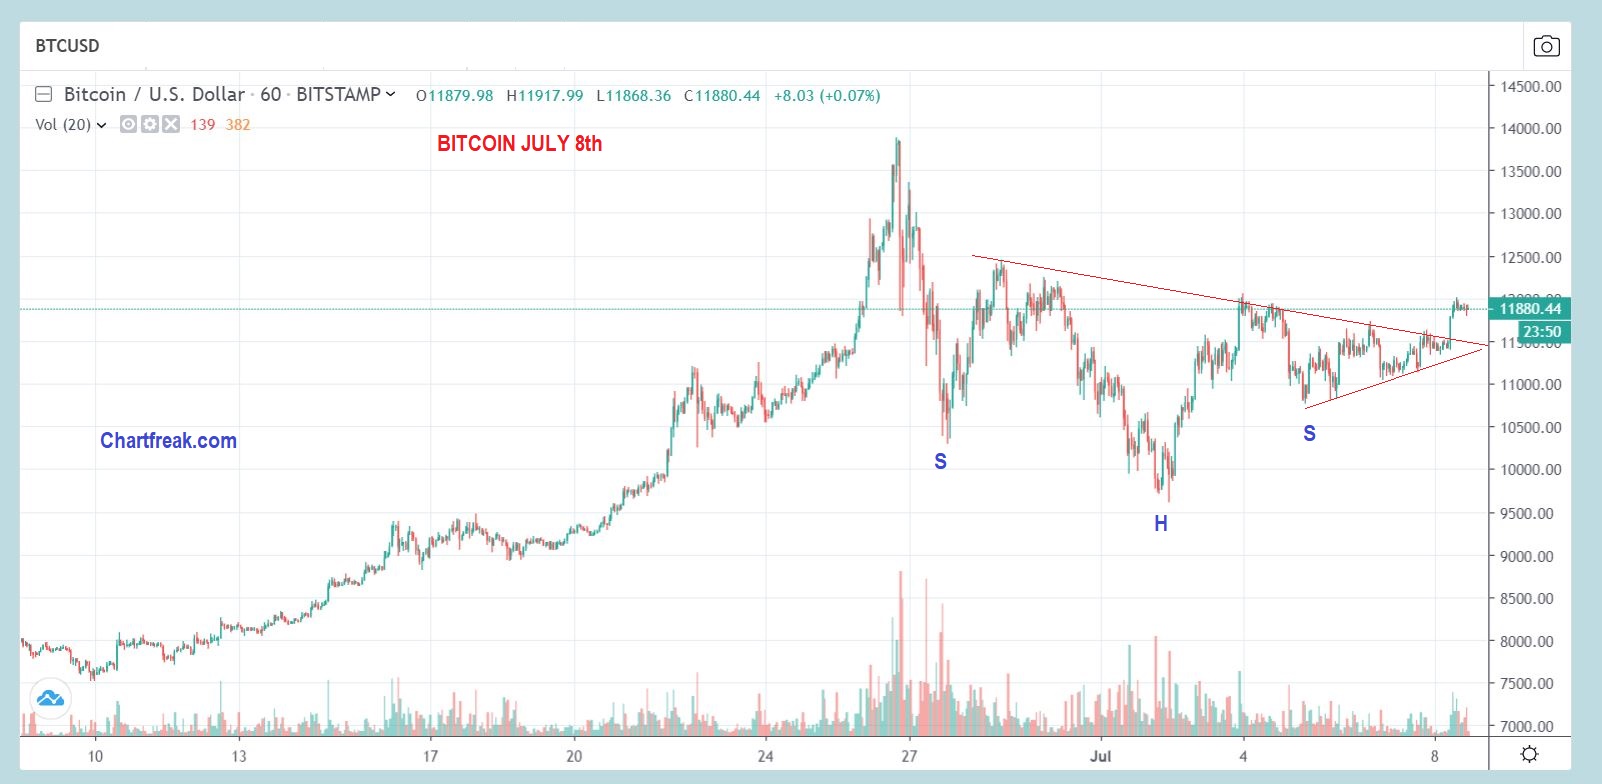
BITCOIN 60 minute chart – An Inverse H&S may be forming and broke out. Bitcoin looks Bullish here after another consolidation on the run to former highs.
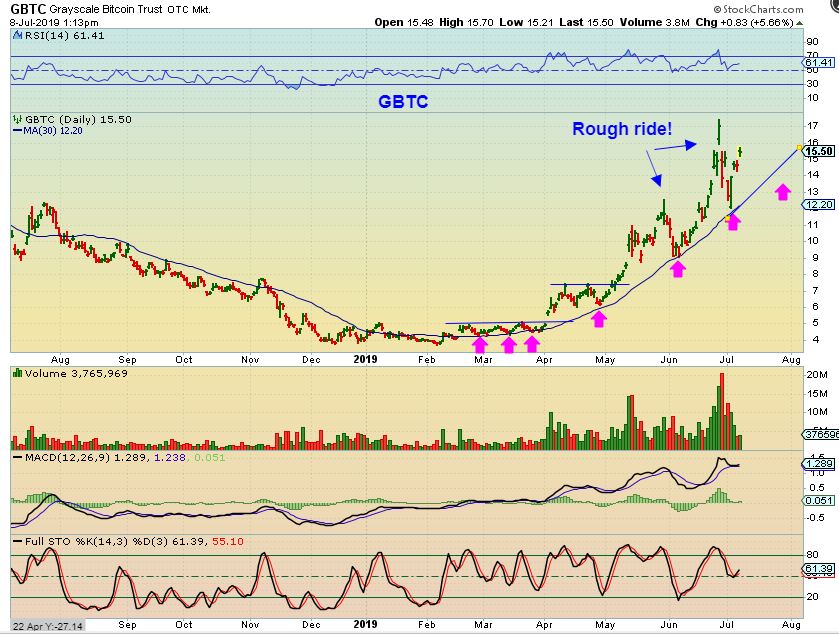
GBTC – Look at GBTC along the 30 sma. It has been a buy every time, even when price crashed down to it. This is certainly NOT an easy ride, June & July have been VERY DIFFICULT to buy & hold, but it has moved from under $4 to over $17 this year. It has been trade able.
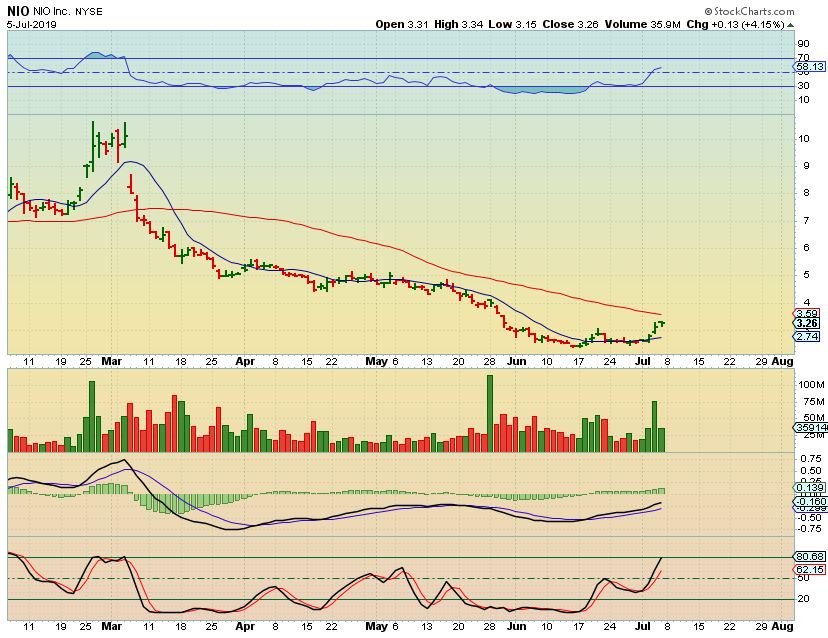
NIO – As a sidenote, NIO is the Tesla of China, and looks to have bottomed . I was going to post this last week in the live comments, but I didn’t and I didn’t buy it either. Monday it tagged the red 50sma. IF IT pulls back to the 10sma or flags & crawls under that 50sma, it is a buy. It actually is improving nicely.
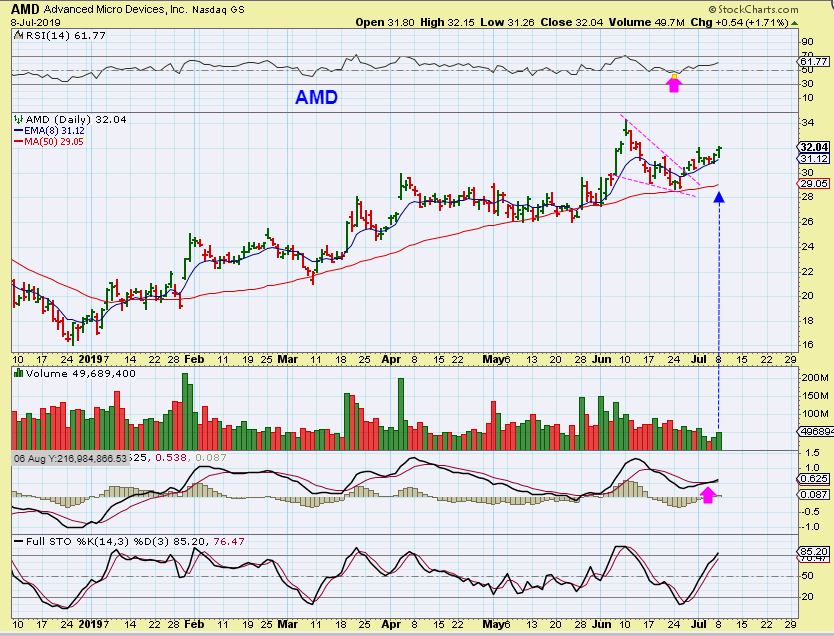
AMD – I have been recommending AMD for a while now. It is in a nice uptrend