
July 6th Weekend Wrap Up
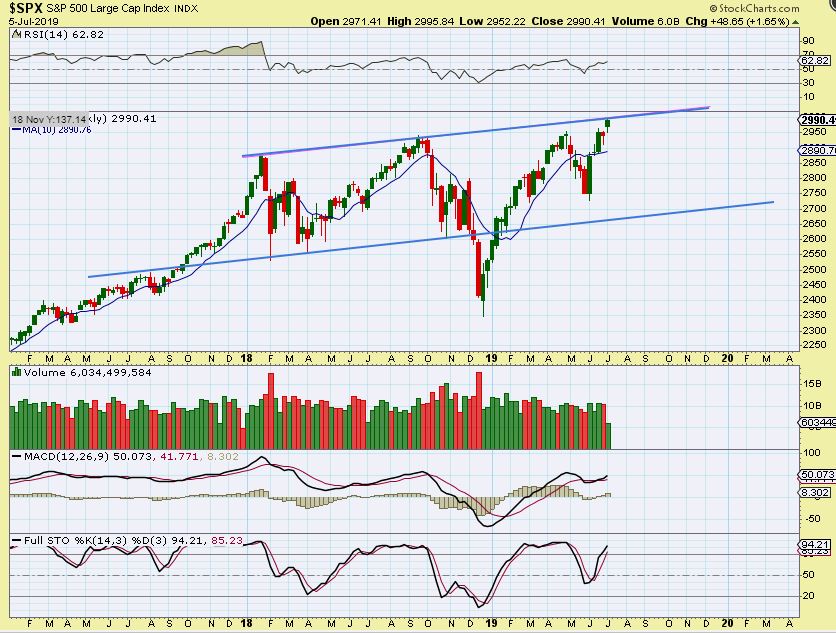
SPX WEEKLY – The SPX broke to new highs, but again has formed a topping candle at resistance. When I draw a large channel, it is right at the top of that channel. If you entered long and have been raising stops, that still has you in the trade. Many are Bullish again as SPX broke to new highs, so we may get a pull back. (Contrarian view) .
NAZ WEEKLY – The Topping candle on the NASDAQ WEEKLY is very similar to the one in April when the top formed.
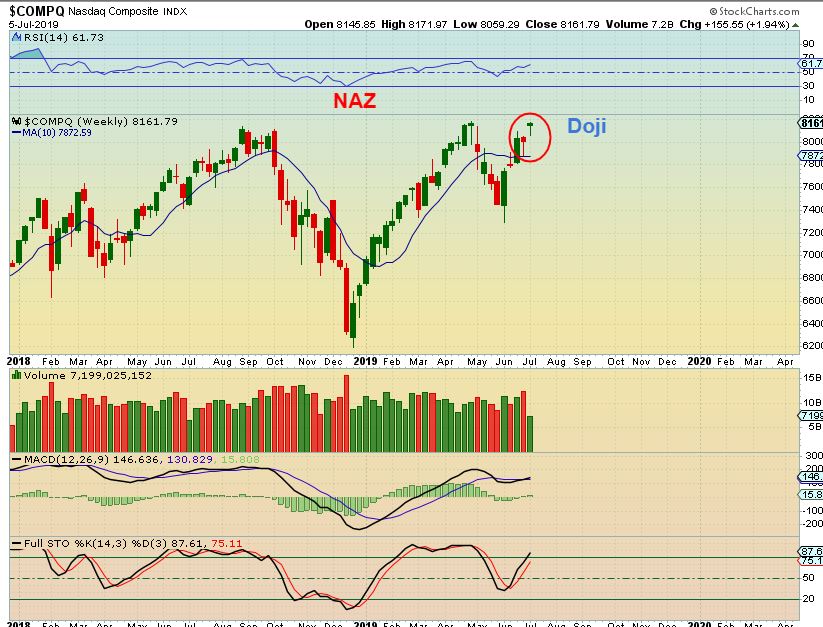
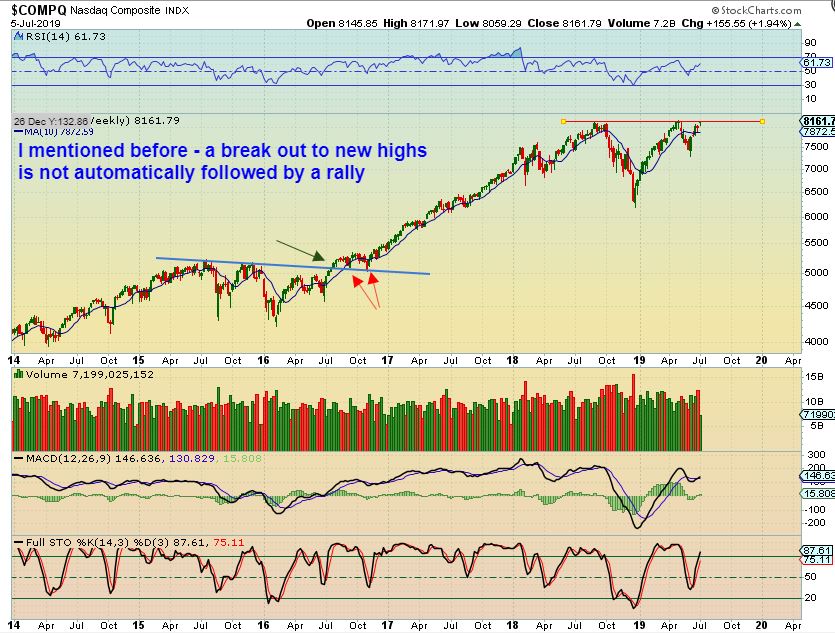
NAZ WEEKLY – It is also at an area of resistance. Read the chart and compare 2016 to the current run. New highs is not an automatic rally mode and currently there are several factors weighing on the markets progress. Next is the RUSSELL 2000
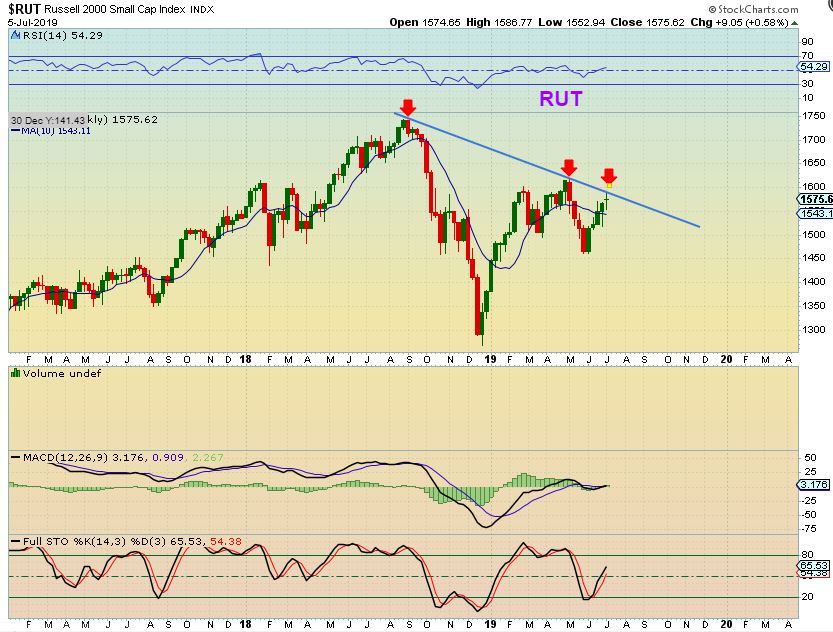
RUT WEEKLY – The RUSSELL 2000 has a doji right as it tagged resistance. The RUSSELL & TRANSPORTS have struggled compared to the SPX & NASDAQ, but this MACD still says that this could break out. We’ll see.
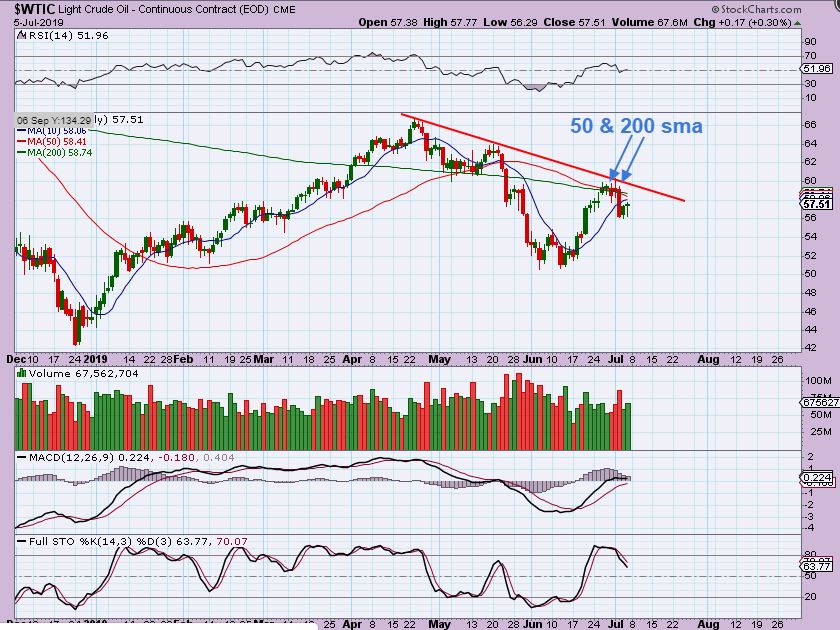
WTIC DAILY – Oil hit resistance and broke down too. This week we saw a bounce and that may be all that it is. IF you went long on this reversal, you need a Tight stop at recent lows, or raise the stop to ensure at least a small gain for your troubles in case it breaks down.
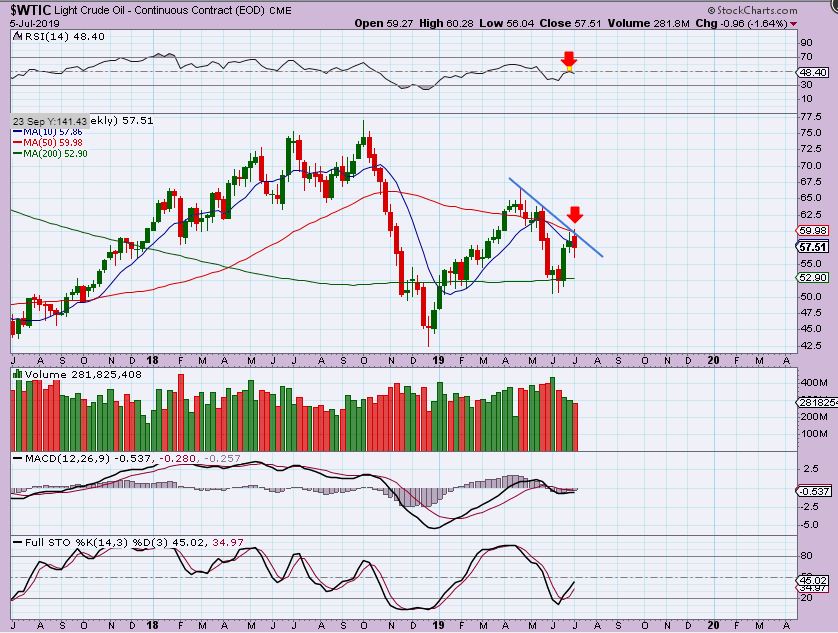
WTIC WEEKLY – Pushing on weekly resistance again.
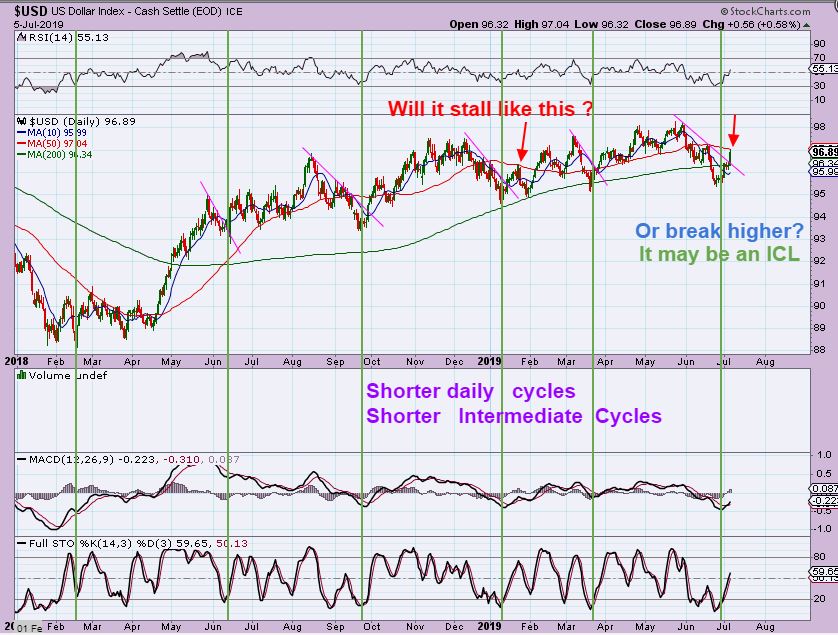
USD DAILY – The USD surged Friday, but has stalled at the 50 sma. Last week I mentioned that this COULD BE AN ICL, and Gold has stalled. The last several moves out of the ICL have been rather sideways and not super strong, but they do take time to play out.
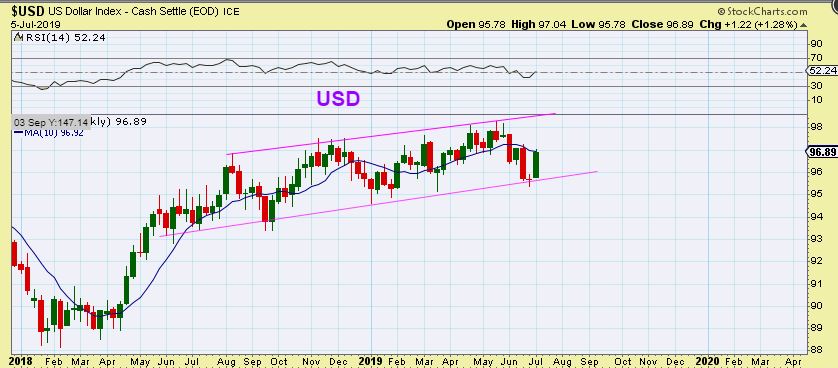
USD WEEKLY – I do have to draw a channel though, and this could cause Gold to stall. Now let me show you why Gold ‘stalling’ is not abnormal…
.
Precious metals
.
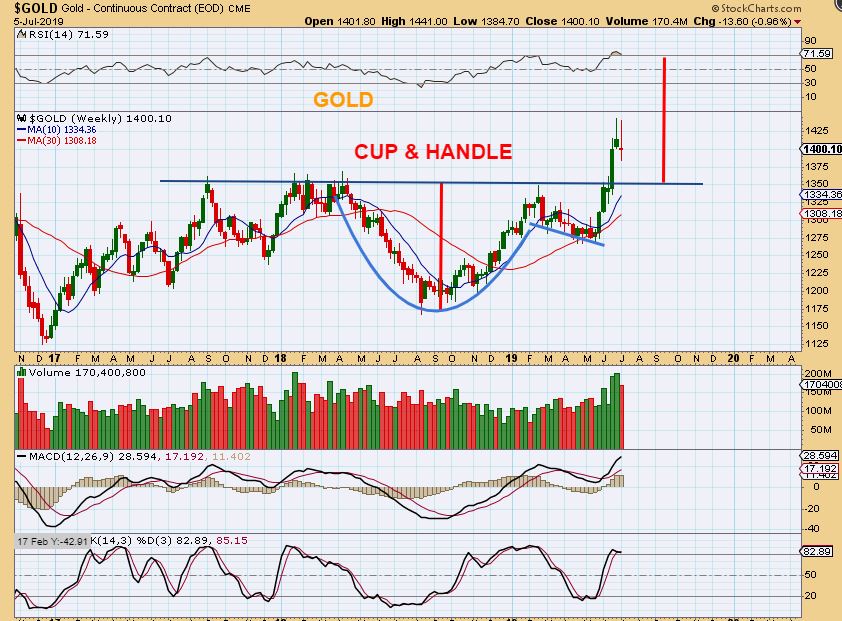
GOLD WEEKLY – Gold has had a strong run, but it hasn’t completed the weekly measured move of a CUP when drawn this way ( I am seeing many draw it this way), however…
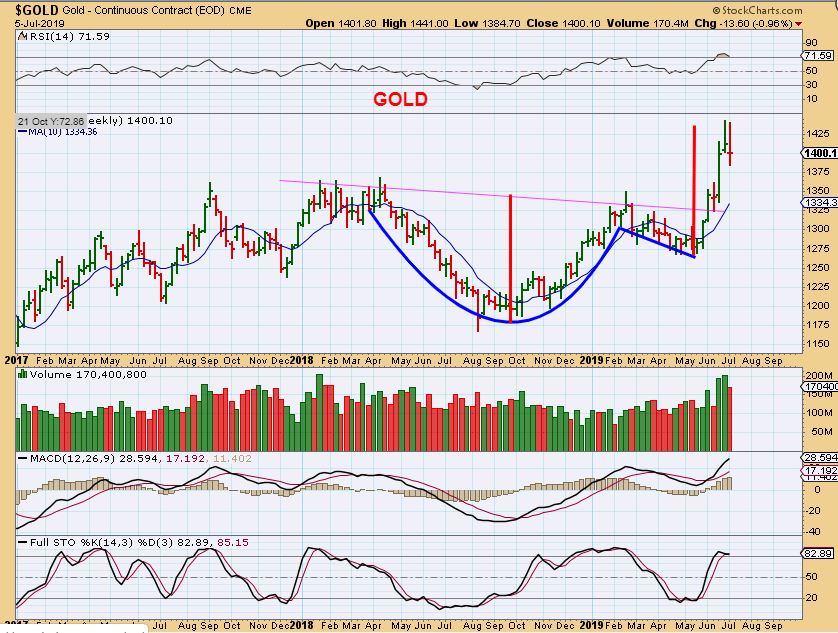
GOLD WEEKLY – I also put the start of the 2nd run as the low of the measuring stick, and Gold did complete a first target. That usually just calls for a pause, and then it continues higher. So let’s discuss that possible pause…
.
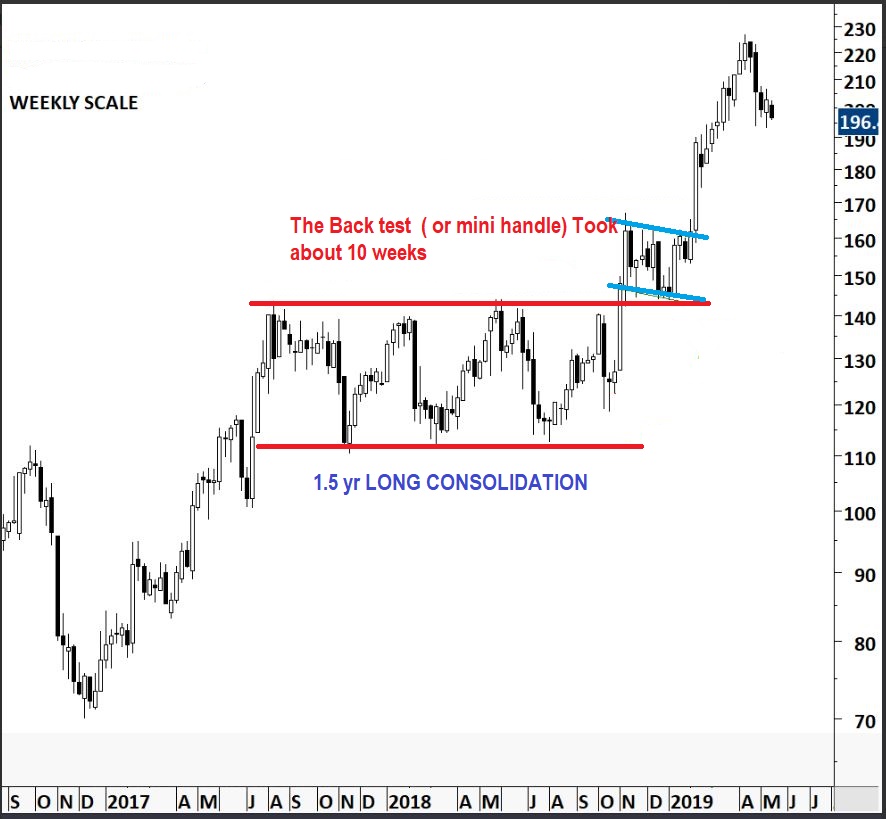
Break out & pause – This is a real chart and shows how price acted after breaking out from a long consolidation. It basically became choppy. Those are weekly candles and you can see that price jumped from $150 to $170 repeatedly, week after week. Are you ready for that in Gold? IT MIGHT HAPPEN…
.
SAME CHART- I just want to mention that with a 1.5 year consolidation, you will get a longer handle Lets now look at GOLD…
.
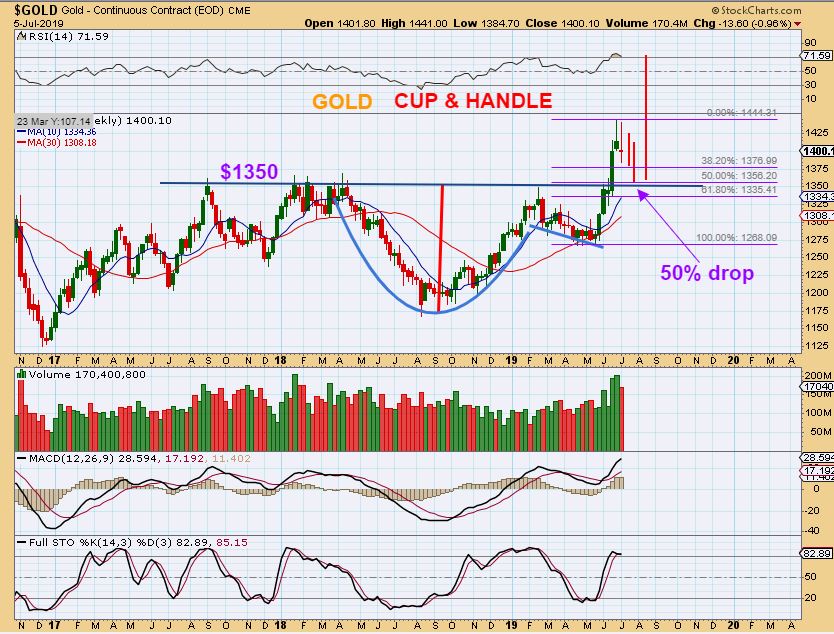
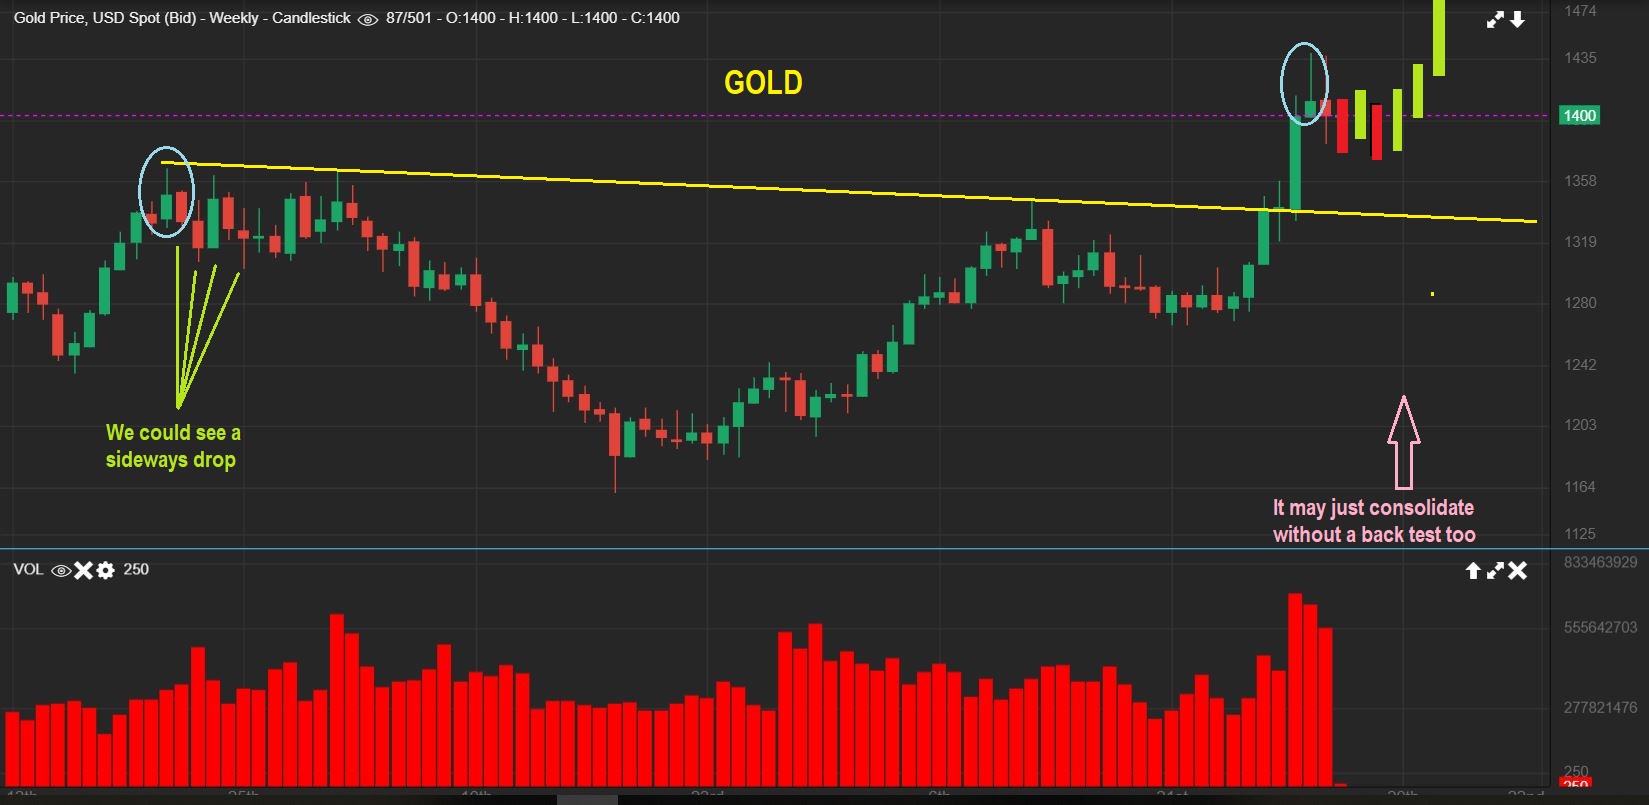
GOLD WEEKLY – I have draw a multi week dip to back test the break out if the USD goes to the top of that channel. This is NOT a prediction, but it IS A POSSIBILITY. I have drawn this based on my experience, and I have seen this often on daily charts and weekly- so we have to be prepared for this boring, choppy , even scary for some, type of movement.
GOLD WEEKLY SAME CHART – To put this in perspective- Gold only closed down $13 this week, and was really Up last week. So look at that chart. Gold closed this week exactly where it was 2 weeks ago. Volatility scares people out , and The Gold Bull is trying to shake off the riders right now, but the weekly closing price has hardly changed in 3 weeks. It is near $1400.
I AM GOING TO DISCUSS MORE AT THE END OF THIS REPORT. WHY? THERE IS 1 SCENARIO THAT COMES TO MIND THAT FITS THIS IDEA, AND IT SHOULD BE DISCUSSED. 🙂 For now…
.
GOLD WEEKLY – I drew another possibility. GOLD COULD JUST TAKE OFF HIGHER AT ANY TIME. Here I have added these candles to show a sideways chop as the USD chops around. This move scares people out, Builds energy for a break higher, & then runs higher. THIS is a valid POSSIBILITY. We don’t know for sure how the wiggles will play out, but this is a very bullish chart if you ask me…
.
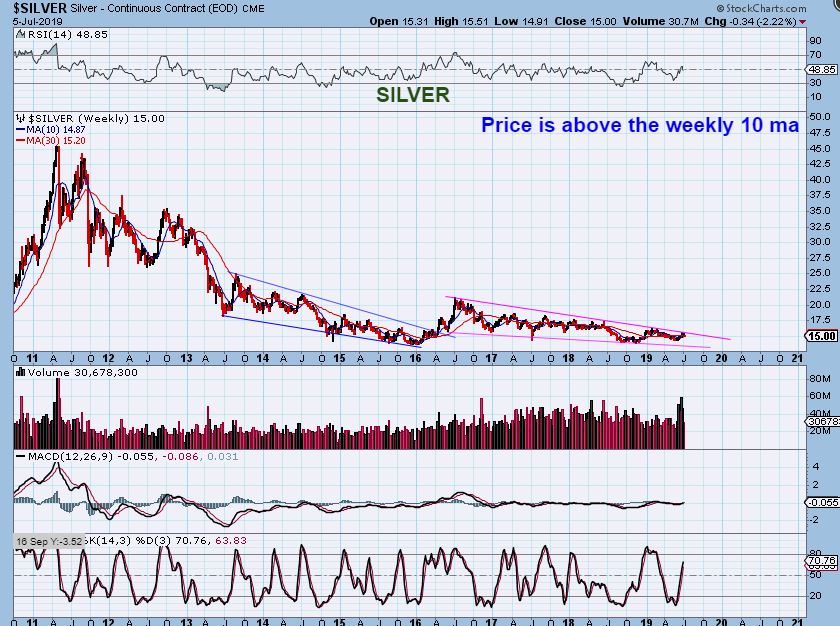
SILVER WEEKLY – When Silver breaks higher, the Silver longs are going to make solid gains from this very lengthy base.
.
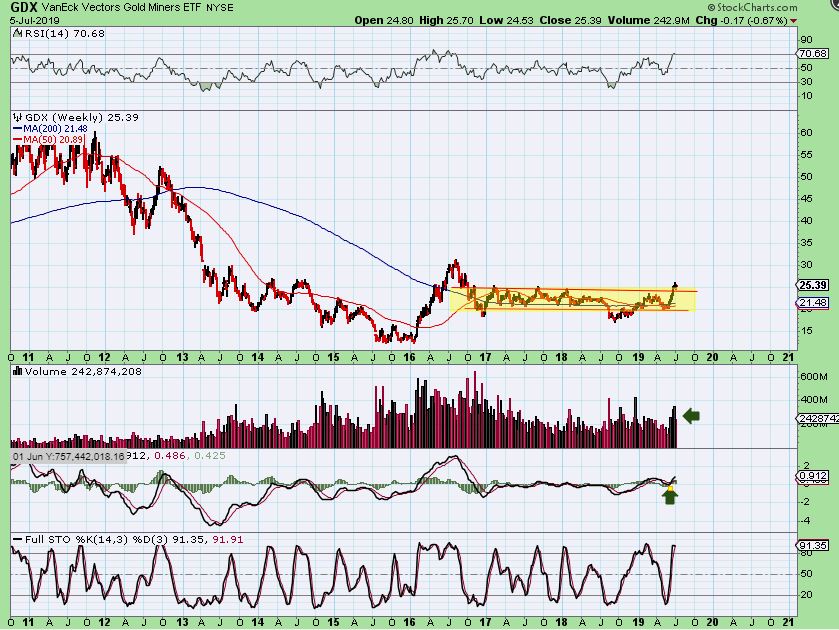
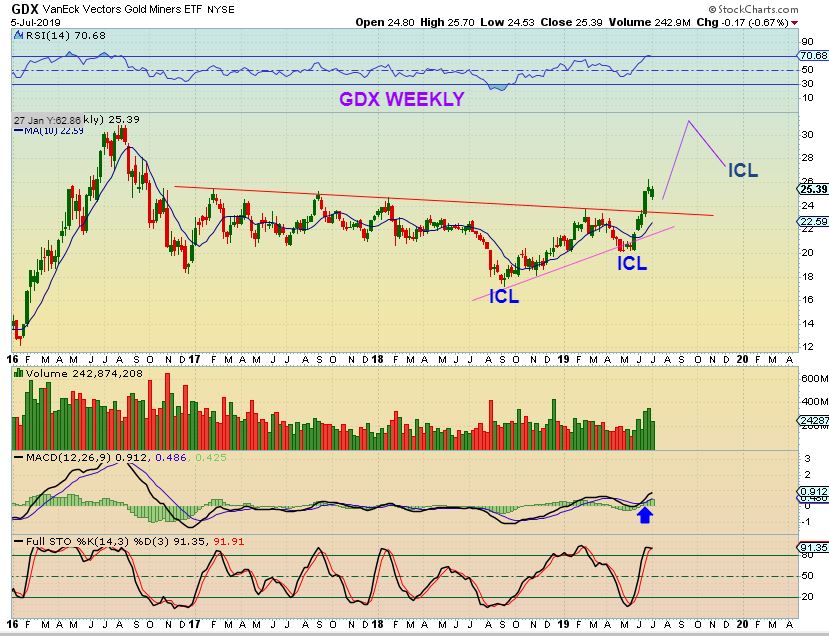
GDX WEEKLY – Here is our nice long multiyear base breaking out. People are still saying that they are worried about Miners, but I love this chart. A run to 2016 high should follow, but how & when it gets there will remain to be seen.
.
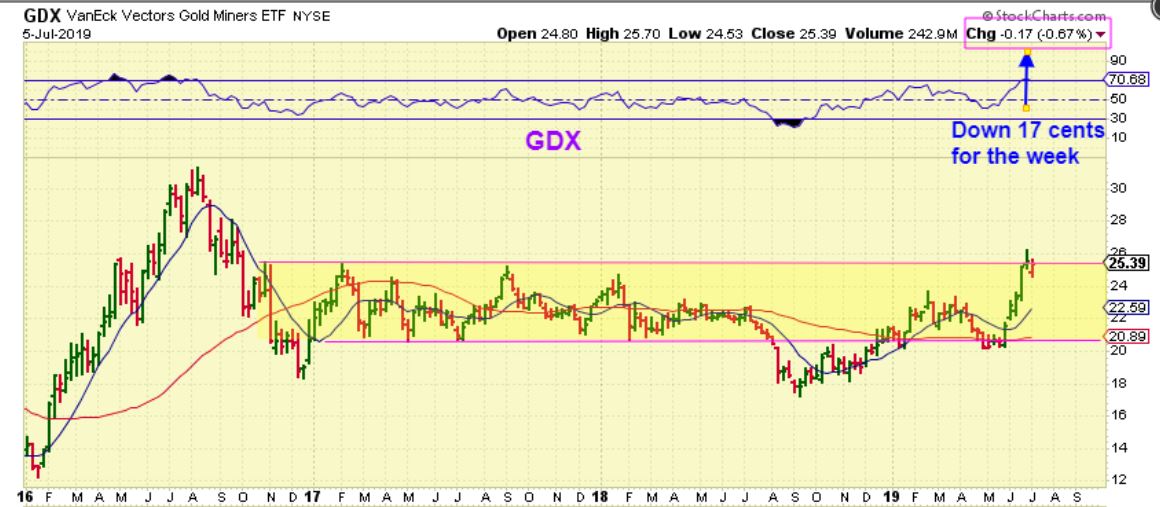
GDX WEEKLY – I just wanted to let everyone know that GDX was down —- only 17 cents last week. Yup, that’s all friends!
.
GDX WEEKLY – This would be the Big Picture of what I expect … Over Time. I would think that the next ICL comes as a higher low like the 2nd one, possibly even a much higher, low as shown here. So far, this giant pan or cup is what I have been calling for since last year. Know this though: We COULD also get a back test at this point too. I’ll explain that with Gold at the end of this report.
.
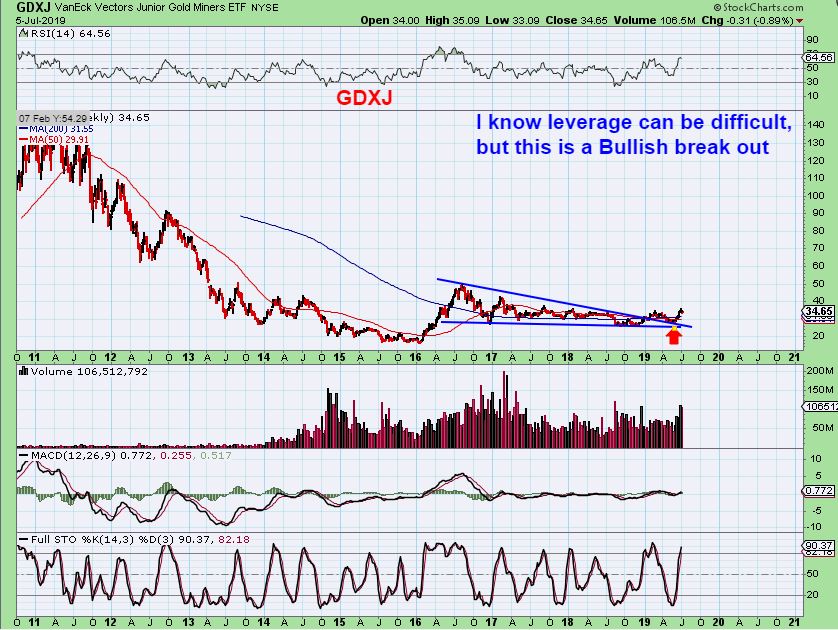
GDXJ WEEKLY – GDXJ is a $34.65 ETF, that was only closed down 31 cents last week. GDXJ dropped and then reversed higher.
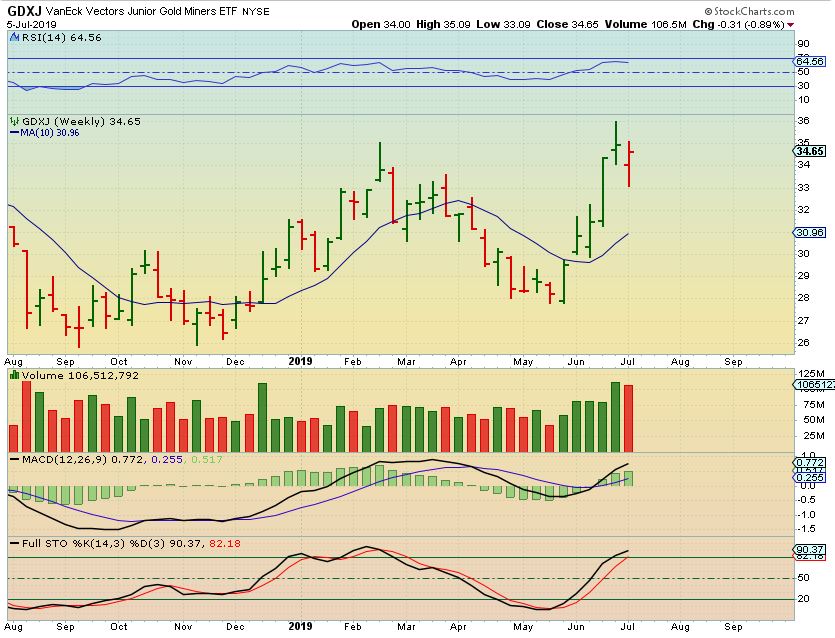
GDXJ WEEKLY – And what I am seeing is a beautiful break out, back test, and the start of the move higher off of those lows with volume.
.
Gold has paused in its run higher, but the set up is bullish. Until that changes, I am Bullish. I got 2 emails from people reading other things, reading every story that they can find on Gold, including bearish reasons why Gold cannot continue to climb, etc., and I am being asked to explain those stories away. I’m not reading all of those stories, I am just analyzing my charts along the way. Here at Chartfreak, I am showing my analysis day after day, Weekend Big Picture Report after Weekend Big Picture Report. I am bullish. If things change? I’ll post that too, but right now nothing has changed, we’ve been correct, we’ve been making money, GDX was down 17 cents this week. The fact that those writers may have missed this move calling it a false run or calling for lower prices all along? That is always perfect for a Bull Market. 🙂
.
Below I will discuss another scenario in the gold set up, and it is still bullish. Enjoy your weekend !
.
~ALEX
.
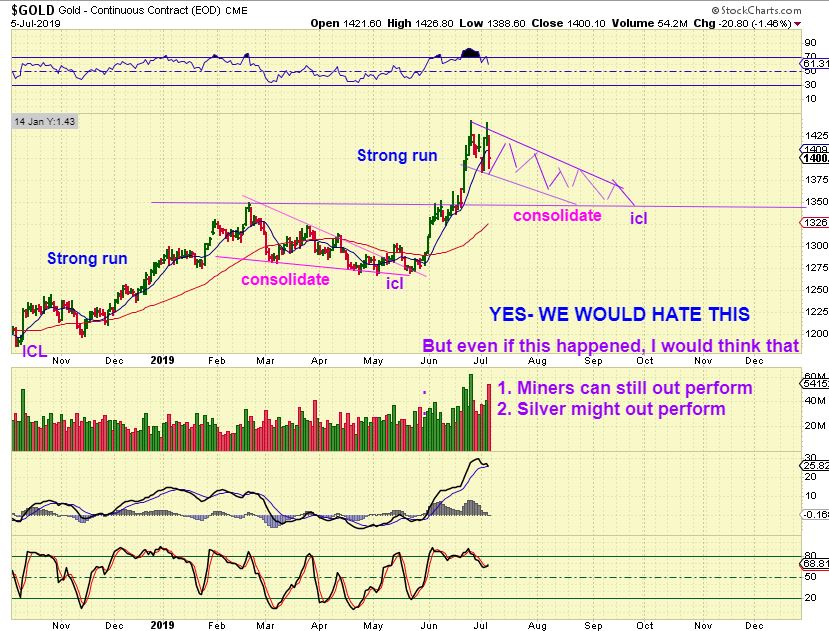
I don’t want to disappoint anyone, but here I’m just showing you how a Back Test in Gold COULD play out, caused by an ICL in the USD, and it could also drag things out a bit. At this point, I tend to view this as Less Likely.
.
USD DAILY – Since I mentioned last week that this COULD BE AN ICL, and Gold has stalled, I want to review an idea where Gold stalls, but remains bullish.
.
The Chart of a back test from the report – I showed this chart and discussed the type of consolidation ‘Back test’ that can last for weeks. This was 7-10 weeks, depending on how you count it. I mentioned that Gold could be in a similar situation…
.
Gold broke out & may also be ready for a back test (MAYBE, MAYBE NOT). I just wanted to show you how that may play out if it were to happen. A mini consolidation like that can take a few weeks, so lets now look at GOLD. I DO VIEW THIS AS LESS LIKELY, BUT IF WE STALL FOR A WHILE, I KNOW PEOPLE WILL WONDER WHAT MAY BE HAPPENING. IT COULD BE THIS.
.
GOLD WEEKLY – I have draw a 4-5 week dip to back test the break out. I drew about 4 weeks, but what if we got 8 weeks? …
.
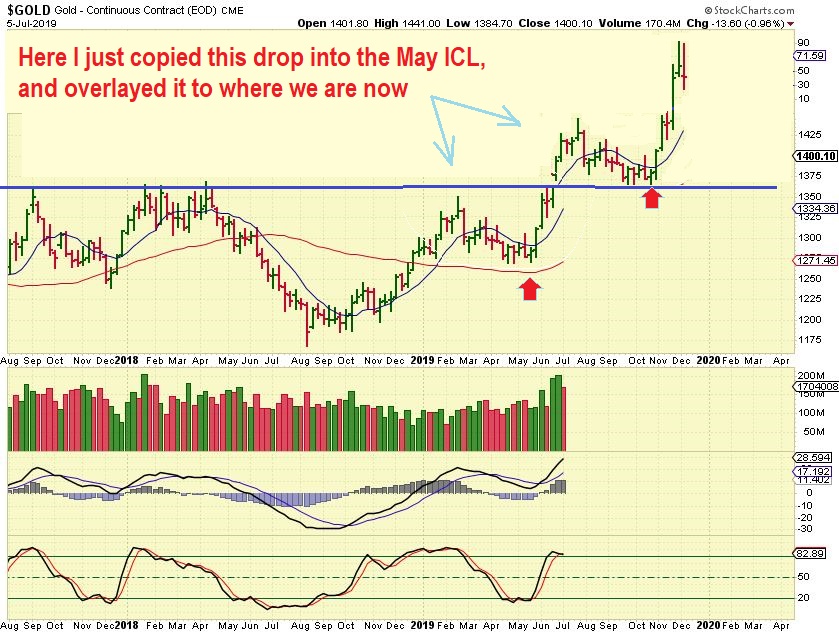
GOLD WEEKLY CHART : So here I copied the same FEB to MAY gradual ICL drop & over-layed it as a back test, just to give us a visual. The ICL is actually left of the red arrow. A drop to an ICL starting so soon as that back test?…
.
GOLD DAILY – We would have to assume that as mentioned in the past, maybe that was 2 daily cycles already and this is the 3rd? After a Very Long Intermediate Cycle ( August 2018 to May 2019 ), we could now have a much shorter Intermediate Cycle ( let’s say May 1 to mid Sept for example). I have definitely seen 4-5 month cycles, so the next 2 daily cycles could drift, chop, and gradually act as a back test as shown.
.
I do view this idea as ‘least likely’ and still think that these moves higher can continue. I am drawing this up because ‘Back tests’ Can happen and it is a 2nd idea of how things could play out if Gold continues to stall due to a USD ICL. It does NOT change the big picture.
.
In fact, here I have added several more of the same exact dip we saw into the May ICL, and the Big Picture remains bullish.
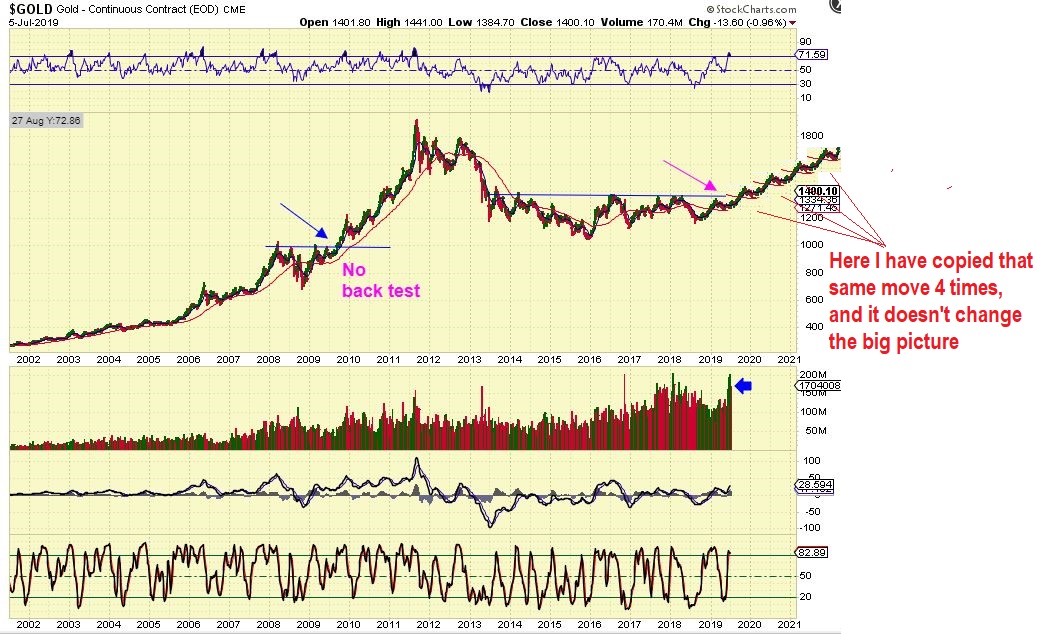
The above overlay of the repeating pattern is exaggerated and will not happen, because that was a dip into an ICL. Even if it did though, many Miners would probably just keep running on their own, being accumulated because it would be obvious that Gold is running higher and their earnings would improve. The Big Picture remains Bullish.

