Tuesday June 18th report- Guess What I Found?
I found some additional good news pertaining to the Precious Metals markets. I want to release my morning report tonight, since this information is helpful on a Fed week and an options expiration week ( Double Whammy) . Let’s get right into the report…
SPX – So far we have the SPX holding above the 50sma after a strong push out of the recent sell off lows…
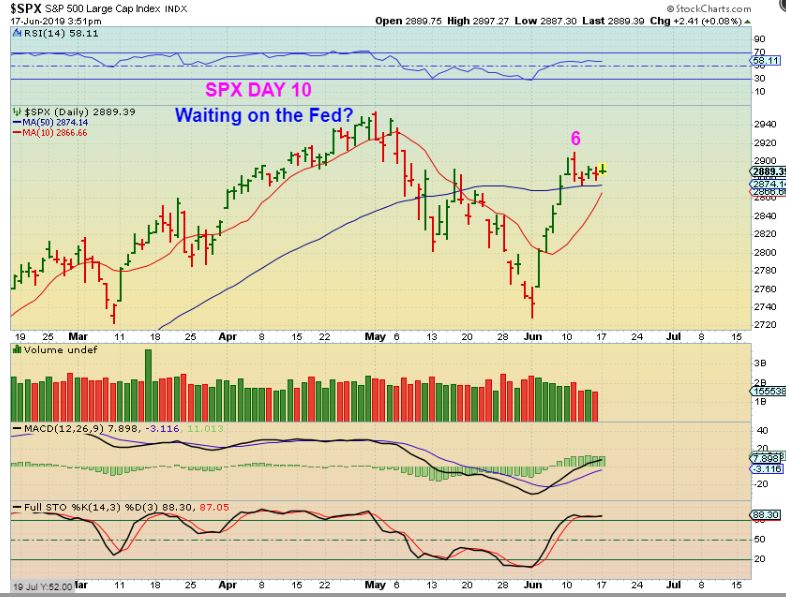
Well, It looks bullish but I do have something important to show you….
SPX – The last Fed Mtg was what started the sell off. The SPX Popped and we got a POP HIGHER on the FED Day, and Gold sold off. Then the following Thursday, the Markets started their sell off, and Gold started to rally. HOWEVER…
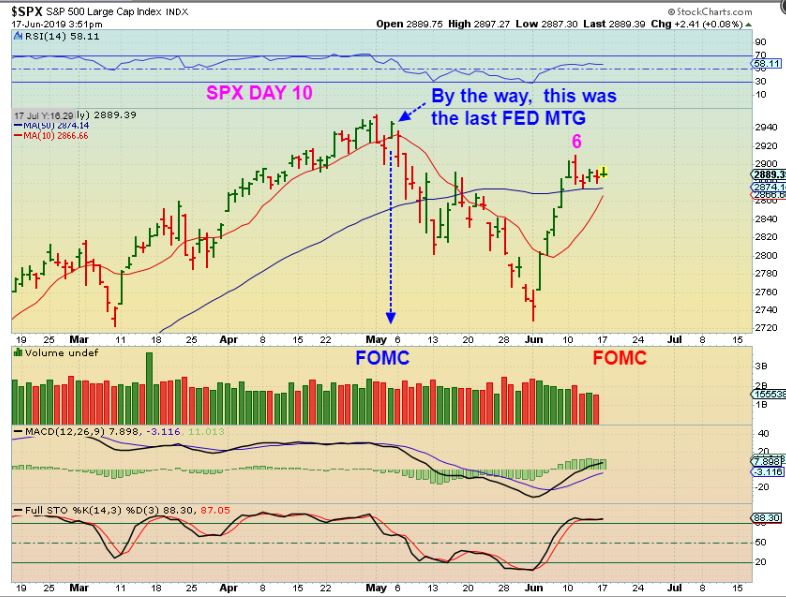
The Fed minutes were released at the end of May, and the FED discussed a change in policy from last years 4 rate hikes to the talk of rate cuts. That is when the Markets rallied with Gold, which also rallied after the fed minutes.
Right now the General Markets rallied, paused in a consolidation here, and seem to be waiting on the FED. The May Fed Mtg dropped the markets, the Fed Minutes released propped them back up. We’ll have to wait and see what happens this time, but so far, Holding above the 50sma is considered bullish.
.
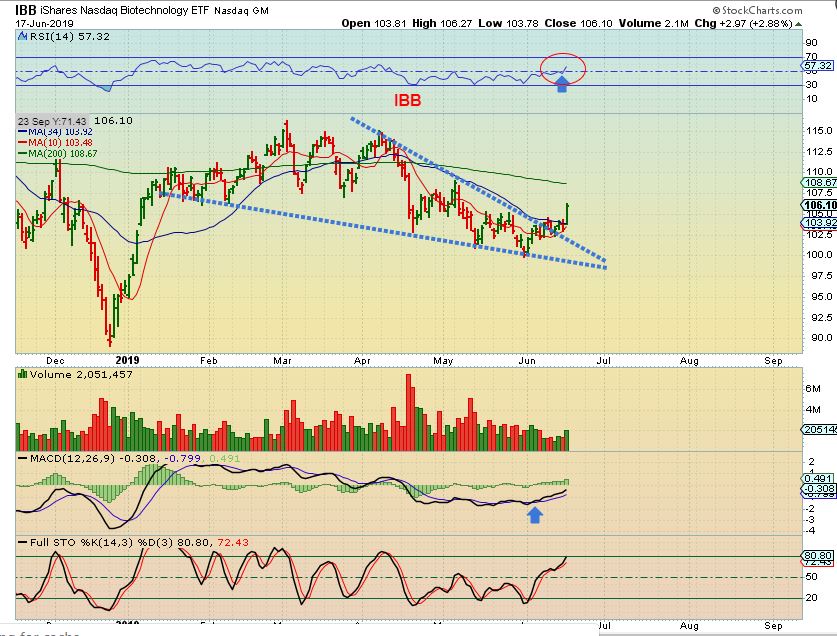
IBB ( or LABU) – This does look like a bullish break out. It could be bought with a stop & see if it can get above the 50sma.
.
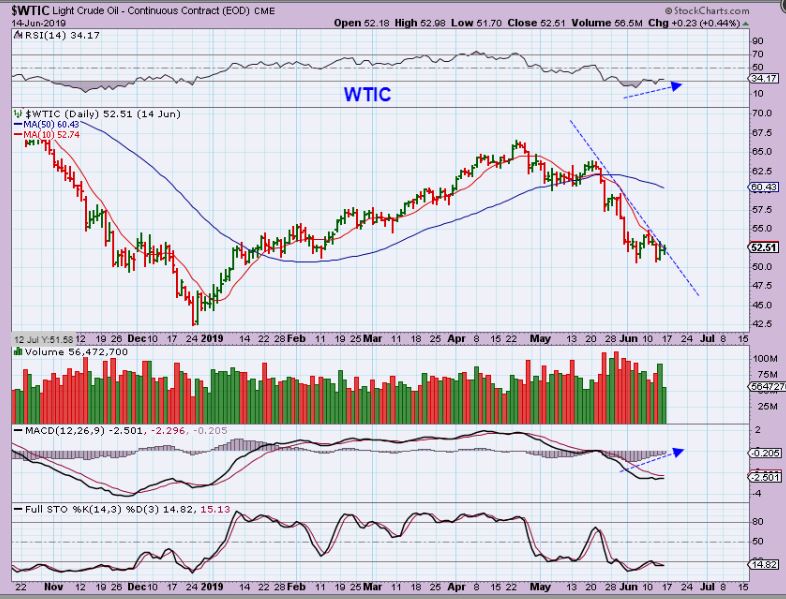
WTIC – Oil may be stabilizing after an Oil Tanker was apparently attacked and threats of future attacks may still be out there. There is also a possible threat to block Oil Tanker routes and this could disrupt Supply & Demand. That may change Oil to bullish, but so far OIL is stuck under the 10sma.
.
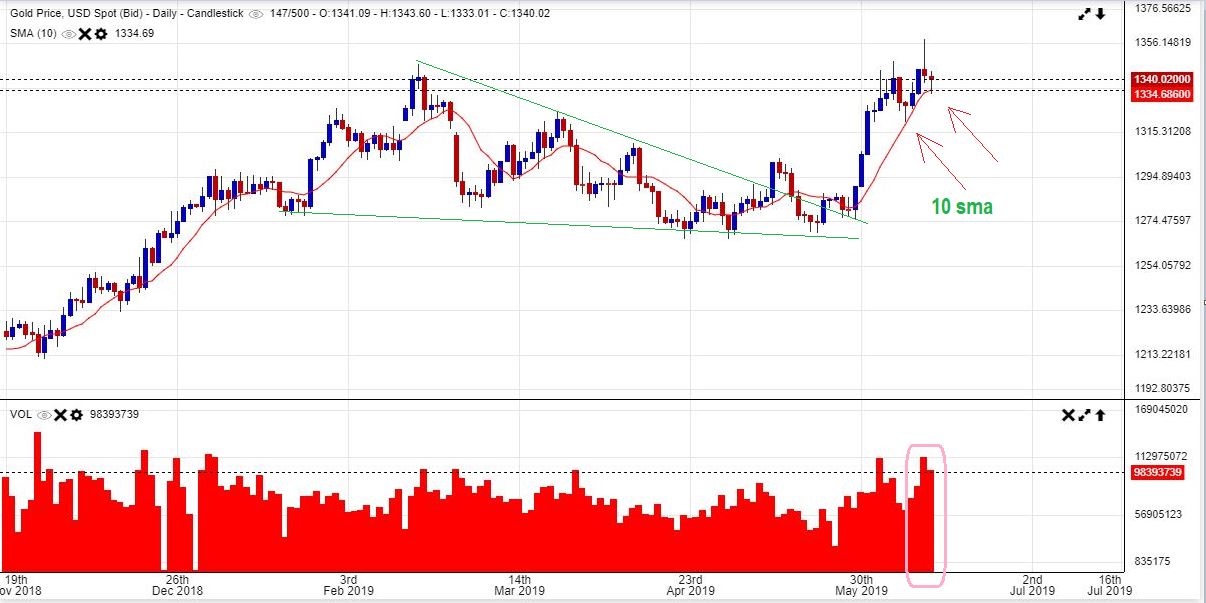
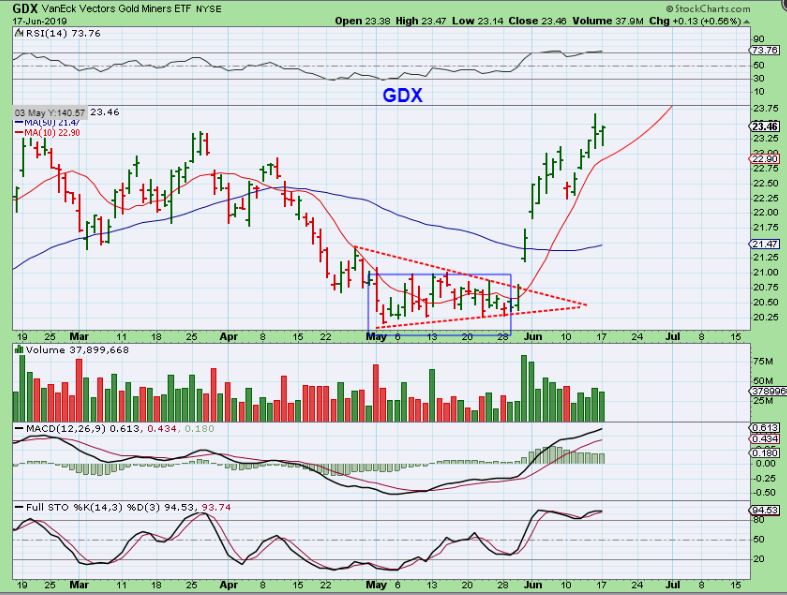
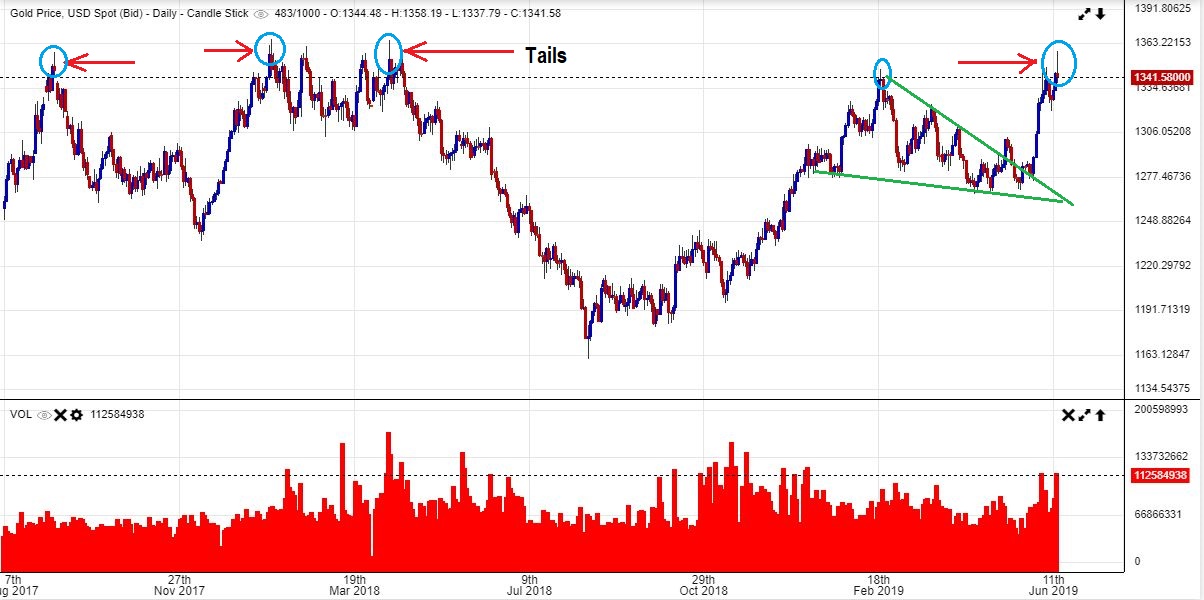
GOLD CURRENTLY – Gold dropped about $10 Sunday into Monday , but as you can see, it tagged the 10sma and bounced right back. A break of the 10sma is necessary to have confidence that a dcl is in place. Daily cycles are roughly 30-40 days and this would be day 39! I also pointed out a POSSIBLE short daily cycle of 20 days and then the ramp up as a 2nd daily cycle- but to me that seems less likely. Triangles often mess up cycle counts, so at this point, I am just watching the move, and it is bullishly riding the 10sma.
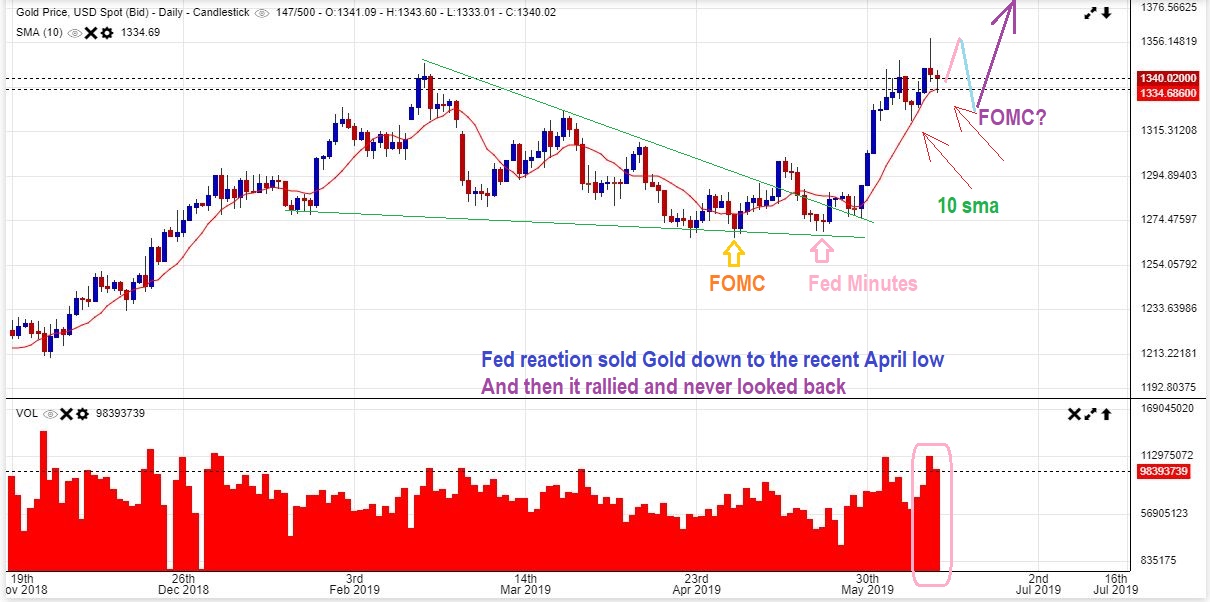
GOLD INTO THE FED MTG – Let’s just say that we get the same reaction that we saw in early May FOMC, and the release of the Fed minutes. Within a day of both of those Fed Days in May, ‘lows’ formed in Gold. IF THAT REPEATS, this is a possibility. I drew a rise Tuesday, a drop maybe Wed & Thursday, and a dcl caused by the FOMC that may come in on Late Thursday or Friday. JUST A GUESS AT THIS POINT.
.
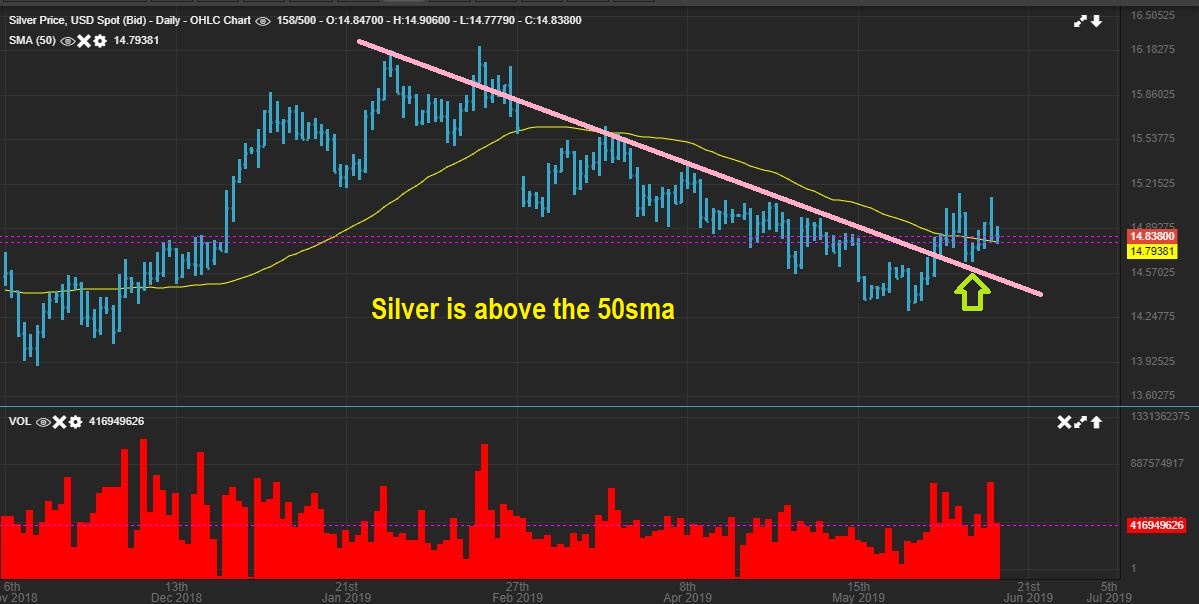
SILVER – Silver is still above the break out & 50sma.
.
GDX – Can GDX just sell off and tag that 50sma & remain bullish? Yes, but in stronger runs like in 2016, GDX just kept bouncing off of the 10sma. I have admonished my readers to own Miners for weeks now, and if you’ve started with small positions, just add on the dips . Problem is…We haven’t had lasting dips.
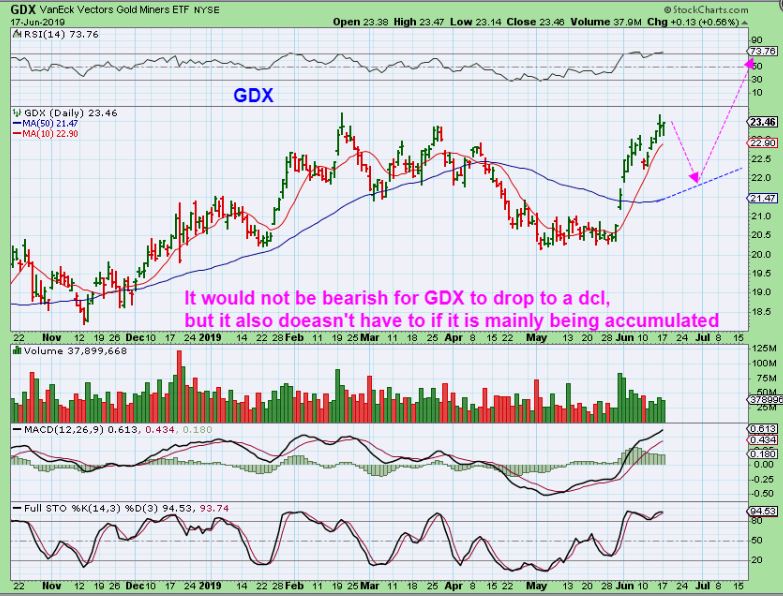
GDX – We bought this early, because if this runs like 2016, there is a danger of being left behind. That has been mentioned here a lot too. If this Bull Run is preparing to make that Big Break Out that I have pointed to for over a year now in the Big Picture Weekend reports, it may not drop much below that 10sma.
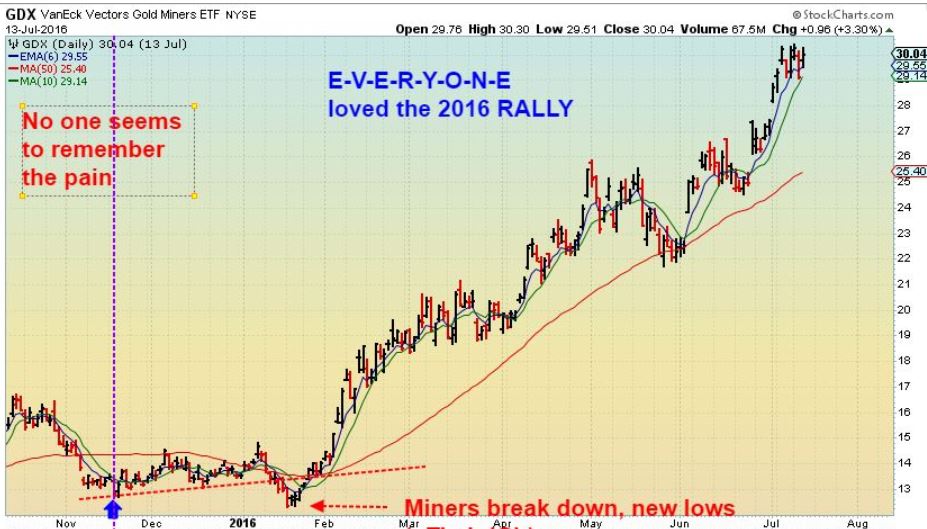
GDX 2016 ( This is a chart from an older report, ignore the writing) – Just look at the run from the Lows along that 10sma. No real deep dips to enter, though the 10sma was gradually broken here & there. Seeing that is the reason that I have been saying that you really want to stay invested just in case we get this type of a ramp up.
WHAT ABOUT THAT COT? I WILL ADDRESS THAT SOON. 🙂
.
MORE MINER IDEAS
.
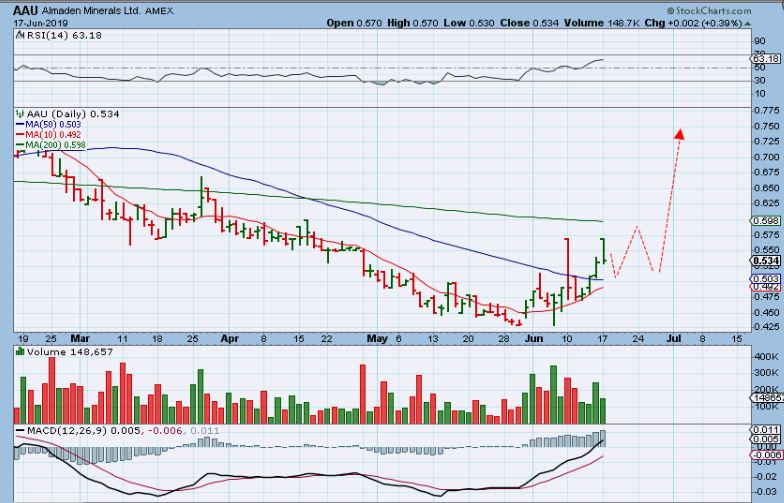
AAU – On June 11 I posted this as a Bullish pop, even though it reversed. I said it could be bought or put on a watch list to see if it makes progress. Well, it is making progress…
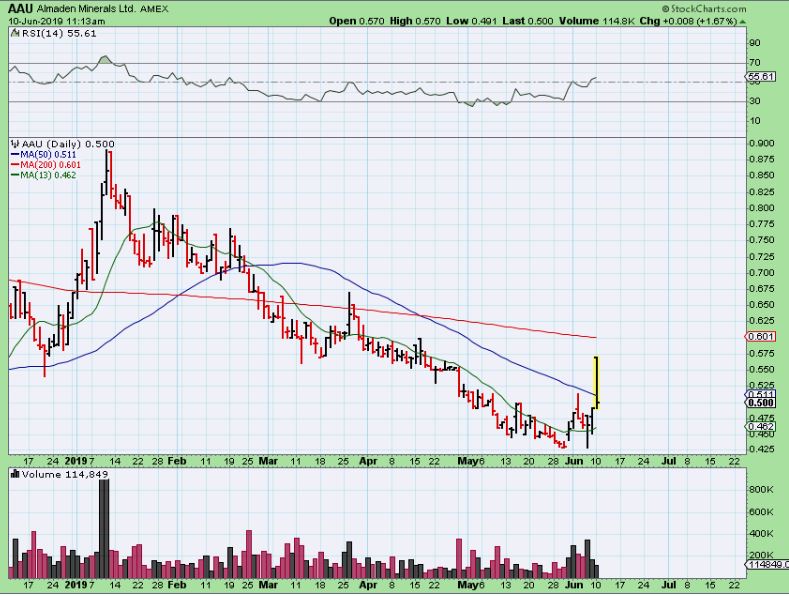
AAU – This was Friday and it has now broken above the 50sma and has the 200sma as resistance…
1. It can be bought here
2. It can be bought after it breaks above the 200sma, but I like what I see, and…
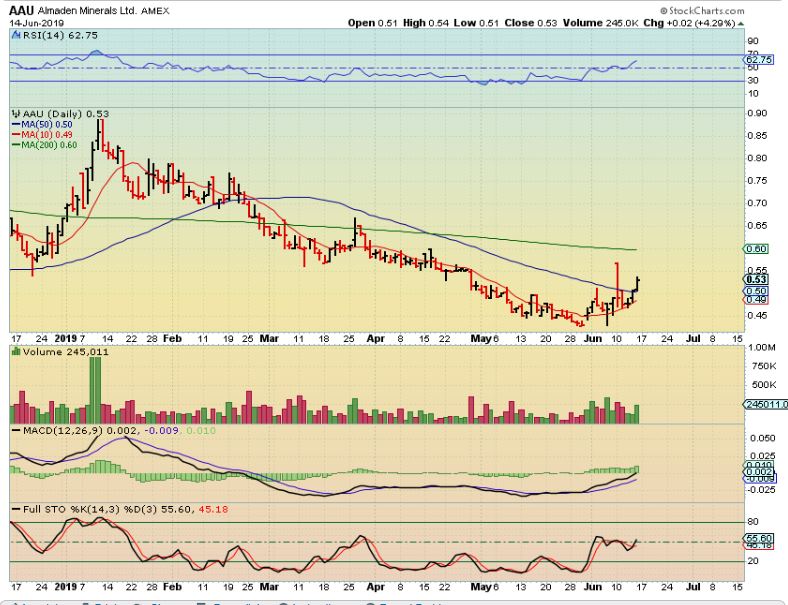
AAU – It popped higher Monday& dropped again. I like it.
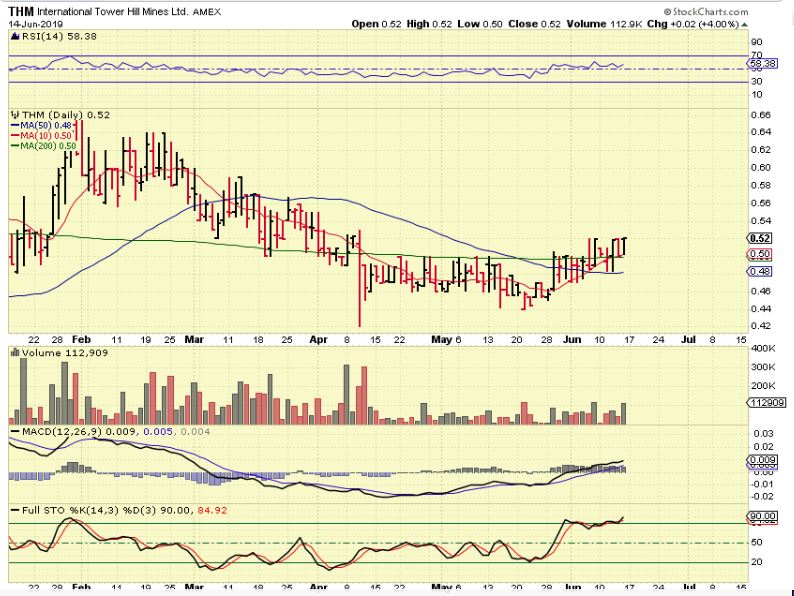
THM – Slow progress, but THM can run when it gets going. This is a buy above the 50 sma & now the 200sma as volume increases.
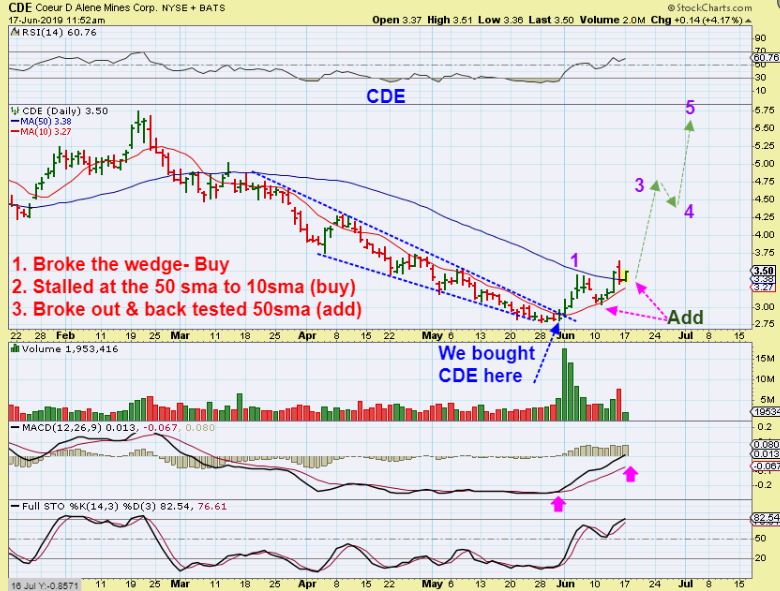
CDE – CDE has been owned by many of us for weeks, and now another buying opportunity is that it is above the 50sma. Slow but steady progress so far.
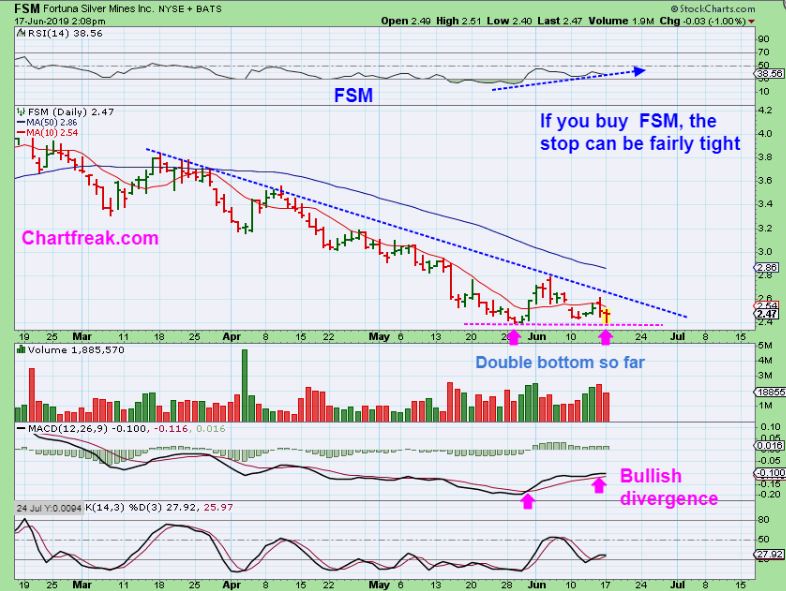
FSM – FSM actually put in a reversal, closed up 2 cents, and had almost 3 million in volume after I captured this chart. It is a buy too, but you may want to wait until after the Fed day, just in case it drops & does a shake out?
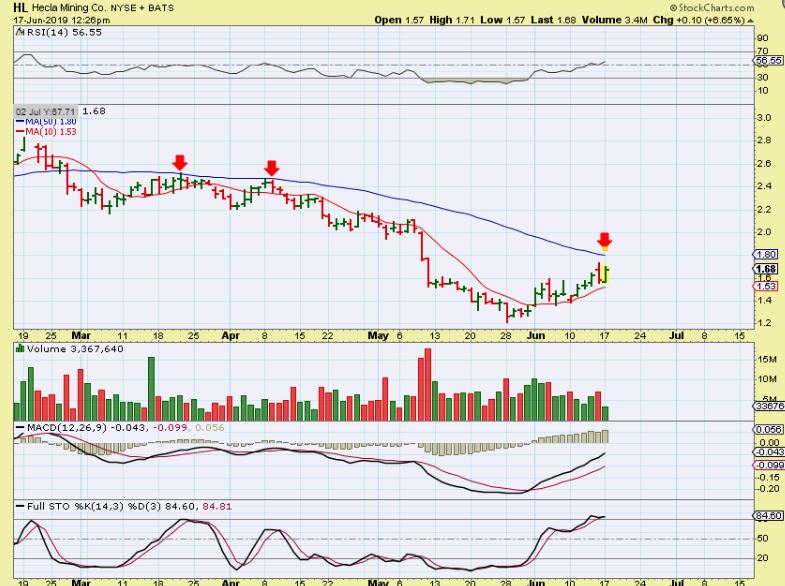
HL – I captured HL midday, and it has overhead resistance, but also support on the 10sma. It might just break right through, it might pause and keep bouncing off of the 10sma, so you can either take full position above the 10sma with a stop, or buy partial, and add if it breaks out higher.
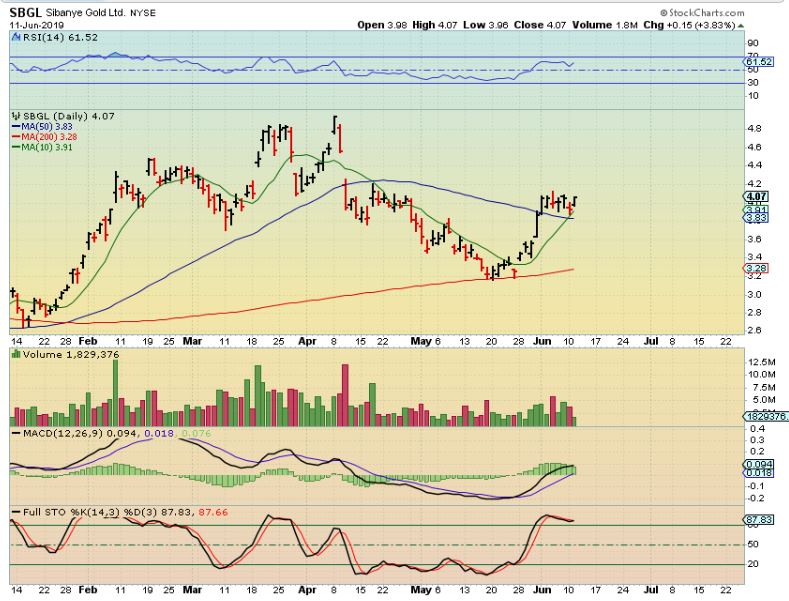
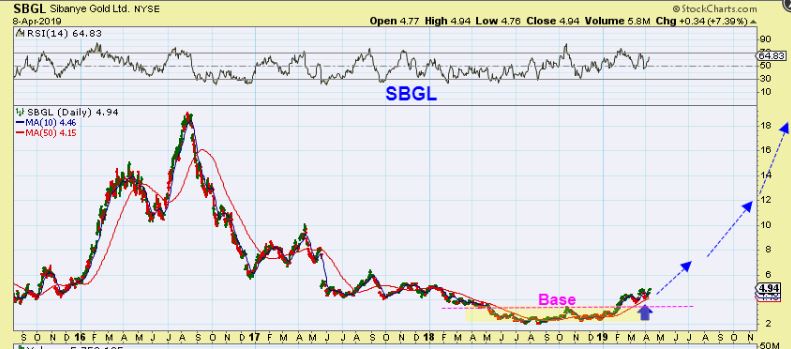
SBGL – This was our 2nd opportunity to buy ( Bull flag on the 50 sma).
SBGL – It is still moving higher, now riding along the 10sma. I like the way it ran in the past, and I like that Big Picture…
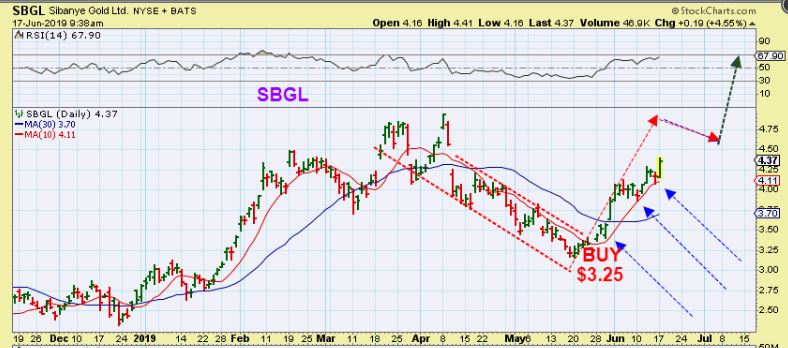
I like that Big Picture coming out of a base. SBGL has good long term potential.
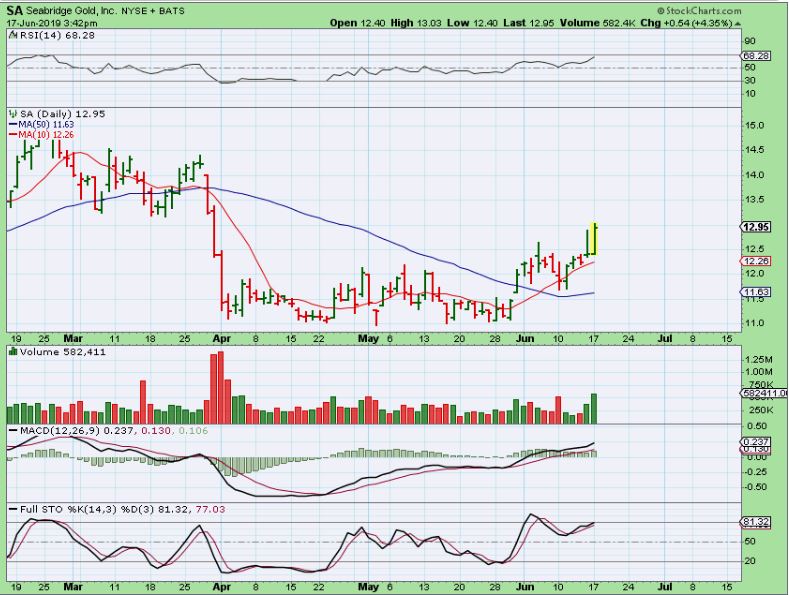
SA – I posted this last week as a strong buy, the Base is a very nice base. Especially if it gets above the 200sma…
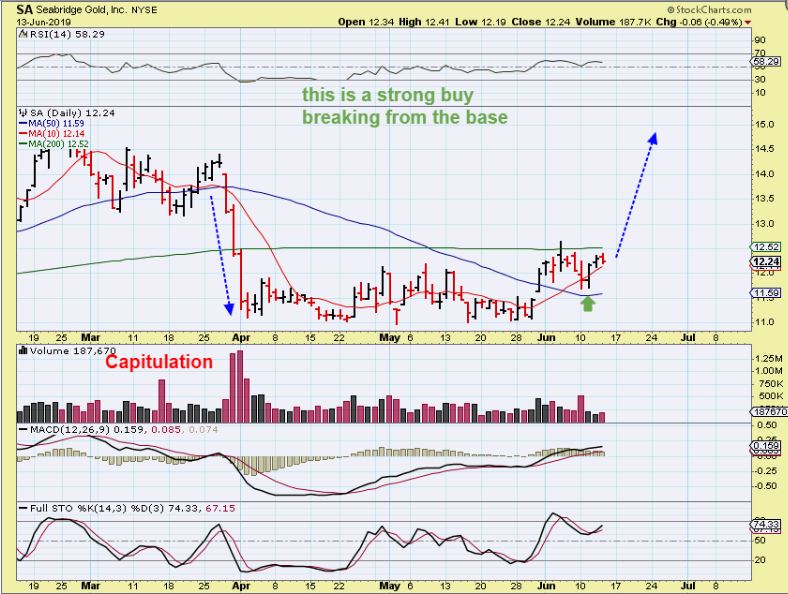
SA – And there it goes. I like this stock a lot.
.
This is the same disclaimer that I always give: INDIVIDUAL RISK is in individual Miners. Some prefer an ETF like GDX, GDXJ, SILJ, etc. I like Miners, I have seen many double , triple, and even run 10 fold in a good Bull Run. I would not hold just 1 or 2 though, I like a basket of 5 or so, and that way if a Mine floods, a public offering is made, they experience an Earthquake or natural disaster, etc in one Mining company- the price drop for that 1 stock will be offset by the other Miners you hold.
.
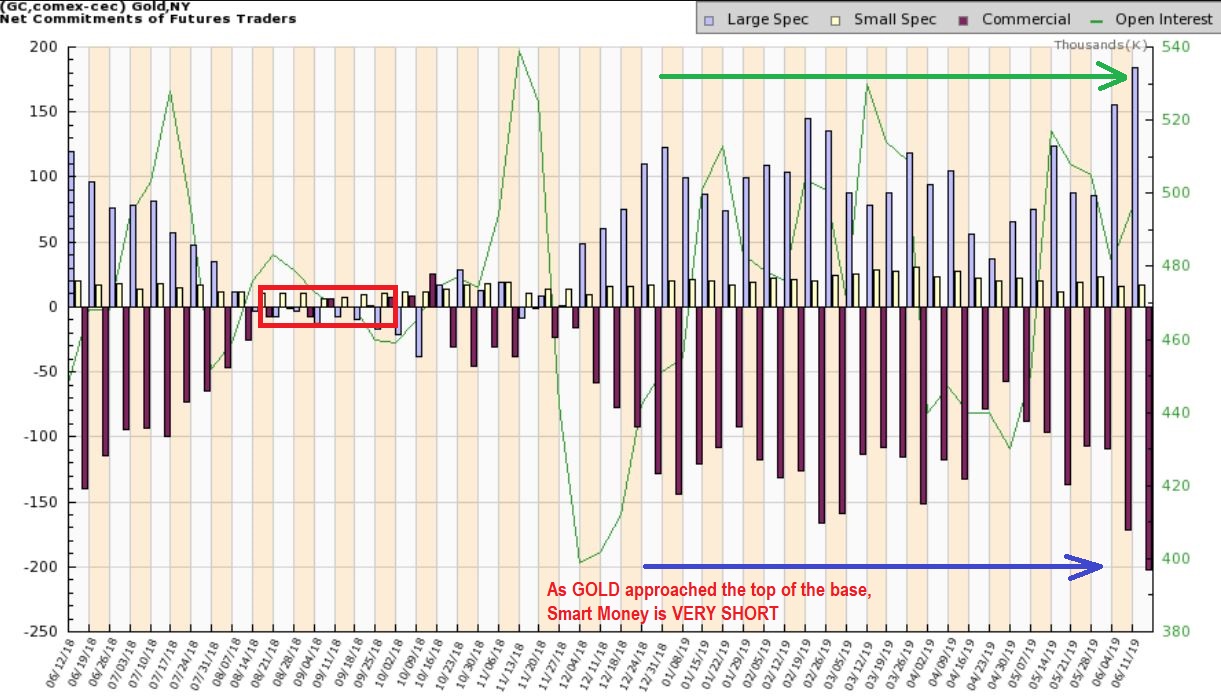
So This weekend I discussed the COT showing Smart Money suddenly very short compared to where it was at the ICL levels. Add to that the fact that…
1. We are facing the FED,
2. It is an Options Expiration week , and
3. We are at major resistance for Gold in that base. I was a bit perplexed at such a Bullish set up in GOLD coming out of an ICL, yet a COT looking like a slam down might be near by. I wrote this…
.
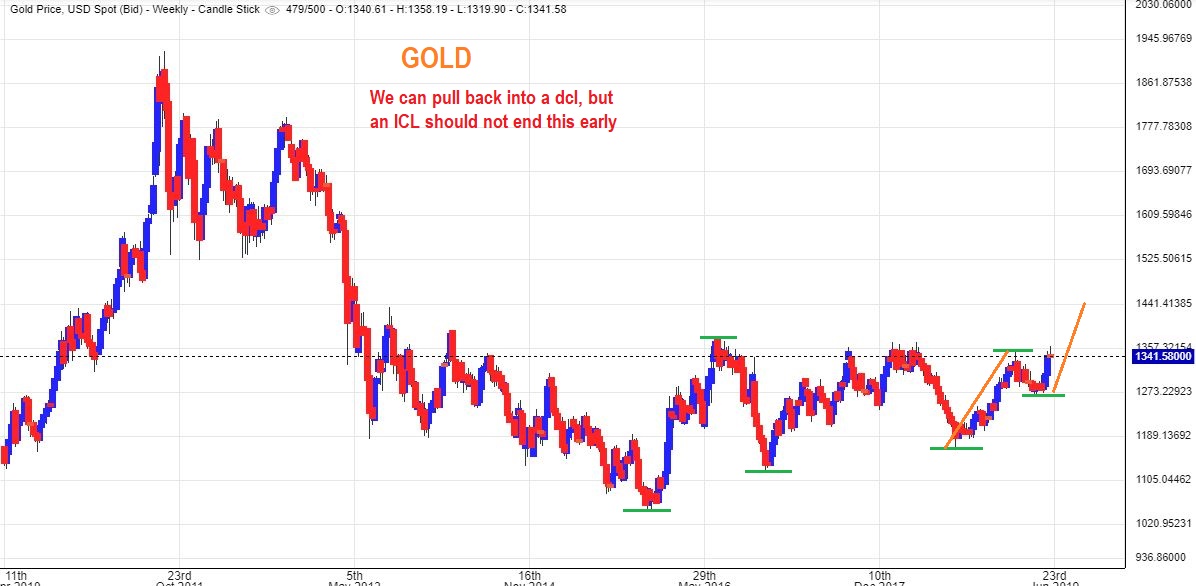
GOLD – An ICL should not just rally a little bit, right? Especially since it is a Much higher low than the Aug ICL. The 2nd daily cycle should break out from this massive base, especially if it includes short covering. That COT is the only thing that puzzles me.
.
So when something doesn’t seem to make sense, I have to do what I always do- LOOK FOR THE ANSWER! I know that an ICL has been put in place, and it should have much further to go. Gold has been Bullishly reversing at the FED Mtgs. There must be an answer that is clearer than a ‘gut feeling’ and bullish charts, so I just decided to dig in a bit further. Below I will explain what I am seeing and thinking as we head into the Fed.
.
Enjoy your Tuesday trading!
.
~ALEX
.
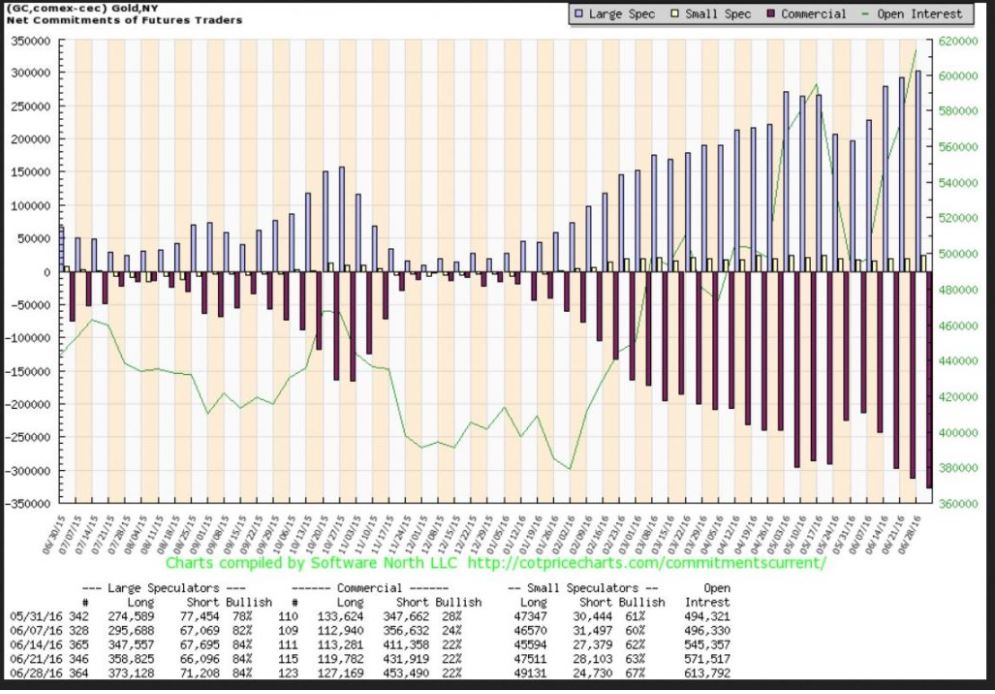
COT CURRENTLY – At the August 2018 ICL level, the COT showed Smart Money actually went long, and THAT is extremely Rare! If you don’t know how to read this, look at it like this: The RED BARS on the bottom show Smart Money short. The longer the bar, the ‘shorter’ they are. As you can see, suddenl they are very short right now …
.
Like I said, I dug into my charts of past memorable RALLYS . I wanted to see if this happened before, and if so, what was the end result? I am happy to say, that I found the BULLISH CASE for this, without me adding a ‘Bias’. I don’t want my Bias for bullishness, I want the Truth. Let’s discuss what I found…
.
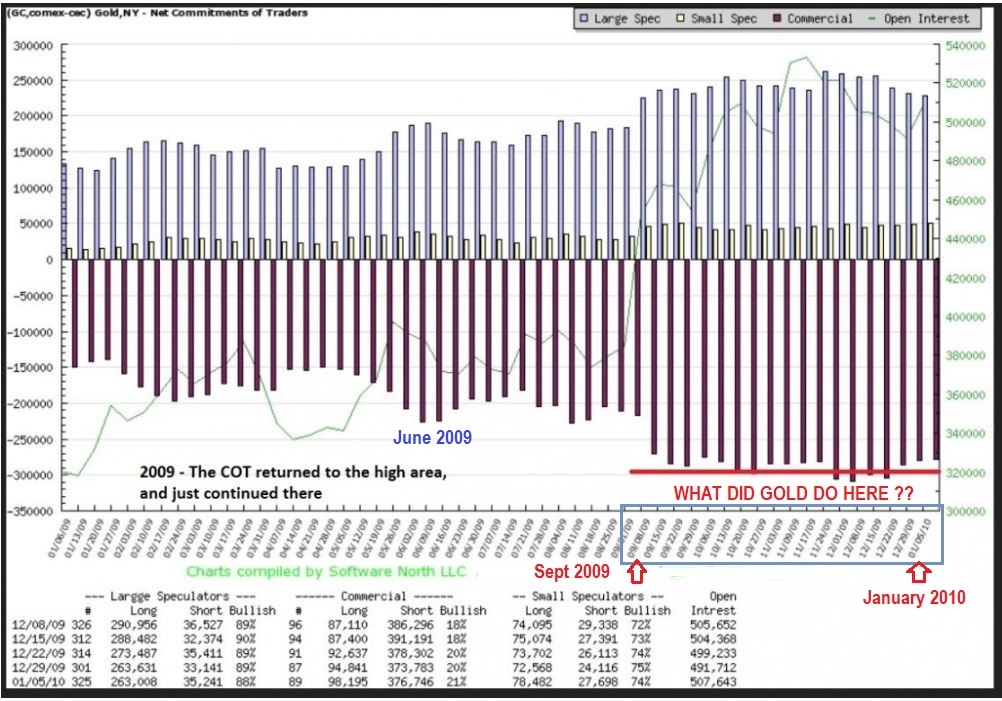
I mentioned this weekend that I know of 1 time that I felt Smart Money shorted heavily & got it wrong. It was 2009. Do you remembered the crash in 2008 and the ICL in October 2008? I do, and Gold then rallied into 2011. That would be a good time to look at the COT, so I dug up that COT.
.
COT 2009 – This is 2009 as Golds rally took place. Notice that Smart Money was increasing their short positions as Gold rallied out of that 2008 ICL. Look at September 2009 onward. Smart Money is getting very heavily short. SO I ASK: In SEPTEMBER 2009, Was Gold rallying, and did it then crash down hard or pull back very deeply as Smart Money increased those shorts?
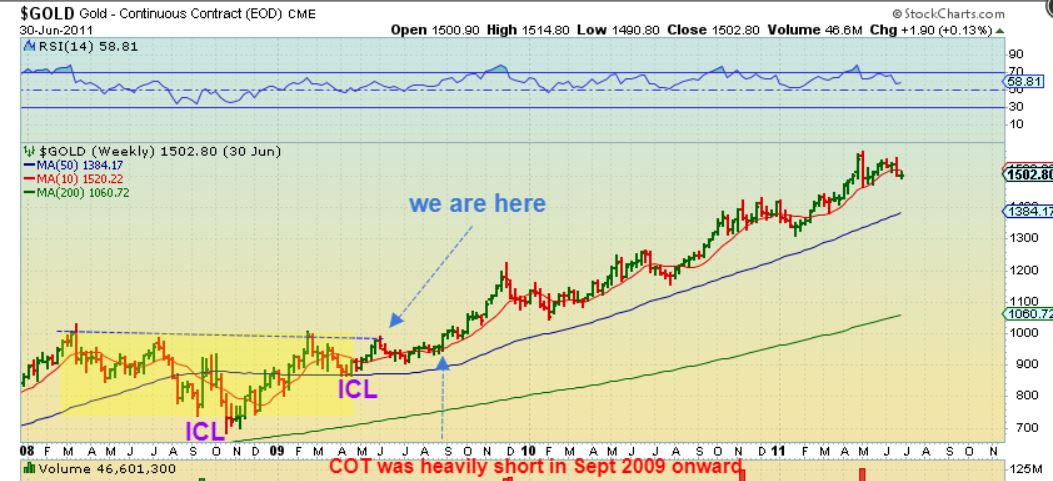
GOLD 2008 lows and the following 2009 rally – My orange line is September 2009 and you can see that as Smart money kept piling on heavily short, Gold was actually breaking from that giant 2008 base- and GOLD did not drop. In Sept Gold was running straight up for weeks ( This is a weekly chart). It actually ran from the first ICL in April into a 2011 peak. A nice 3 year run…
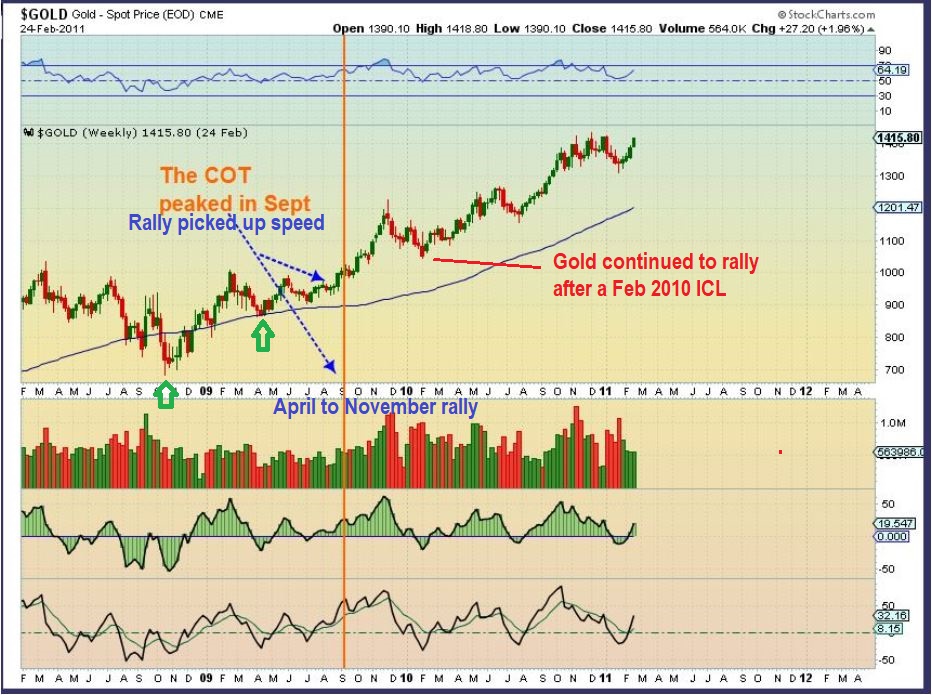
That was a multi-month vertical rally with smart money shorting all the way up. I remember feeling that Smart Money got this wrong. Well, CAN’T THAT HAPPEN NOW, SINCE WE ARE AGAIN ABOUT TO BREAK FROM AN EVEN LARGER BASE? 2009 was a break from a base.
.
ANOTHER EXAMPLE PLEASE:
.
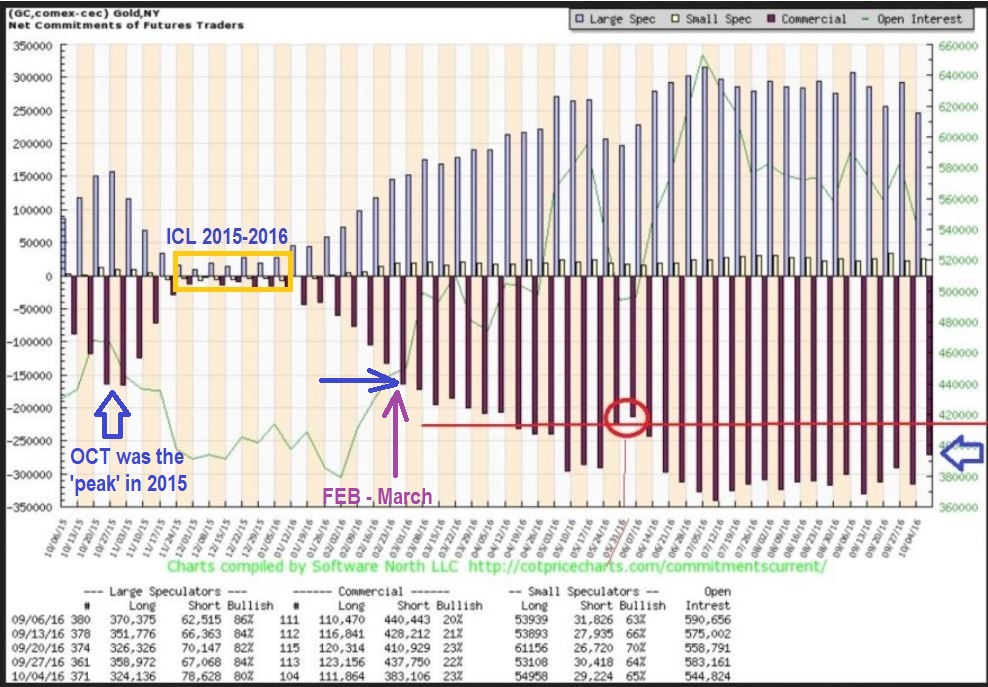
COT 2016 – Look at the Smart Money in the middle of the chart. That is December & January of 2015-2016, GOLDS ICL & MINERS JAN ICL. We all know how that rally went, and notice that SMART MONEY was not very short at the ICL, but they shorted it all the way higher. A closer look also helps…
.
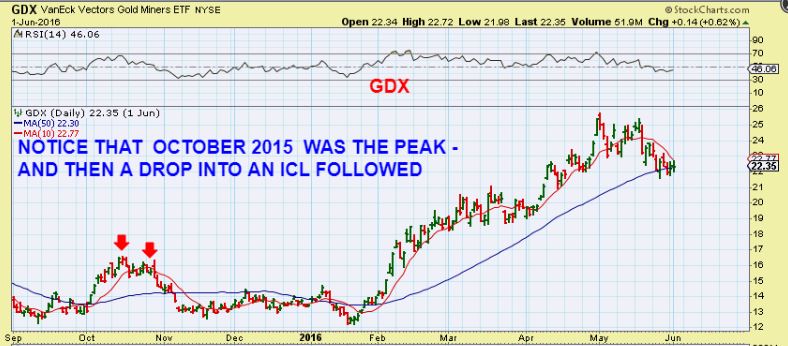
GDX 2016 – Two things on this chart.
1. Look at the ‘Peak’ of the 2015 rally, that was October 2015. The COT Smart Money went very short in OCT 2015 at that peak.
2. The Rally actually ran into AUGUST 2016, but I stopped this chart at the MAY ICL. Let’s look at that COT.
COT 2016 – See that OCT 2015 ‘Peak’ and where the COT level was? By Feb & March 2016, the COT was the same as the OCT peak, so Smart Money looked VERY SHORT in Feb 2016, but the rally continued (see chart above) and the COT SMART MONEY just continued to go heavily short. That MAY ICL is visible on the COT, but it barely changed really.
.
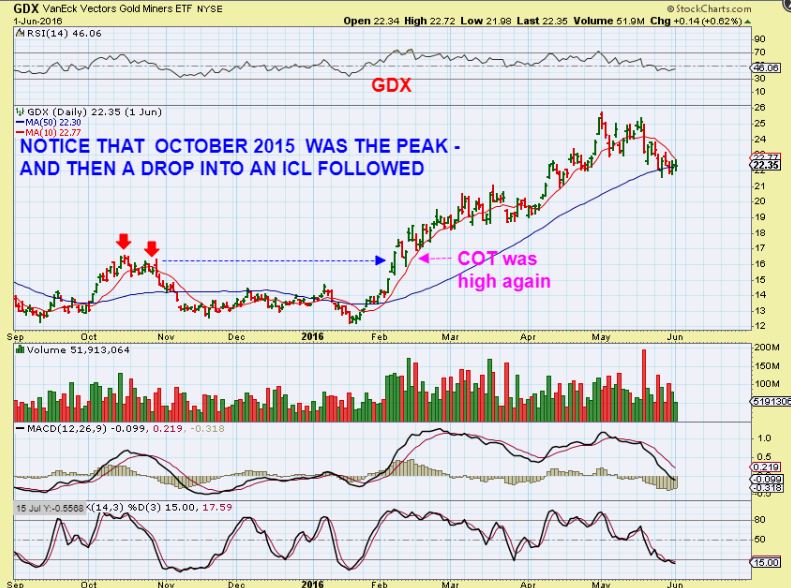
GDX 2016 – So on this chart I am showing that by FEB 2016 that Rally out of the ICL had the same heavily short reading as the OCT 2015 ‘PEAK’ , but it just kept running, and the COT kept getting more & more smart money short. Eventually SmartMoney made money in the Aug 2016 drop.
.
I hope that this was easy enough to follow. My conclusion is this …
.
-WE HAVE AN ICL IN PLACE, AND WE ARE EARLY IN THE INTERMEDIATE CYCLE. THIS SHOULD GO MUCH HIGHER. WE ARE ABOUT TO BREAK FROM A MASSIVE BASE ( remember that 2008, smaller base).
.
The break from the GOLD 2008 BASE rallied Gold sharply, despite the COT continuing to pile on the shorts. Our current base is much larger.
.
In the weekend report , I still wrote this…
1. A dip at resistance here( with a COT reading & FED MEETING) could scare people, knocking them off of the Bull before it runs away
2. It may even cause shorts to go short heavily. Then they’d have to short cover if it broke higher in the next daily cycle, causing a break out to new highs.
.
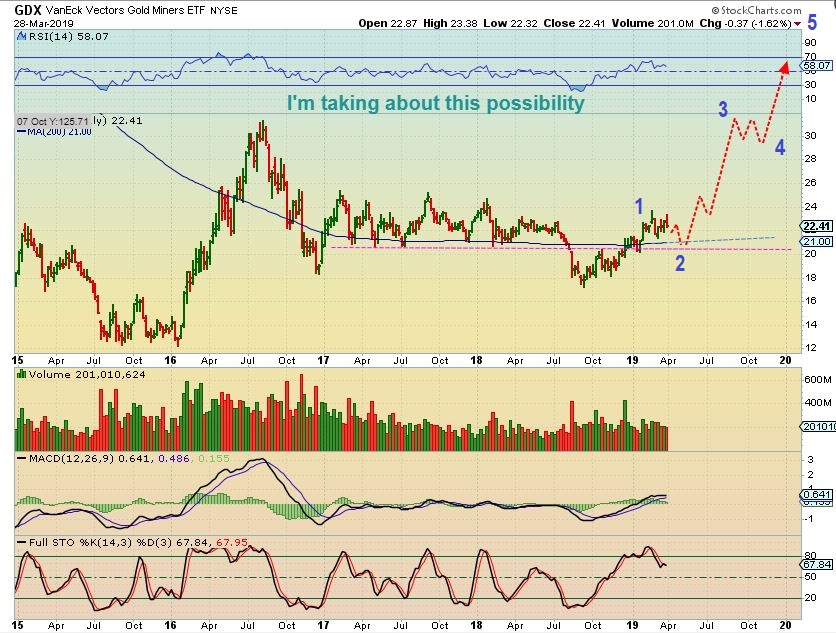
AND SERIOUSLY, HOW LONG HAVE I BEEN POSTING THIS CHART, EXCITED ABOUT THE POTENTIAL? A drop to ‘2’ and a reversal was a STRONG BUY. A BUY & HOLD FOR A CORE POSITION…
GDX WEEKLY – That drop to ‘2’ happened & reversed at the last Fed Meeting in May.
Whether this weeks meeting has us drop to a dcl or break out and fly, you want to still be invested in Miners for the long run in my humble opinion. Leverage is optional, based on your entry, risk tolerance, etc.
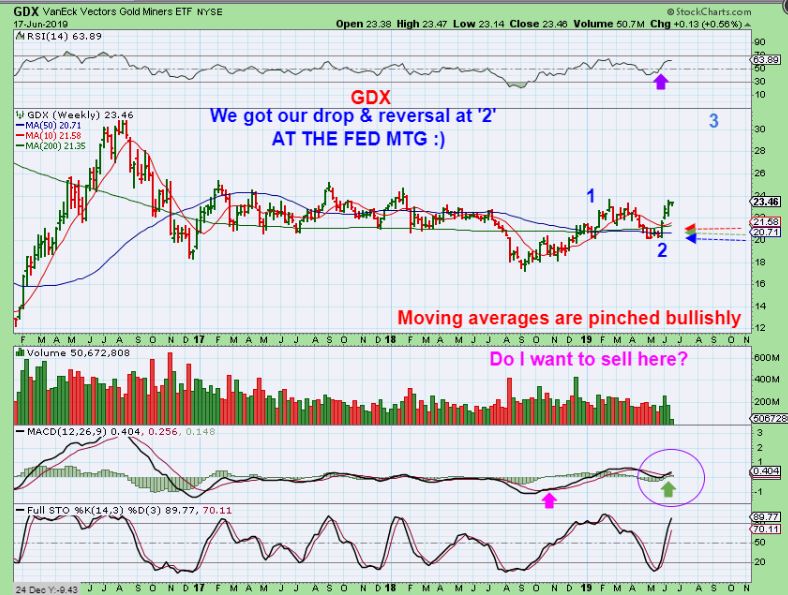
This remains a very Bullish looking set up. 
.
Note: I have some newer subscribers that joined us over the past 2 weeks, and I want to welcome you and say thanks for trying out Chartfreak!
.
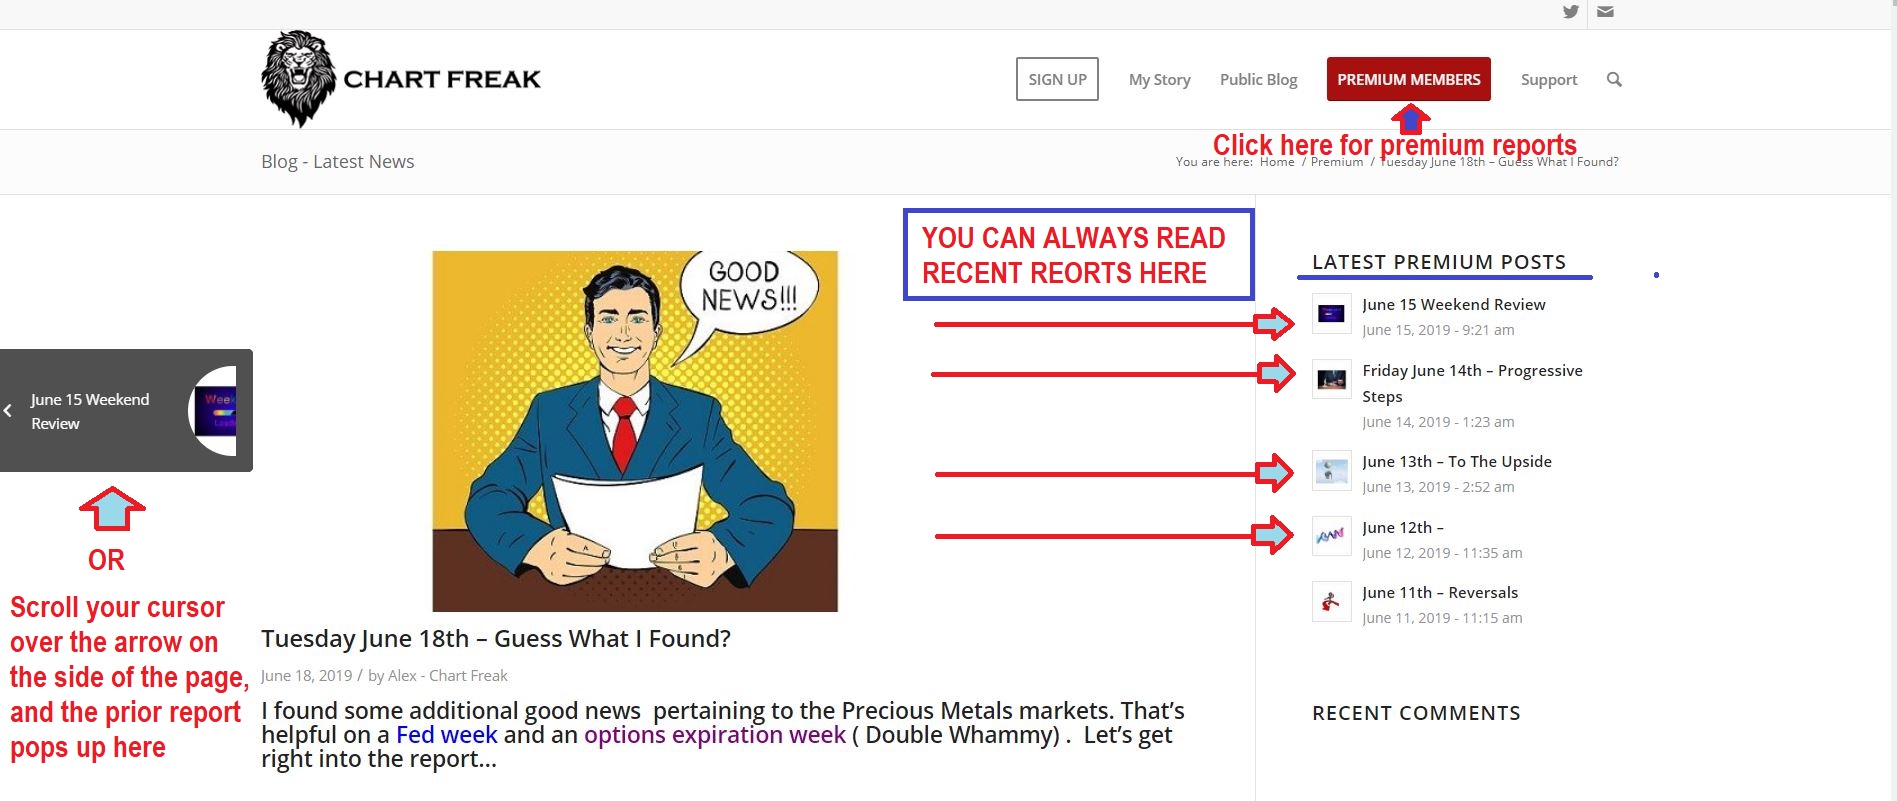
In answer to an email about reading past reports, I have taken a screen shot of today’s report. Click on it to enlarge it.
1. You can click on the red Premium tab and the latest reports should show up in order on the main page.
2. On the right side of the page, you can see that we have a column with the latest reports listed ( red arrows).
3. You also can quickly access the last report by running your cursor over the left side of the page and a tab pops out, as seen here. Click on it. To get back, there will be one on the right side too, or click on the Red Premium Tab again.
4. Thanks again for being here, feel free to email me any questions that you have.