
June 21 – On The Run
.
If you like the color GREEN, today was a good day for you to look at the markets, because just about everything was moving higher, except for inverse ETFs and the USD. Let’s take a look at our markets…
.
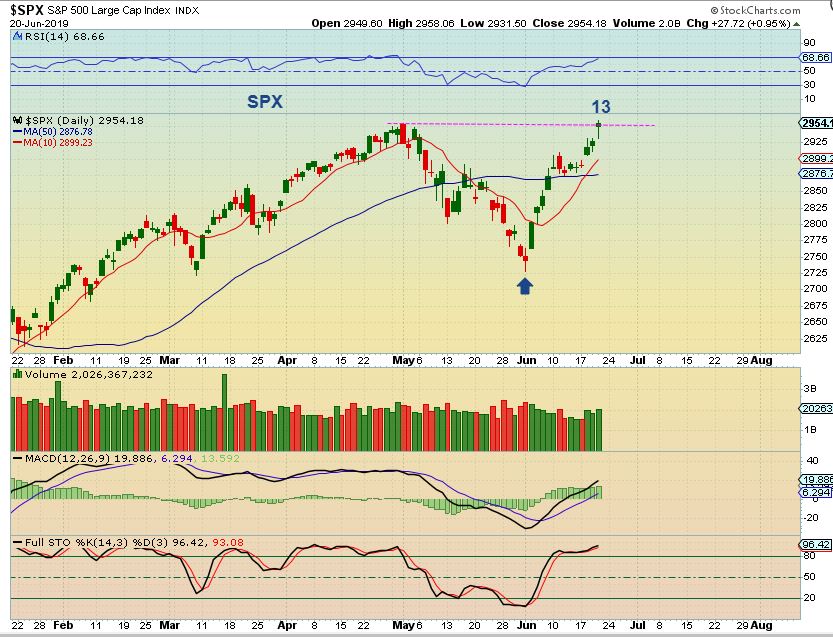
SPX – The General Markets moved higher following the Fed Mtg. We see a new high on day 13, with a possible topping candle ( may just be short term). Now we’ll see if this is followed by a pull back, and if so, I’d be looking for support at the 10 sma or 50 sma.
.
Tuesday and Wednesday I wrote:
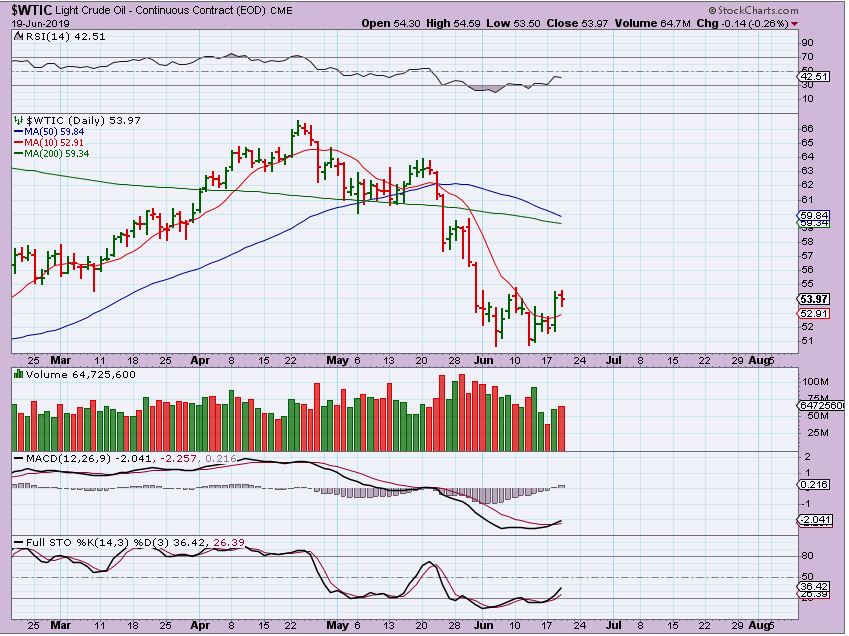
WTIC – Oil broke out above the 10 sma and is bullish above that 10 sma.
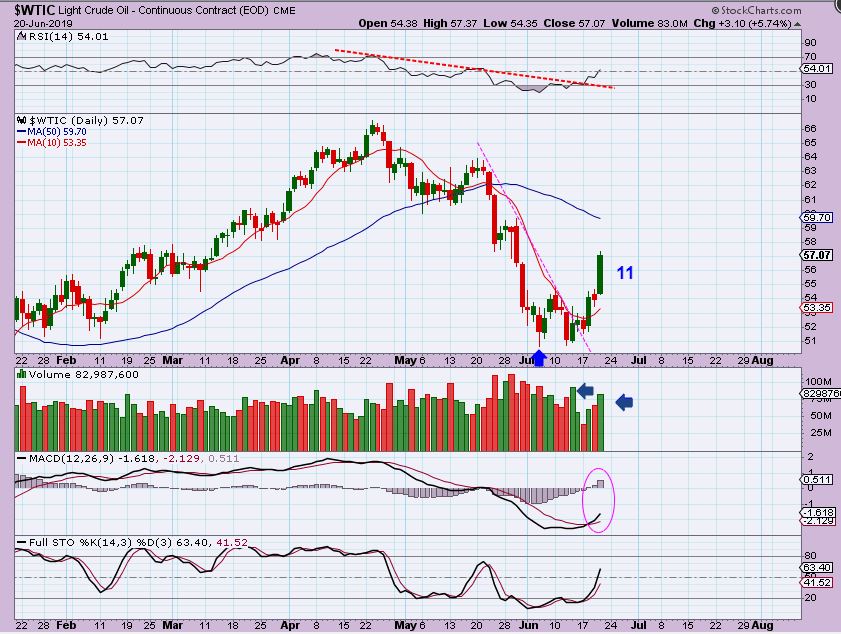
WTIC – Oil had a strong follow through day after breaking above that 10sma, signalling quite an early DCL ( day 21) after the attack was made on a tanker at sea and the threat to Oils supply route is in place. Did Cycles fail us? No, it was a short daily cycle, but easily recognizable. As soon as Oil moved above the 10sma 3 days ago, it was a flip to long, or ‘close shorts’. Oil simply stopped selling off when circumstances changed & supply was threatened.
.
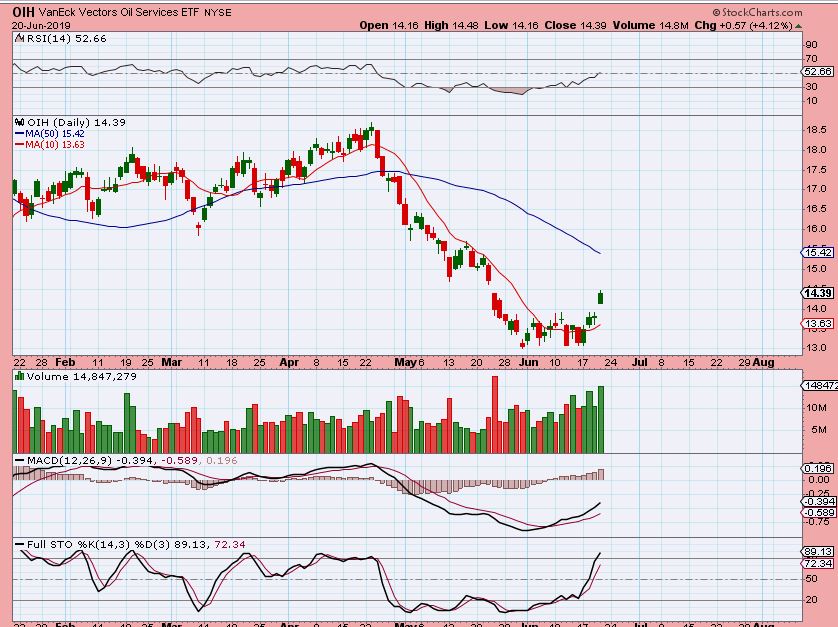
OIH – Volume also picked up on XLE & OIH, so the energy stocks may be bottoming here too. If you have a check list and are interested, some could be bought at the lows with a stop – I am focused on precious Metals currently.
.
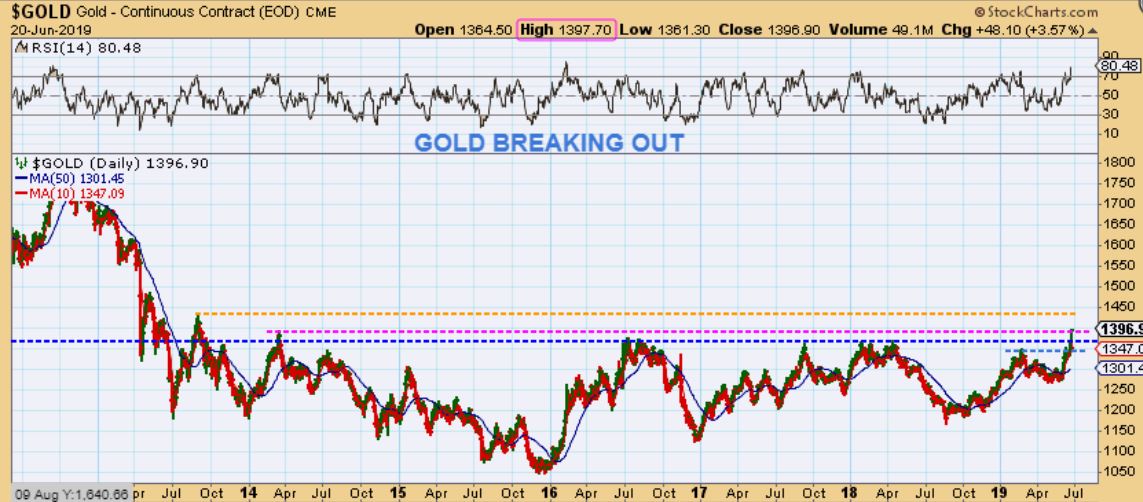
GOLD – Up near $1400, Gold is trying to break out of a MASSIVE BASE. When this break out becomes clear, EVERYONE will see it and the trending move should be bullish / Higher. I will discuss that in the weekend report, it should mean BIG GAINS for those investing in Miners longer term too.
.
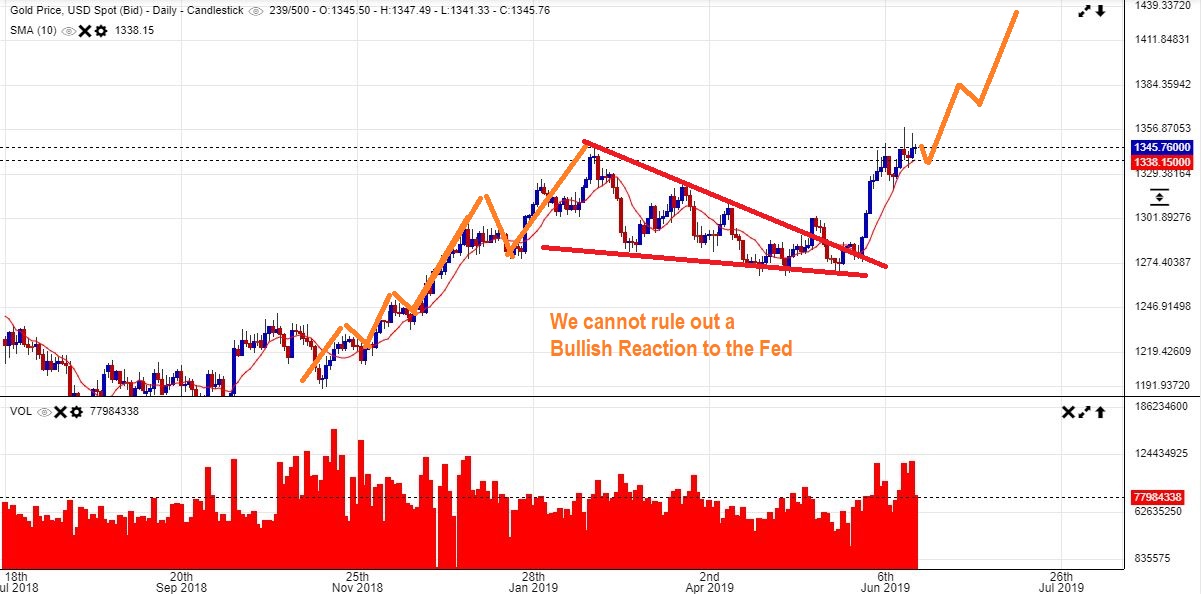
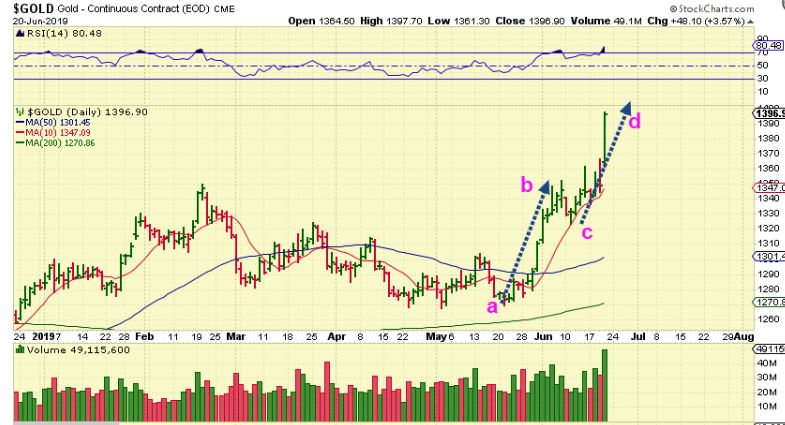
GOLD – I pointed out that after the FED, we could see a strong rally, even though Gold looked extended. The leg that I have drawn here is similar in length to the first leg out of the last ICL, BUT THEY CAN EXTEND EVEN FURTHER USING FIB PROJECTIONS and I expect a higher target before we are done with this intermediate cycle…
.
GOLD – We certainly did get our Post fed POP to $1400. This CAN keep going higher, there are several overhead ‘targets’ . Let’s quickly discuss that…
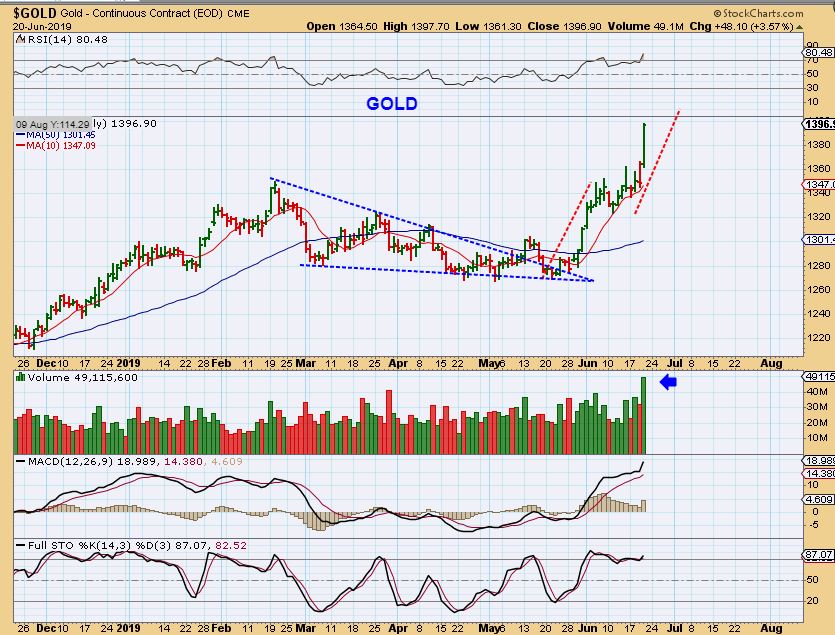
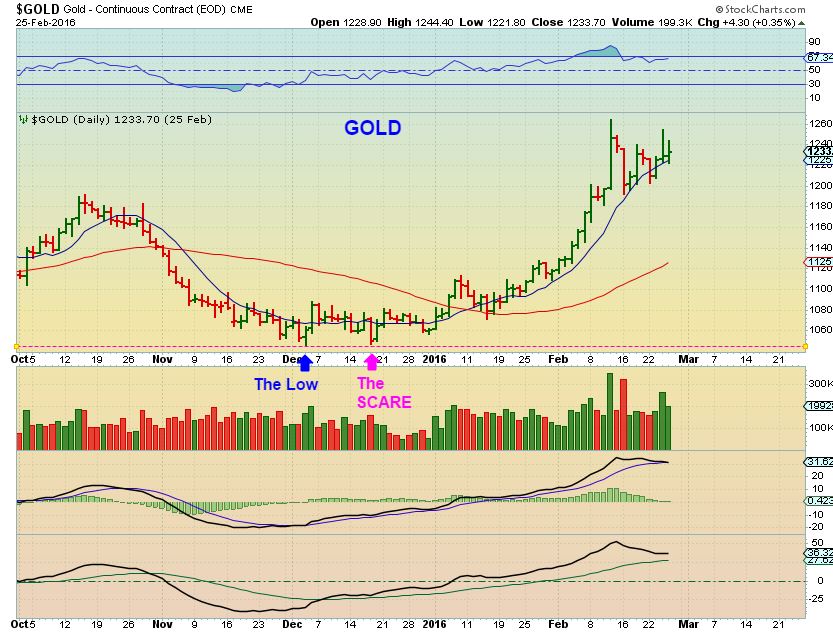
GOLD – The first target has been met, so it MIGHT bull flag or pull back before continuing higher. It also can continue to extend, so selling may not be advantageous. Keep in mind what happened in 2016…
GOLD 2016 – In 2016, Gold had a strong run, a final spike, and then just bull flagged sideways for a while. Ignore the writing, this is a chart from a past report. So again, selling your positions may cause you to lose position
.
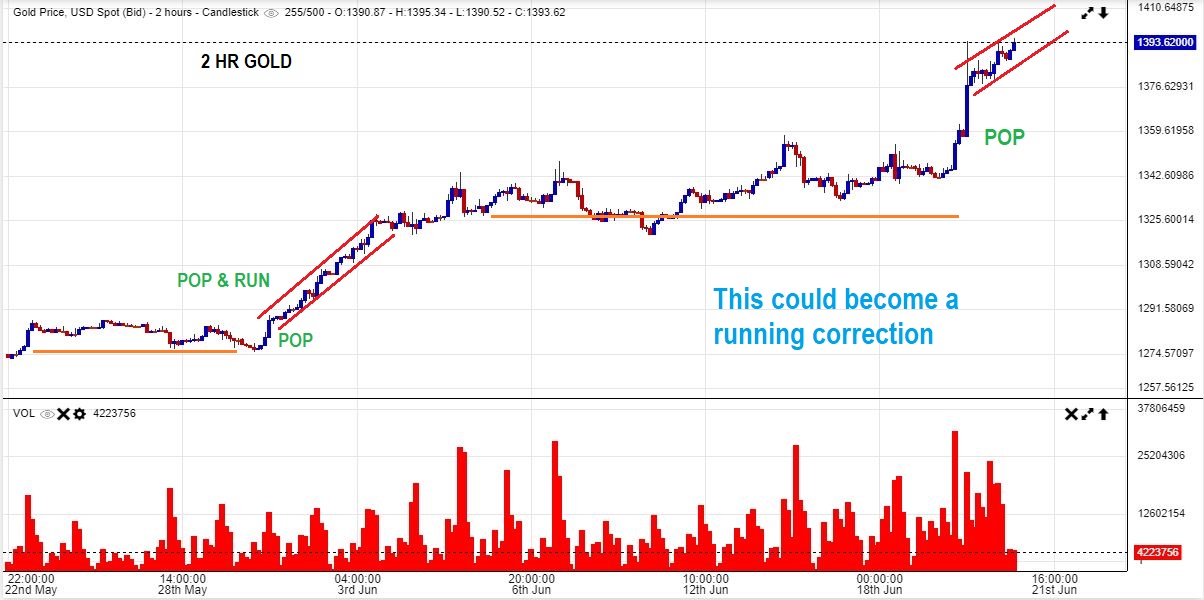
GOLDS live 2 HR CHART at 9.p.m. E.T. – We saw a POP & RUN after a long consolidation in May. We could get that Pop & run here too. If so, Gold will be higher in the morning and breaking from that massive base.
.
YESTERDAY I WROTE:
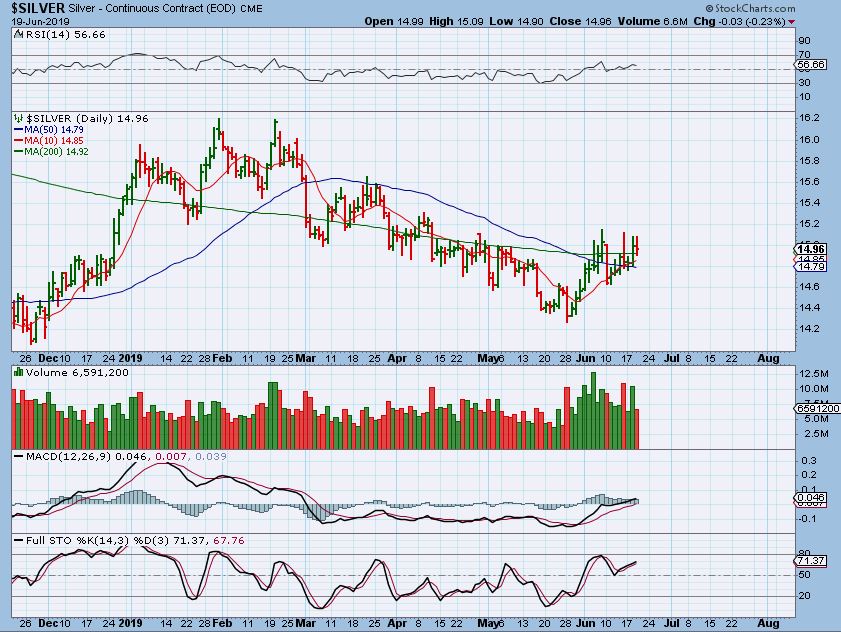
SILVER -Obviously Silver is lagging, but I think that it will play catch up quickly, and I’ve mentioned that Silver Miners should be a good investment going forward.
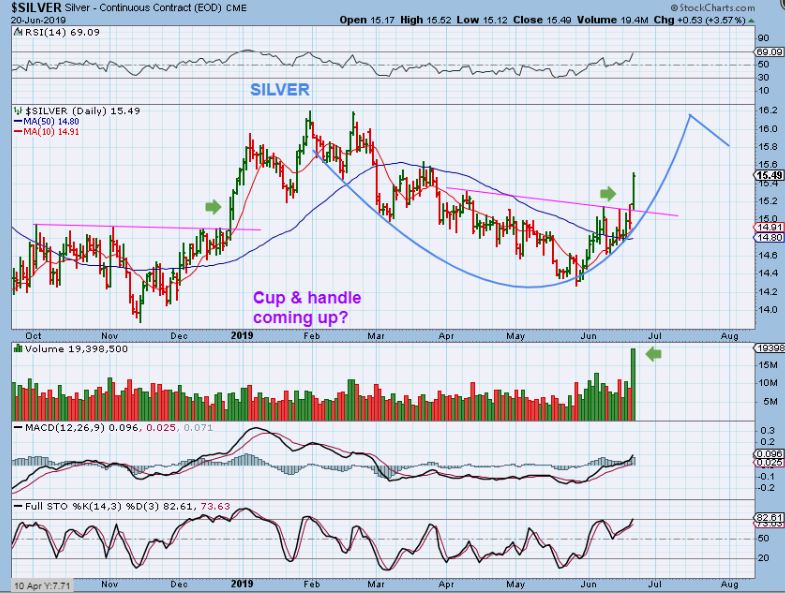
SILVER – We had a very nice day of catch up. Silver looks like it wants to continue higher and maybe this can now form its cup?
.
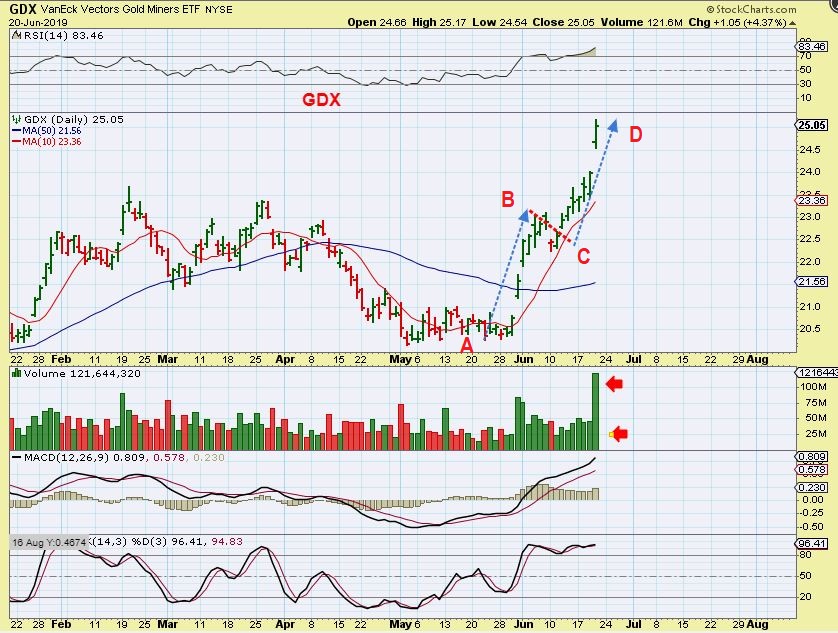
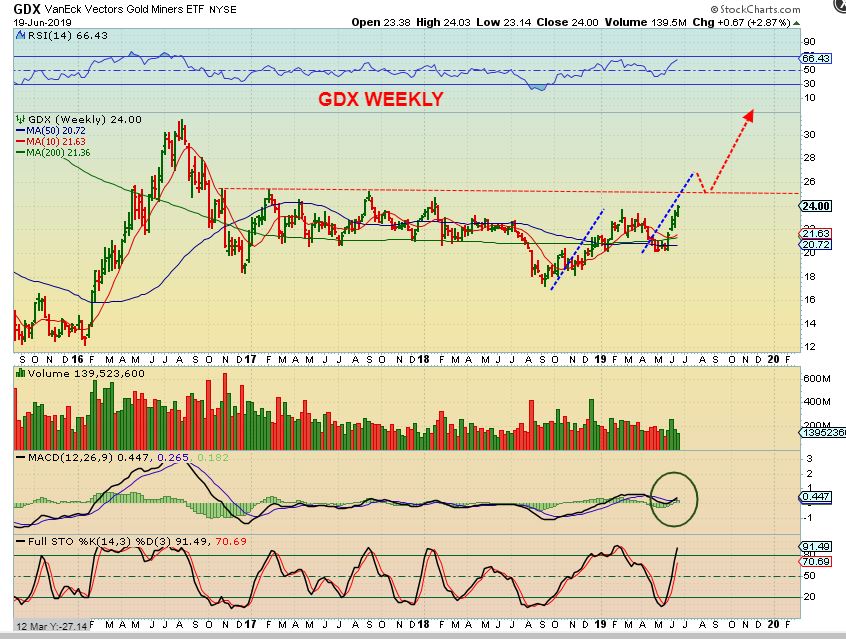
GDX – The 1st measured move on GDX ( A-B=C-D) has been reached, but this can still go higher since there are other targets. So if this is a high volume temporary top, this may bull flag and fill that gap, or it may dip down over time. There is no way to know for sure when things start to trade in extremes, but let’s look at possible cycle counts.
.
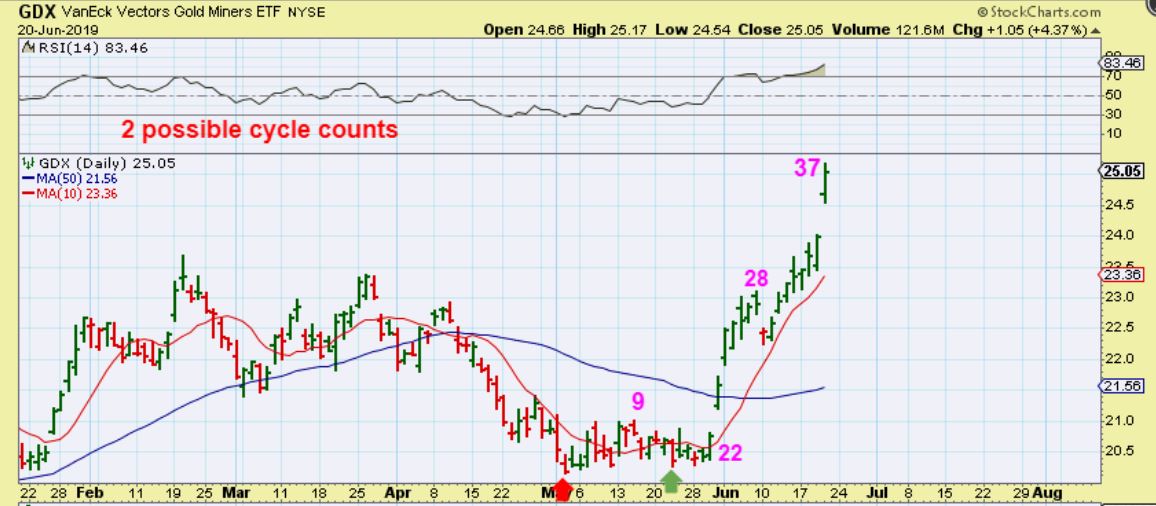
CYCLE COUNTS ARE NOT CLEAR DUE TO THE FLAT BOTTOM & STEEP RUN. I can think of 2 possible cycle counts. I have been ignoring Cycle counts for the most part to avoid jumping out of my positions from fearing that our daily cycle is late. In 2016, selling before a dcl did not pay off. LET’s TAKE A LOOK AT OUR CURRENT POSSIBLE COUNTS…
.
GDX CYCLE COUNT #1 – This seems most likely. This count would have us in a long first daily cycle. Since it started with a base, the run was steep. A Dip to a dcl would be due. Again, it could bull flag or dip down & fill that gap from here. The next chart shows a dip…
.
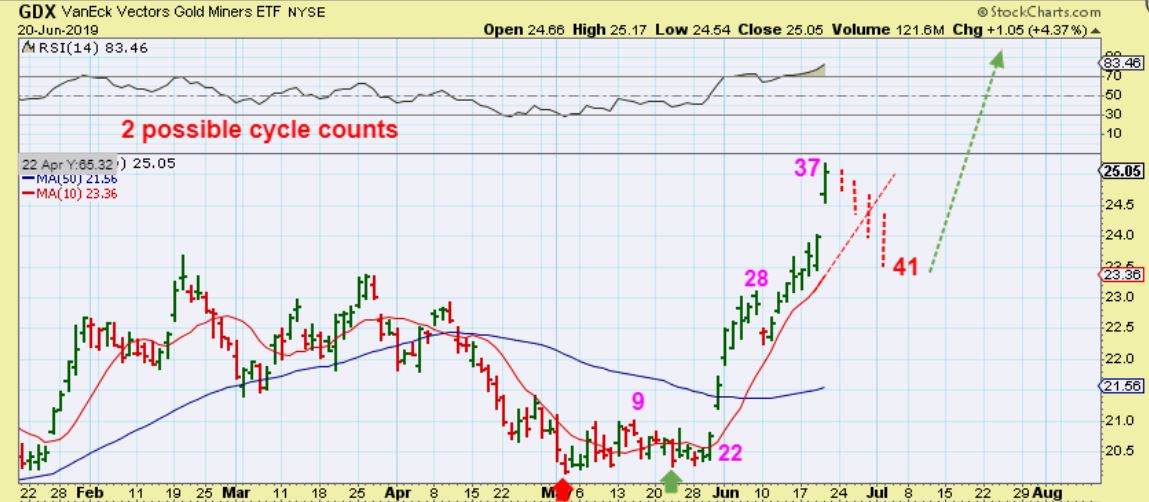
GDX – The break of the 10 sma , an uptrend line, and a gap fill. Would you sell into this dip? That is your choice, but you may lose position. In 2016, selling often left people behind when the next run started…
.
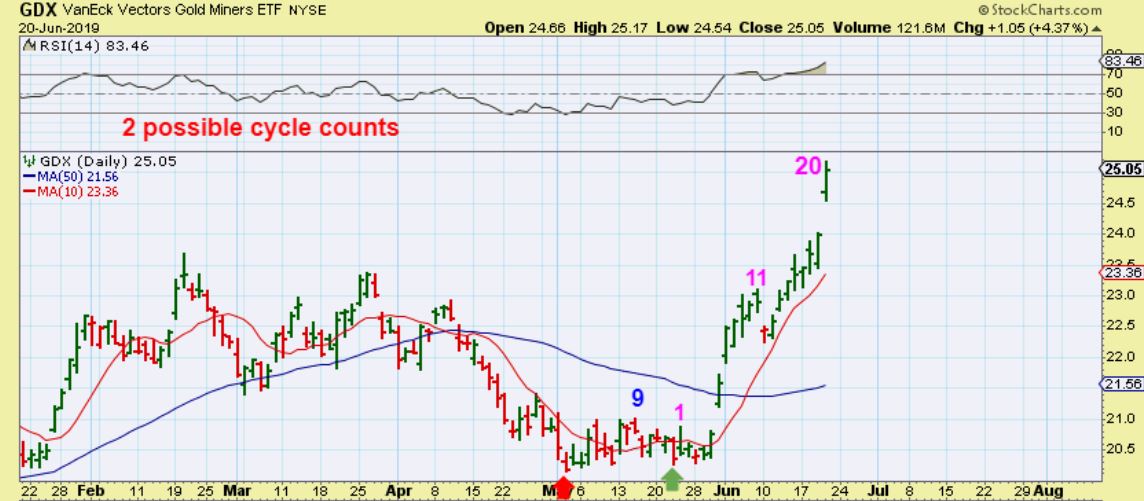
GDX CYCLE COUNT #2 – This would assume that we started with a very short lack luster base as a 1st daily cycle, and then after breaking under the 10sma for a dcl, a run higher would have us on day 20. If that was true, this could go even higher and then flag or drop later. Another reason why selling could be risky.
.
Let me share some emotions with you in a run like this. I have some writing to me saying,
“I got caught off guard. I know you were pounding the table on holding miners, but I sold mine a week ago and Missed the Fed run. Where can I get in? Is it OK to just buy here? ”
And then I also am getting emails saying,
” We MUST be due for a dip, I want to hold my gains, should I sell everything and wait for the DCL to re-buy, or just sell half?”
.
Mixed emotions on the very same trade.
.
So some not heavily invested feel they are missing the rally and want to buy now, but certainly are concerned about chasing & buying just before a dip. Others that are invested heavily are really seeing the gains add up and want to sell and lock in these gains. What is the right answer? Honestly, it is an unknown as to how exactly this will play out best. I have been saying for weeks that you want to buy at the lows and ride it, so you can comfortably ride this out without chasing and not have to worry about positioning midpoint in the run. We may be facing unique conditions, like a MASSIVE base could break out soon, and the Fed will cut interest rates. With that, and many being VERY BEARISH MINERS Just 2 weeks ago, it is not possible to know exactly how this will play out day by day. Getting in near the ICL and letting miners ride is easier on the mind.
.
I am going to show you 2 charts. Obviously, all miners run differently, but as we approach a possible Massive Base in Gold, GDX & GDXJ breaking out higher, we could get a flood of buying & short covering as bases break out. I advised not to sell everything, and this is why. Look at GDX HERE, and look at GDX in 2016 on the same chart ( what dip would you buy in 2016?). EVEN MORE SO…
.
EVEN MORE SO, look at CDE in 2016.
1. I see the ICL in January, do you?
2. I see the ICL in May, do you?
3. Between those 5 months, or even from May to August, where would selling everything to buy the dip have paid off? Enough said, I can’t tell anyone to sell everything. We bought the ICL, and riding it out could really pay off. Sell some if you want to lock in gains and try to buy lower, but this chart says a lot.
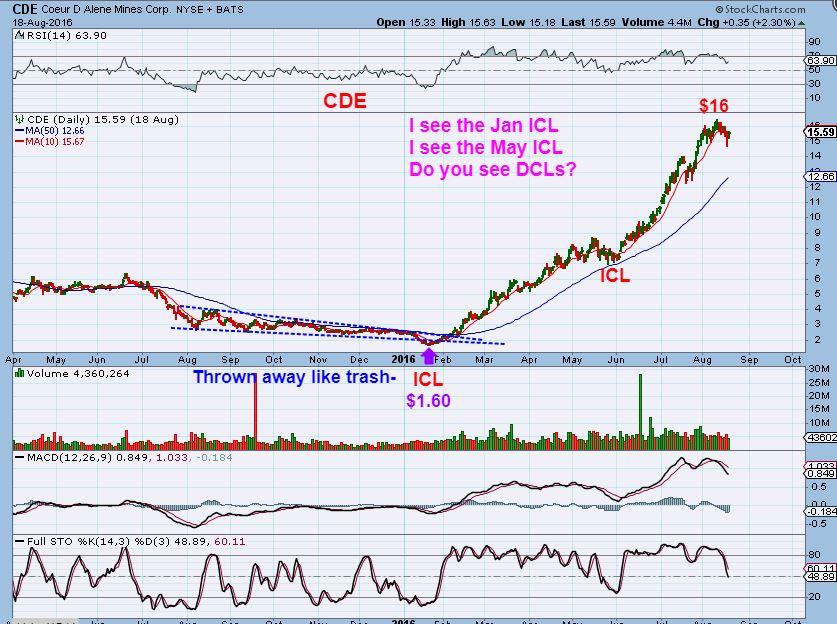
Obviously, I cannot tell you where to sell now, because based on that chart above, there was no re-entry. We may be at the start of a big multi-month run in beaten down, shorted, much hated miners that could rally big time. Using stops to protect gains is my advice, and if you want to sell? By all means sell a little if you want to lock in gains. That’s up to you, and if we get deeper dips, you can re-enter. You may choose to sell extended runners and buy laggards too. I bought Miners at the lows, and I want to ride them higher as a basket.
.
Below I will discuss a few miners again. Enjoy your Friday Trading!
.
~ALEX
.
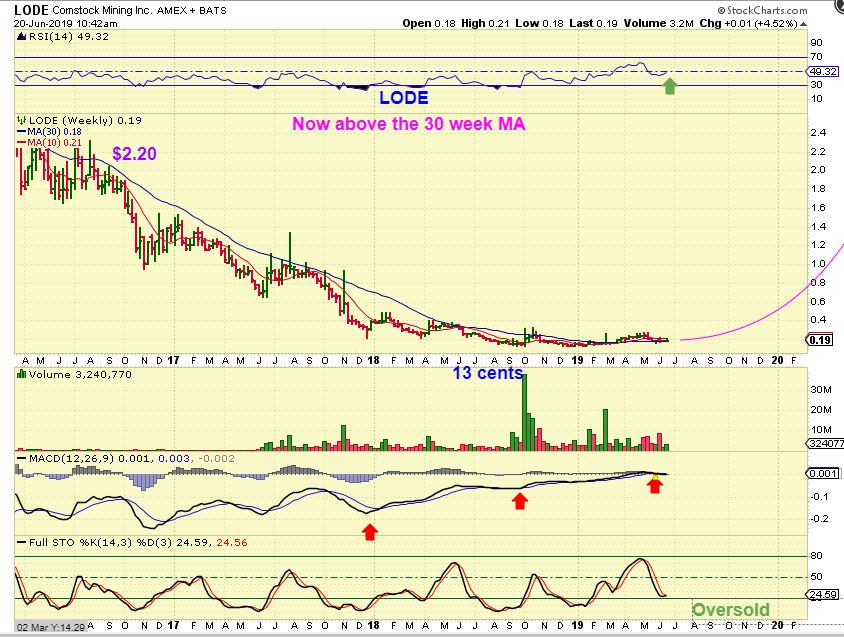
LODE – Lode started to break higher again, and this has been a lagging…
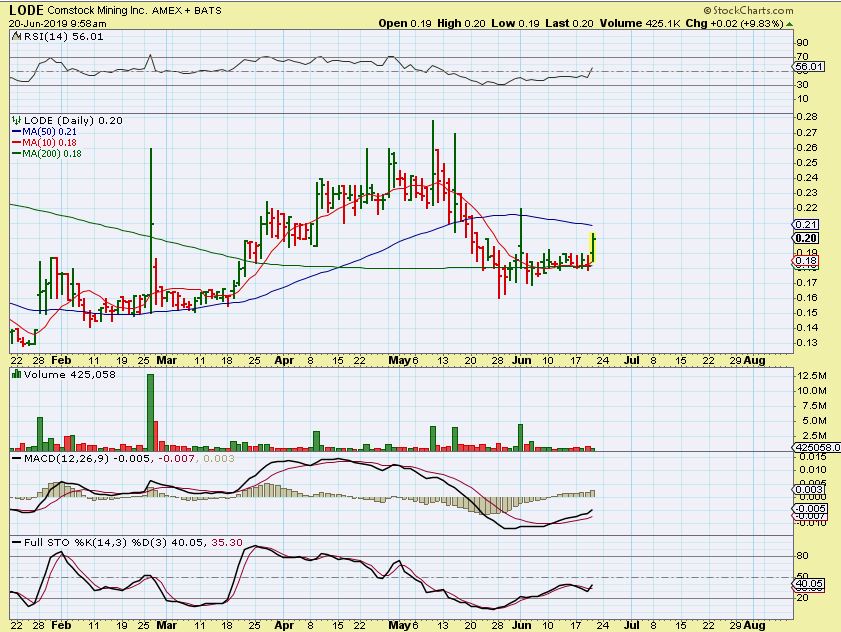
LODE – The Big Picture shows great potential once this gets going. This is a 3 year drop and may take time to recover, but if Gold is at $1700 in the future, I feel that these beaten down Miners will get scooped back up.
.
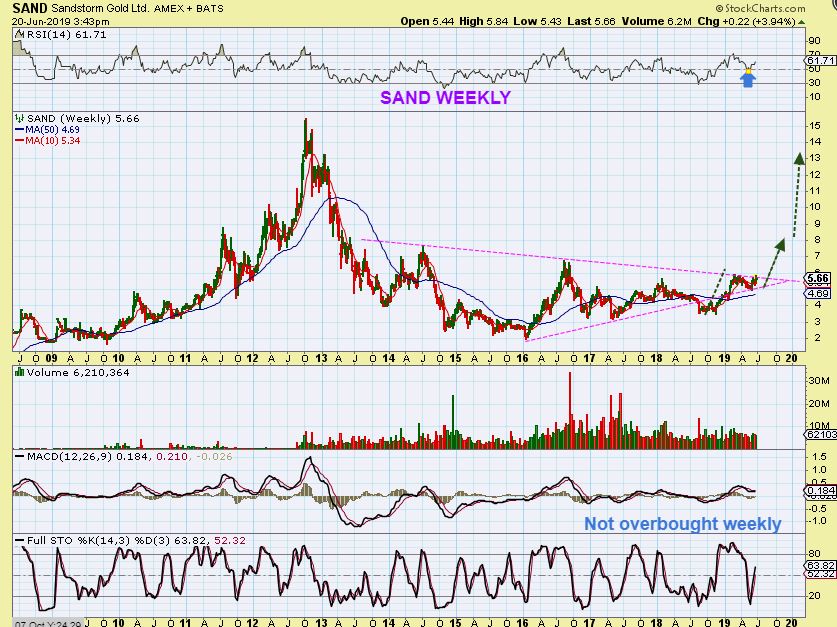
SAND – Sand popped and closed that gap. Is this weak? No, look at that November run. This has been consolidating those gains and…
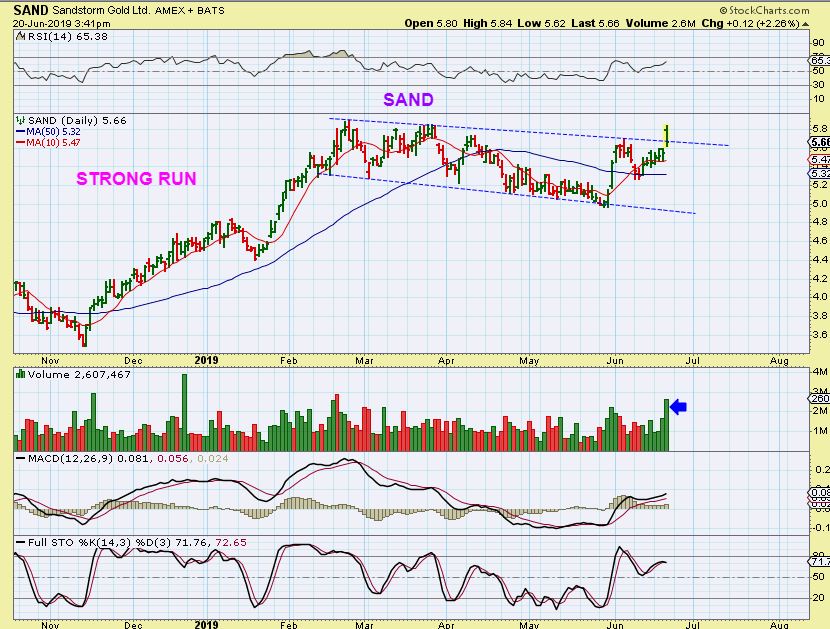
SAND – SAND is really in a Giant base too, and is at the next resistance / break out point. It ran $3 to $7 in 2016, and has almost doubled from August lows. I think it will run nicely once it gets out of this base.
.
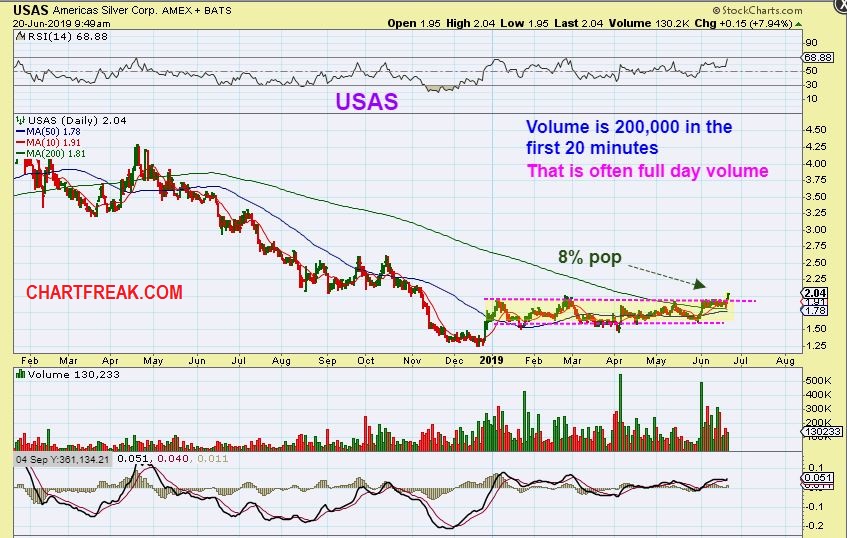
USAS – I posted this this morning in the live trading area at the bottom of each report. USAS just started breaking out, so this is a Silver Stock that may just be getting started.
.
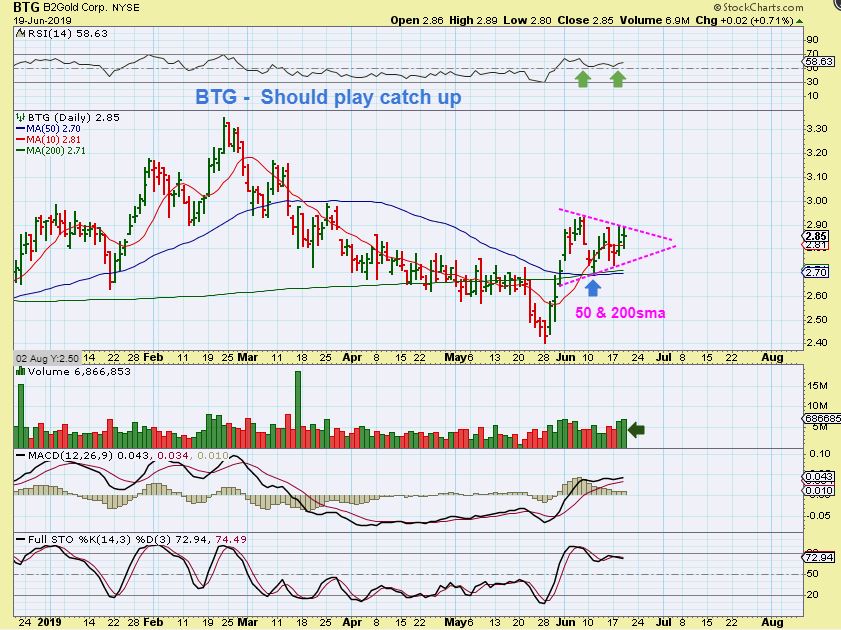
BTG – I posted this on June 12 as a buy at the back test of the 50sma…
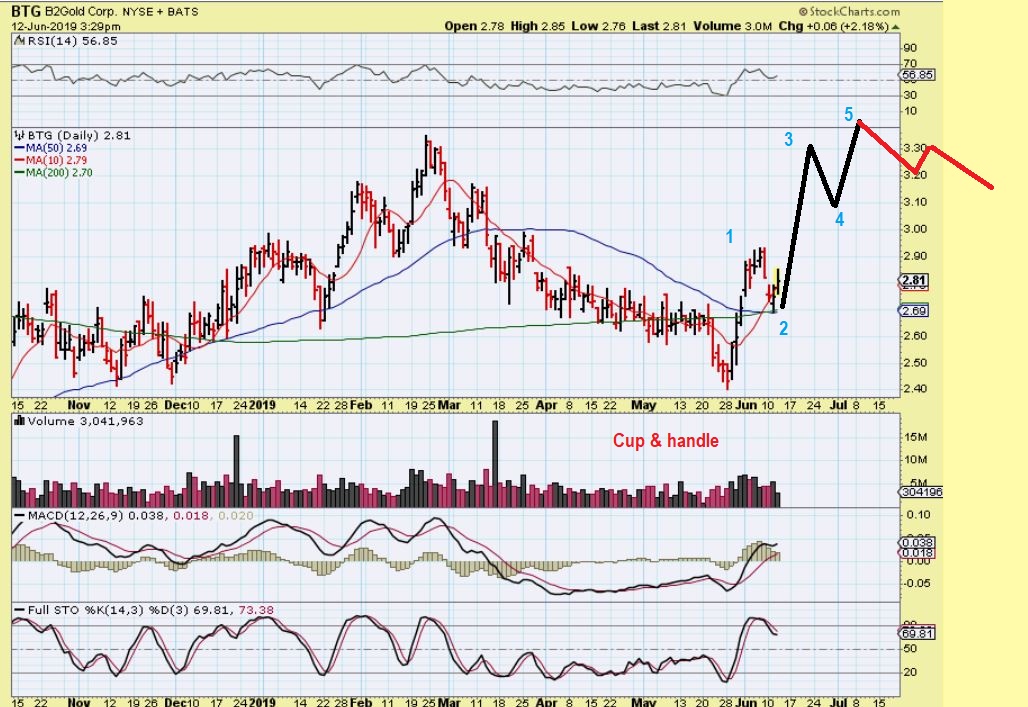
BTG – It formed a flag, I posted this in yesterdays report.
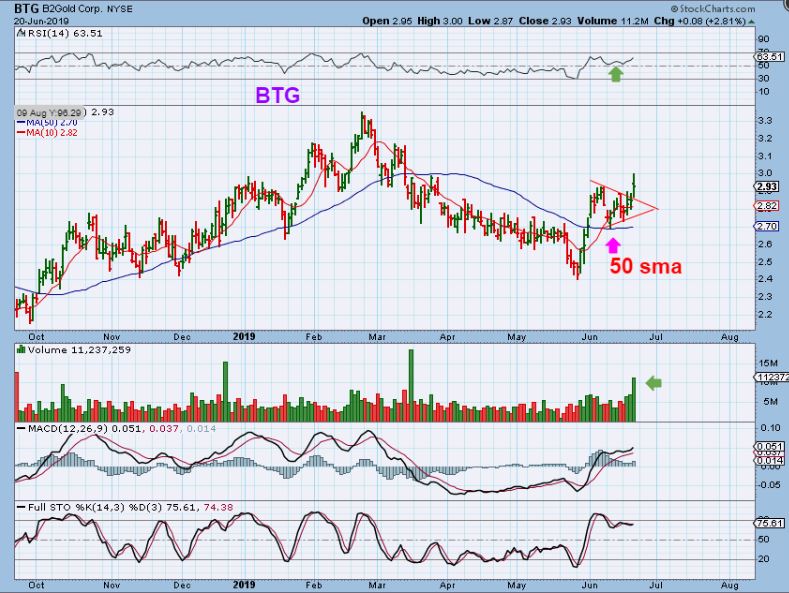
BTG – It Popped and dropped to close the gap. I still like this. I know that on a day when Gold is up $24, this should be flying, but the set up is still healthy and the Volume was excellent. It is a laggard and a low risk buy. And…
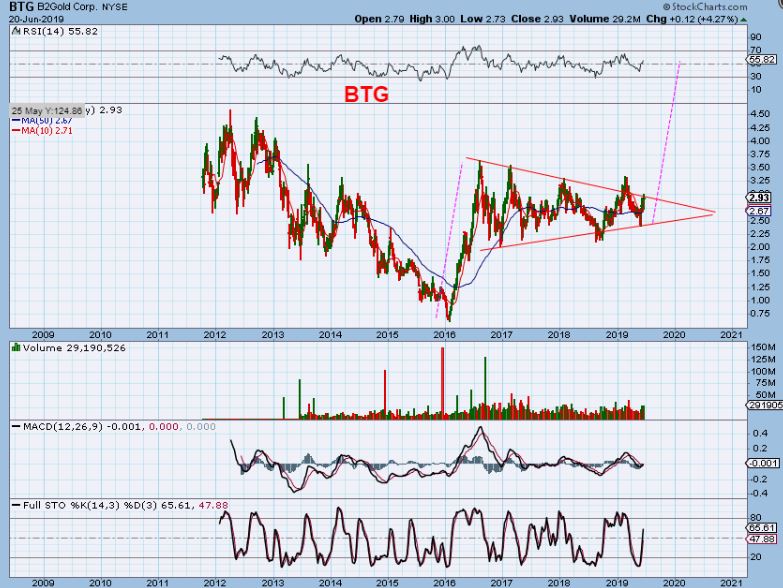
BTG WEEKLY – This is a BIG multi-year flag consolidation. It could run the same as it did in 2016 on that flag pole.
.
AUY – June 3, I posted this as a Shake out at the lows. Buy at $2.
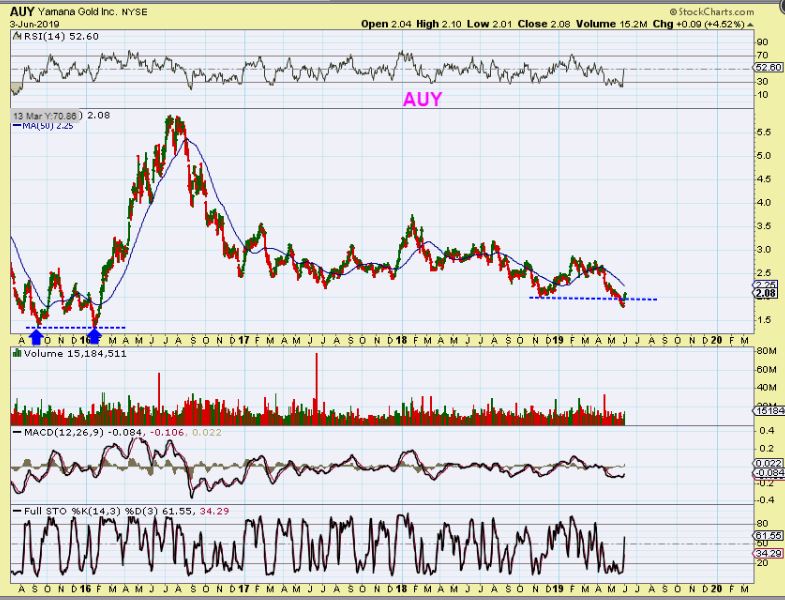
AUY – higher lows, climbing the 10sma, I posted this earlier this week as a lagger that could play catch up. Buy at $2.21
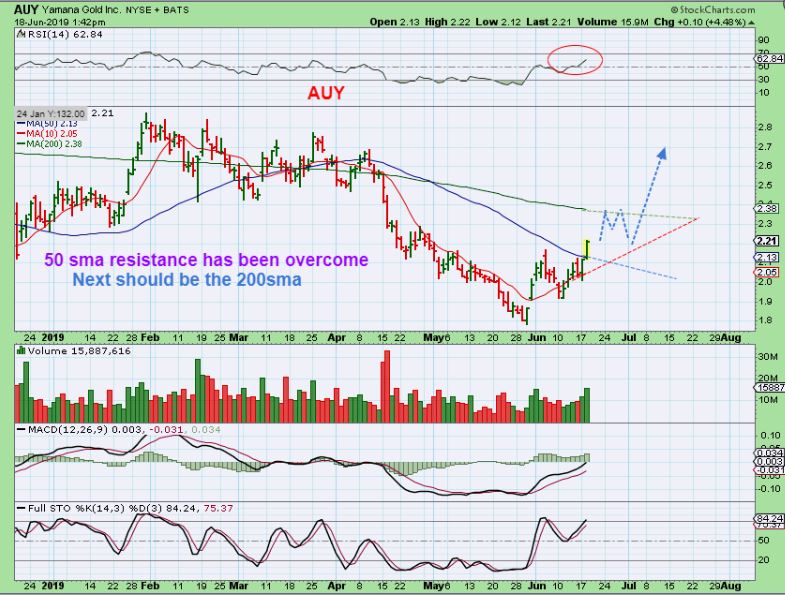
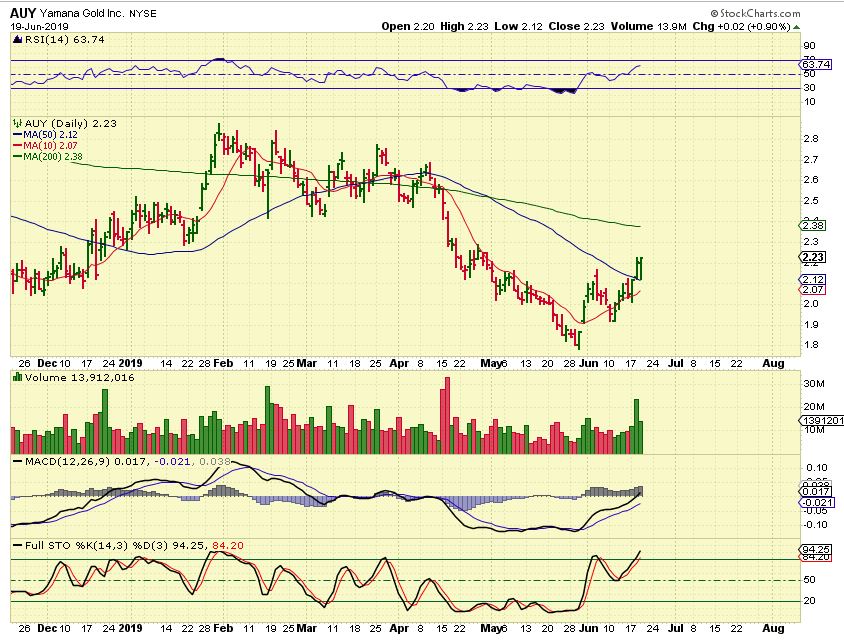
AUY – One more chance, since it dropped to the 10sma & bounced…
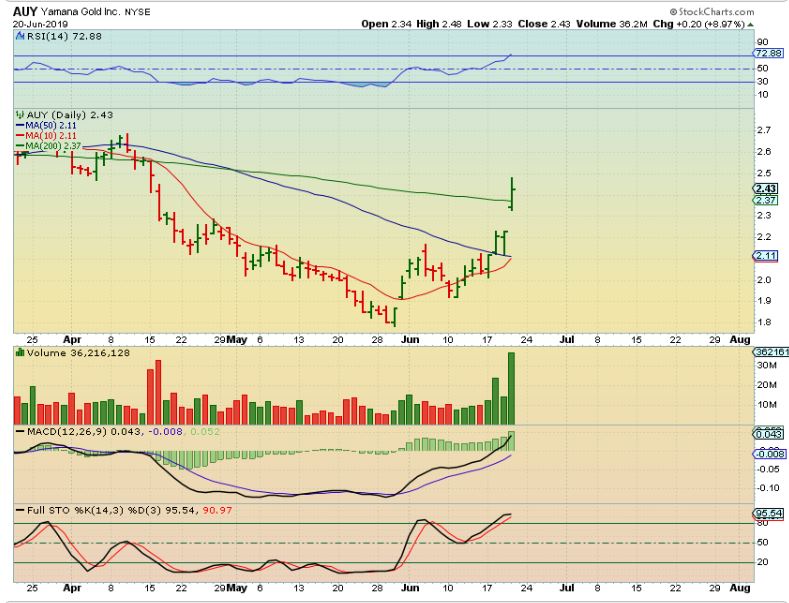
AUY DAILY -Boom,now it is $2.43 and breaking that 200sma. The Laggards are catching up.
AUY WEEKLY BIG PICTURE – And the potential is ridiculous if these recover over time. Imagine $2 to $18? Impossible? No, CDE did that in 2016.
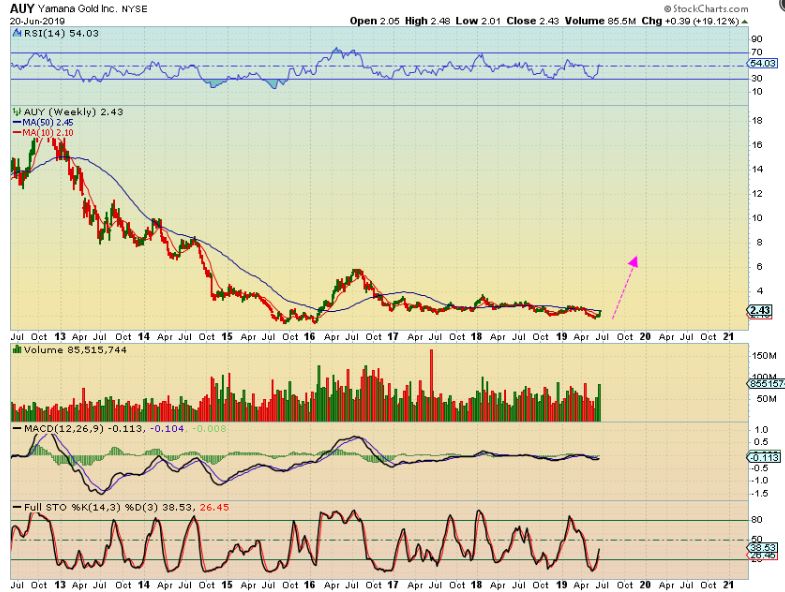
CDE did that in 2016 in just 7 months!
,
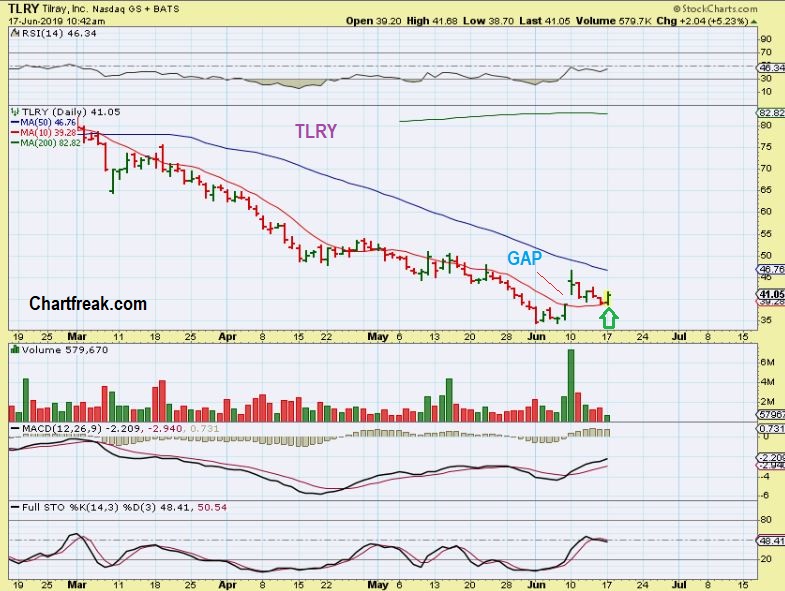
Other stocks are perking up as expected too, but I am really trying to focus mainly on Miners right now. I mentioned CLF, HBM, X, TLRY , CTST, TWST, and a few others.
.
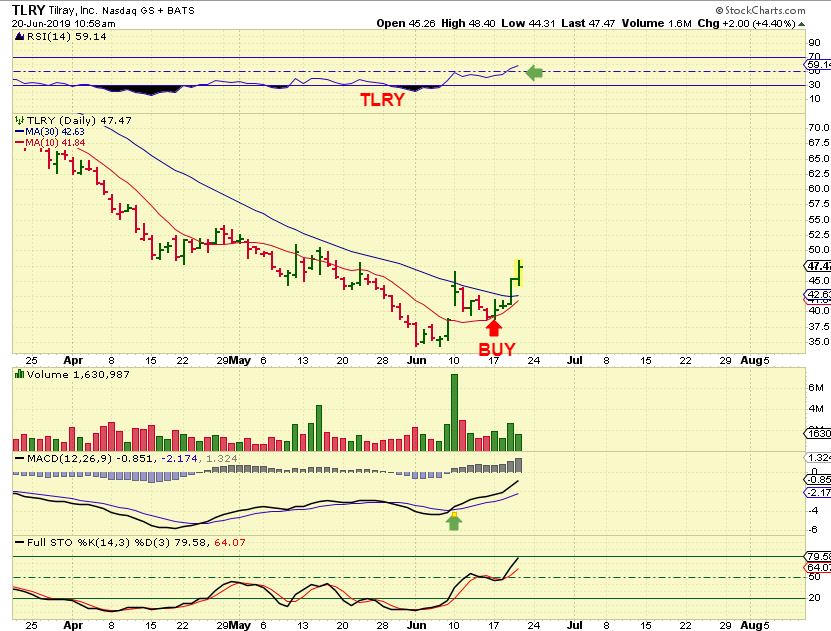
TLRY – This was the TLRY entry….GAP FILL & REVERSE OFF OF THE 10 SMA
TLRY – It is still playing out bullishly. I captured this at 10:58 a.m. and it was at $47.47. It eventually went over $50.00!
.
 , there is no way that I can always release the reports each night. My wife has been working late to finish up projects before we travel this week, and that has allowed me time to do the reports earlier at night from 5-9 p.m. When she is home, she really does deserve my undivided attention from 5-10 p.m., and that time is important to us. It also helps for me to step away, refresh, and come back for another look at the markets later. So then I start the reports at 10p.m. & release them by 7-8 a.m. Thanks for understanding!

