
June 11th – Reversals
The General Markets have been rapidly moving out of their recent lows after the Fed announced that Rate Cuts were now likely, and not Rate Hikes. By moving up Over the prior recent peak, it really changes how the markets look.
.
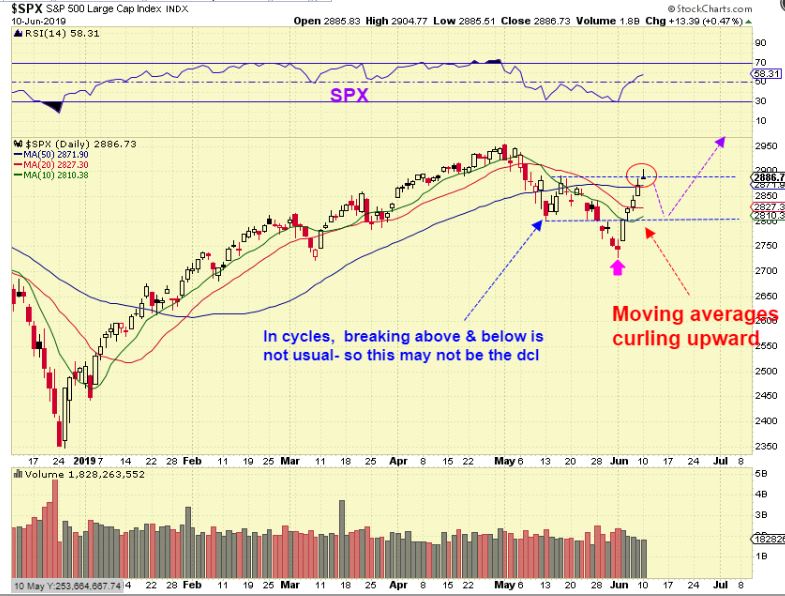
SPX – As explained in a recent report, what looked to be a dcl , was followed by 14 days and another reversal. Was that a short final daily cycle? An extended very long daily cycle? Either way, That new low looks like a dcl, and since it moved above the prior high, we have a higher high. That is a bullish move out of the recent lows.
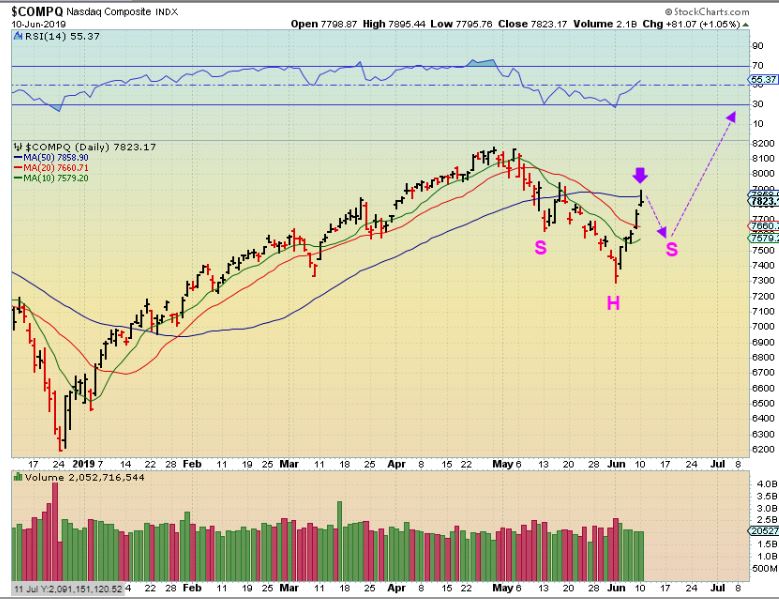
NASDAQ – The NASDAQ seems to have stalled at the 50sma on day 5 and if the recent lows hold up, we could see a higher low and then another move higher, unless it can just push through Tuesday.
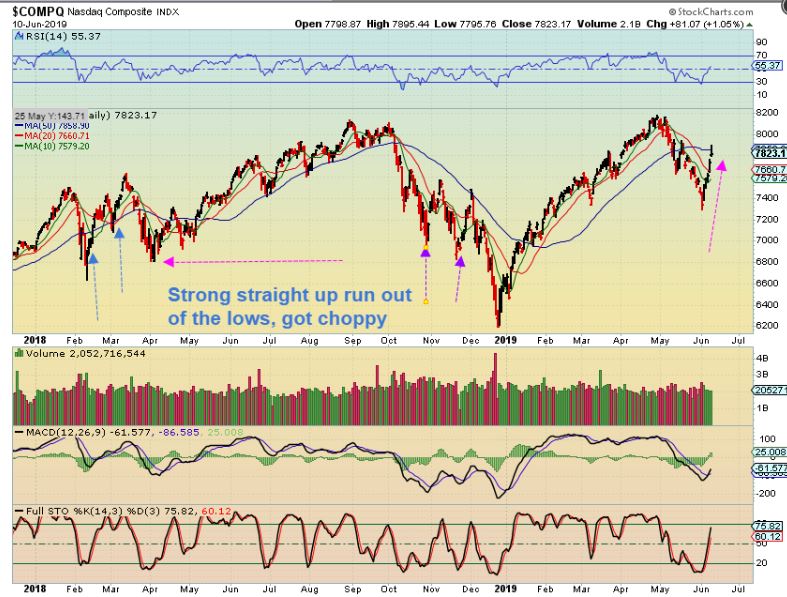
NASDAQ – Just an observation: If the economy is weakening & the Fed Rate Cut is not enough to ‘save the markets’, the fast move out of the lows does not always lead to a continuation, so as always, Use Stops. Prior rallies like this have ended just as quickly as seen on the left side of this chart ( even Oct & Nov of last years sell off , for example).
.
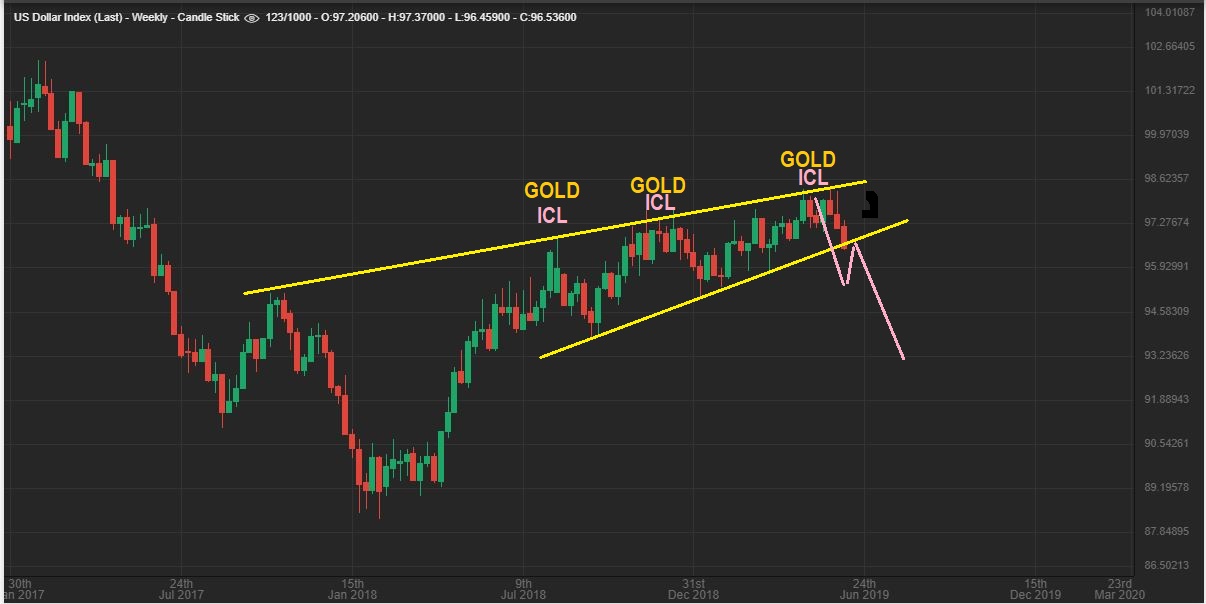
USD – The USD put in a small bounce Monday, but I’m expecting a break down.
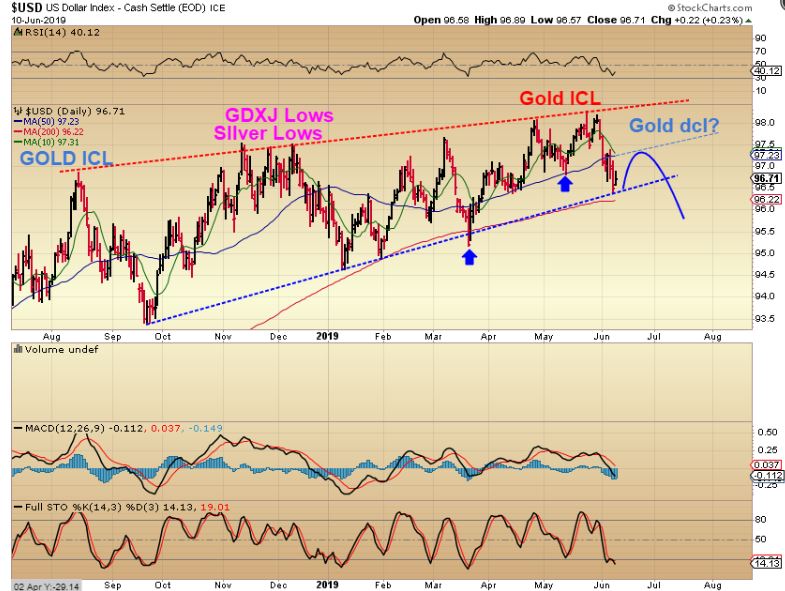
USD – From the weekend report.
.
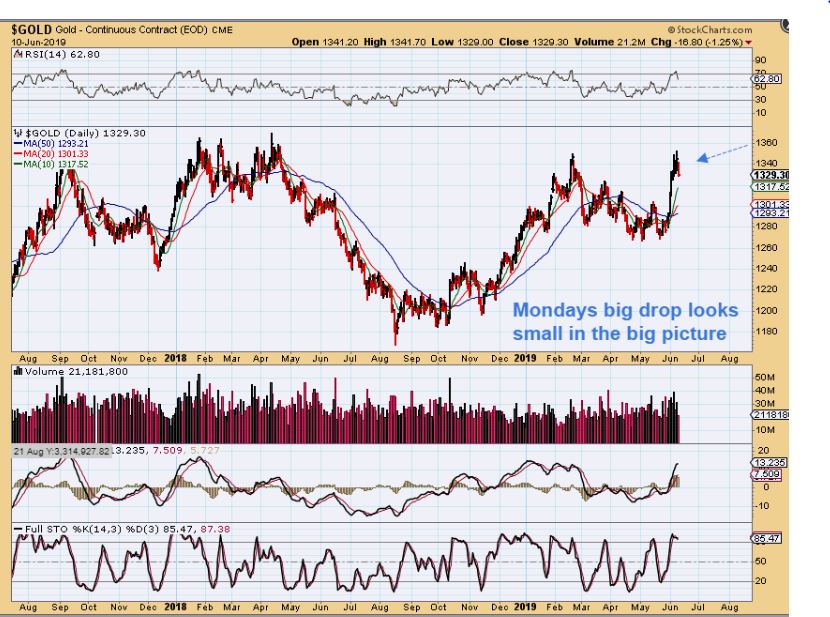
GOLD – Gold started to pull back Monday. It was a pretty big $21 drop from the highs, but we shouldn’t be overly concerned…

GOLD – The rally was a Big Move of almost $100 ( $1267 to $1352) and the drop here looks small by comparison.
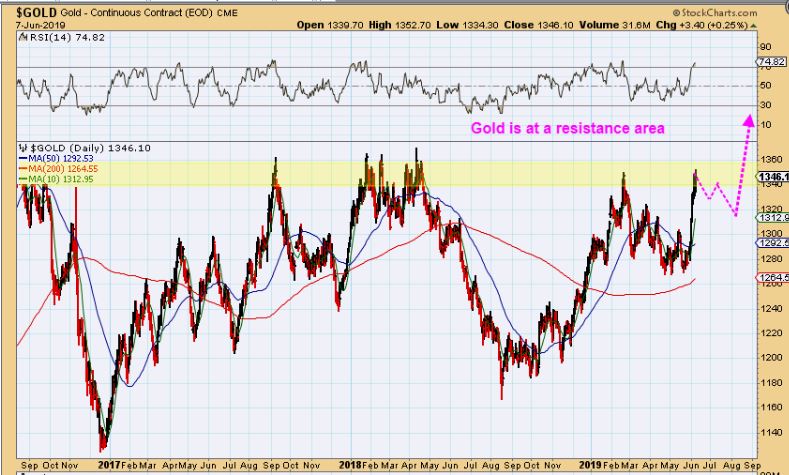
As mentioned: Gold has moved quickly to a resistance point ( yellow shaded area) , and the COT shows that Smart Money went short here . I have drawn in an idea of how this drop to a dcl could play out, and it could take several more days.
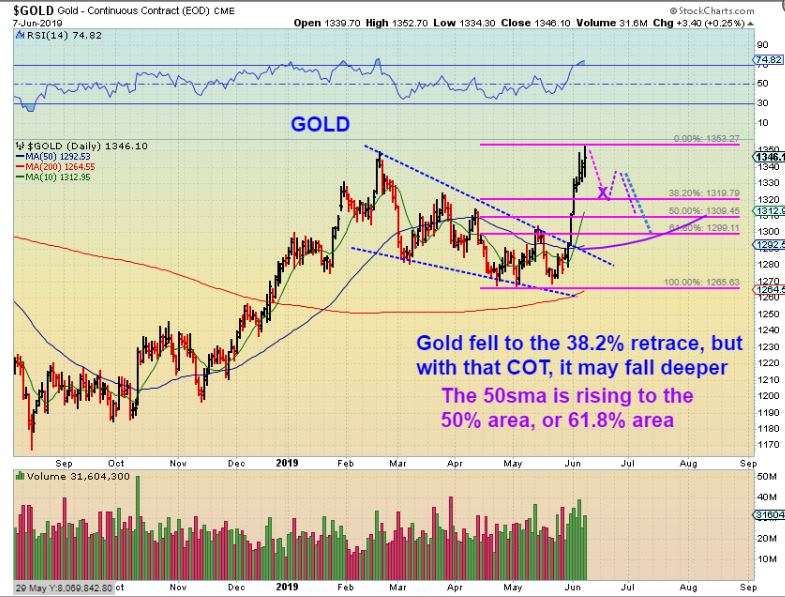
I put out a morning report Yesterdays when I saw the drop. I wrote: Here I see the 50% area or 61.8% area, is also where the 50sma will be. So we COULD drop there over a few days. We already hit the 38.2% area, and that also can offer support, but that COT may be calling for more downside. It will probably not just happen in a day or 2. It could chop around and find a swing low in that area over time ( Next week?).
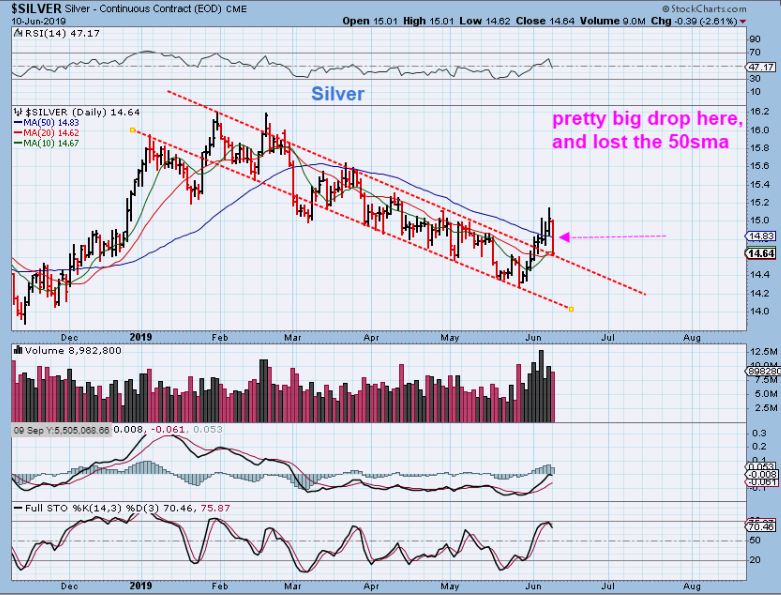
SILVER – Silver had a sharper than expected drop. Since Silver has not rallied as high off of the lows, I didn’t expect this big of a drop. It broke back below the 50 sma. Some SILVER STOCKS were able to ignore the Silver drop.
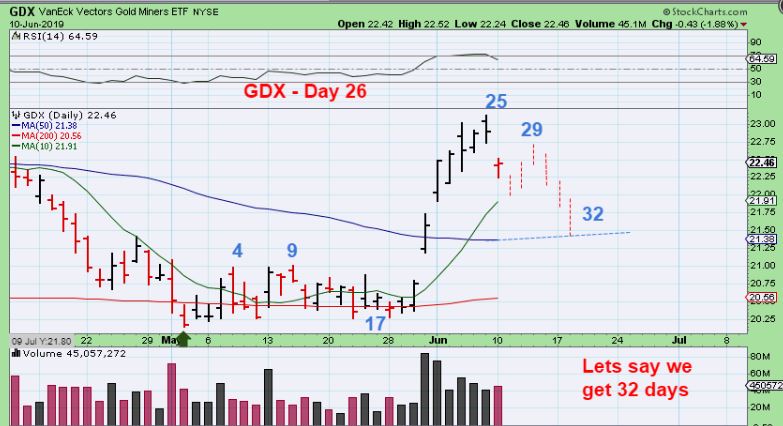
GDX – Miners have had a strong run, and they decided to follow Gold & Silver down, so we can discuss what this should mean…
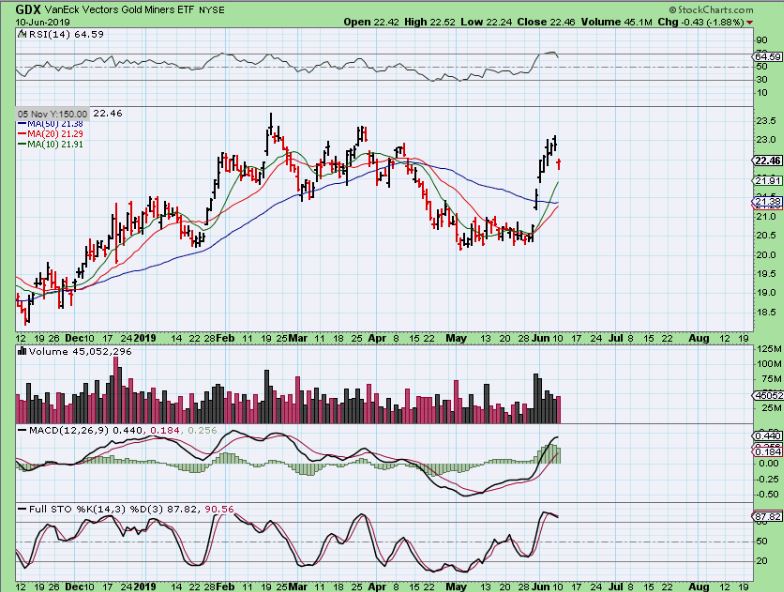
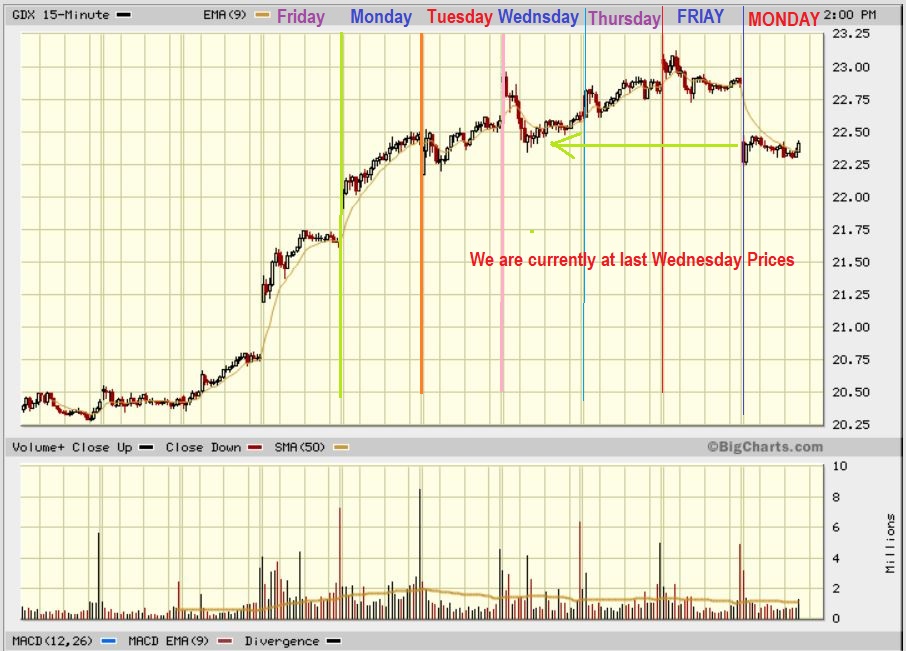
GDX – The drop really only puts GDX back at Wednesdays prices, but we have to expect more downside , due to cycle timing…
From Yesterdays Special Report – GDX could drop to the fib level of 50%, that would do a gap fill, and back test the 50sma. It MIGHT NOT, but that is a possibility. THIS WILL OFFER US A BUYING OPPORTUNITY IN MANY MINERS if it happens.
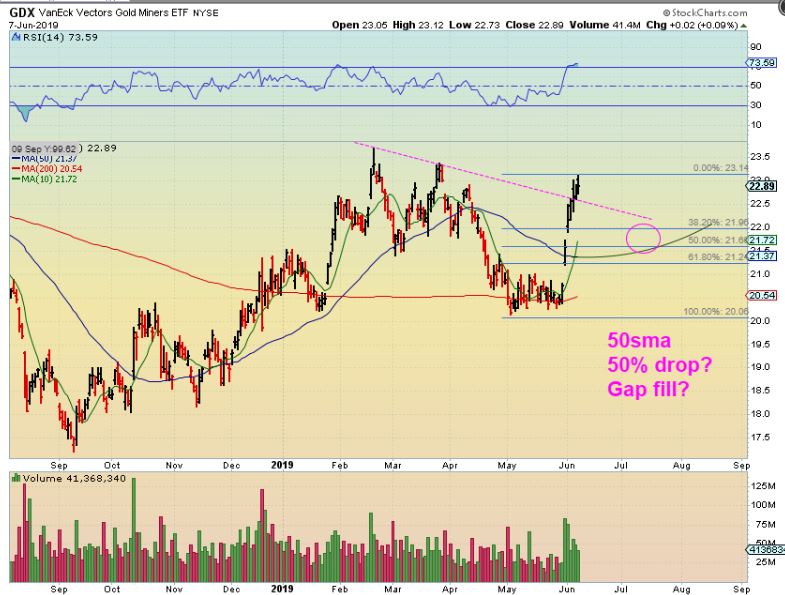
GDX – So I just wanted to give my readers a visual idea of what this may be like dropping to that 50sma. Many Daily Cycles have been 30-34 days, so let’s go with 32 days, we are on Day 27 Tuesday. With a day 25 Peak, this will be right translated and those highs should be broken on the next run. Day 32 is next week, and this COULD go to day 32 or 34 , even 36, so we usually try to wait for a swing low. INDIVIDUAL MINERS MAY BEGIN TO SET UP BULLISHLY, I WILL COVER THIS IN FUTURE REPORTS AS THAT HAPPENS.
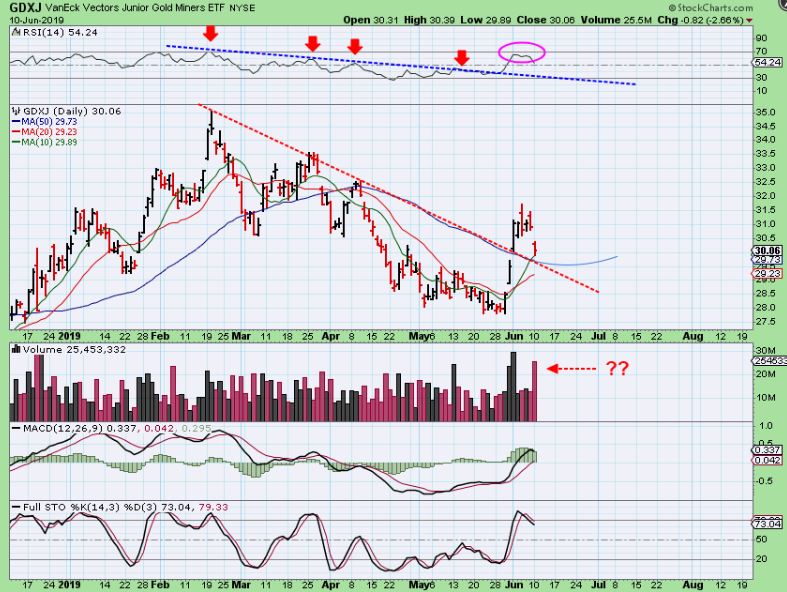
GDXJ – GDXJ had very heavy volume, so I will be looking for that to lighten up. Notice that on the recent rally, the RSI almost reached 70 for the first time since February (Bullish).
I HATE to put this reminder in there, but it is worth noting. last August GOLD clearly put in an ICL. Then Miners rallied , but they broke down into September to THEIR ICL 1 month later. Markets can be tricky & devious, and try to get as many knocked off of the Bull as possible, so I keep that in mind, but RIGHT NOW MINERS LOOK BULLISHLY SET UP, SO I WILL DISCUSS THAT NEXT.
.
So Miners will pull back and they could do so in many different ways. I like to try to be patient and ‘ALLOW THE TRADE TO COME TO ME’, rather than just buy the first day of a dip and ride it down further. Let’s discuss Individual Miners for a moment.
.
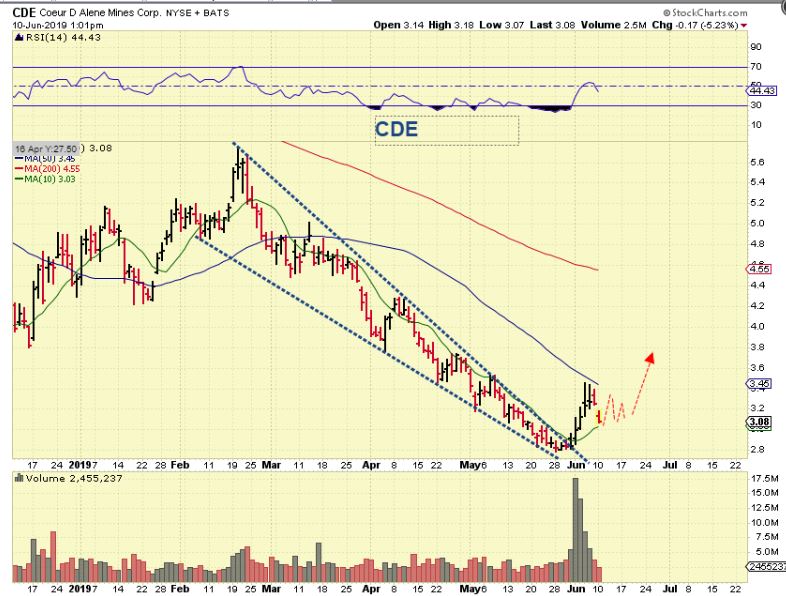
CDE #1 – CDE rallied to the 50sma & reversed. A Bullish pull back can come in many forms. CDE dropped sharply yesterday to the 10sma. If it could stabilize at that 10sma, we could see a choppy bull flag. That may be a nice place to add, HOWEVER…
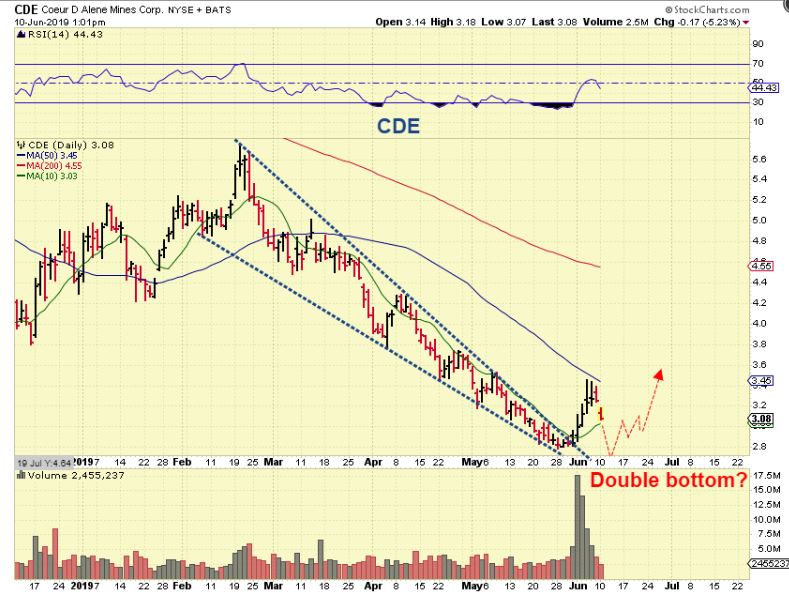
CDE #2 – Since CDE was one that sold off DEEP from the Feb peak, it could drop deeper again. I can visualize this dropping all the way back to lows and putting in a double bottom. This is why it may be best to be patient and see how things play out. CDE RSI did NOT get to the 70 area, and it can get back to the lows.
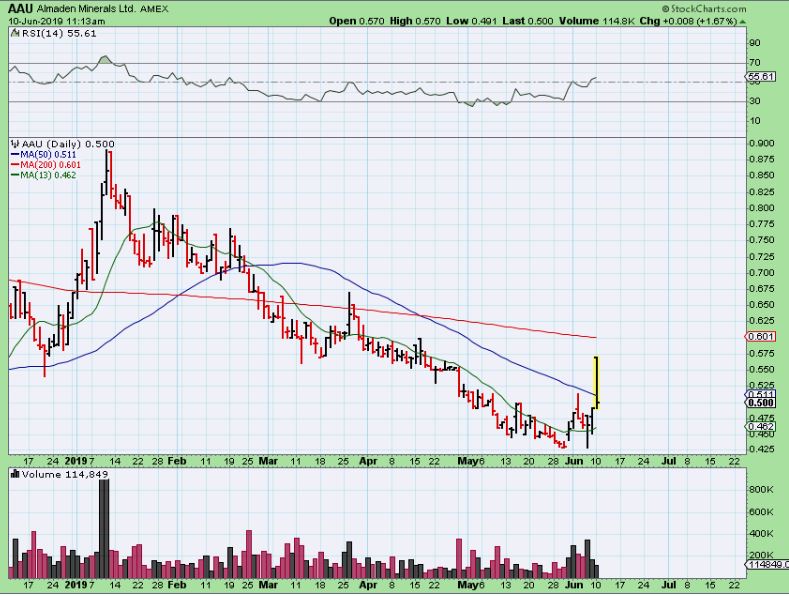
AAU – AAU looked like CDE in that double bottom low actually. Gold sold off and AAU had a large gap open. That gap slowly closed as the day went on, and I captured this 2 hrs into trading. I’d put this on a watch list, it looks like it is already trying to moce higher. It already has the double bottom low that I explained for CDE.
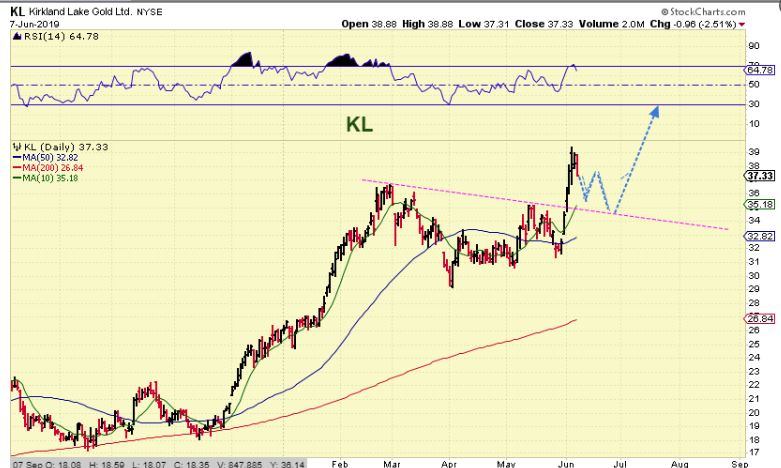
KL – This is very Bullish looking, and it actually started dropping Friday, so I drew this as an idea of a normal Cup & handle.
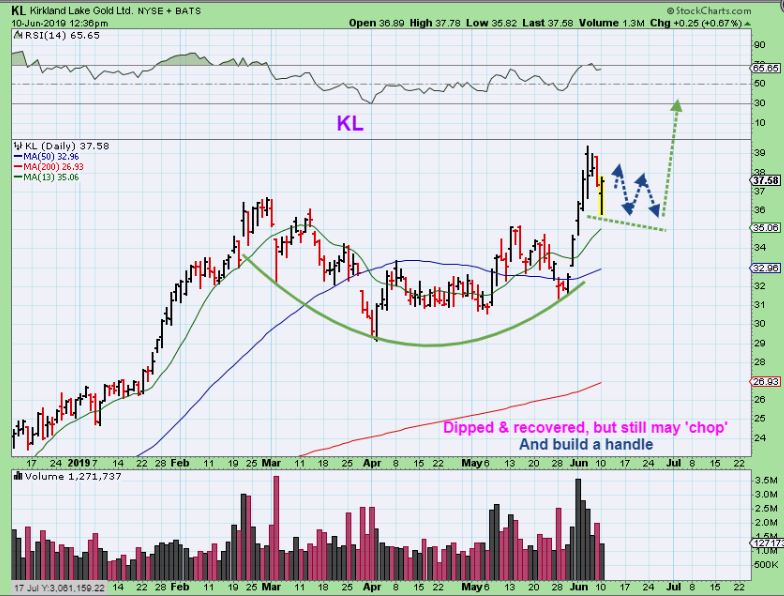
KL – Monday saw KL drop , reverse at the 10sma ( not shown) and look like it wants to recover already. KL went green yesterday. This is strong and honestly it could be bought on any dip, but it still could play out like this, so if you can take the chop, starting or adding in this area should be fine.
.
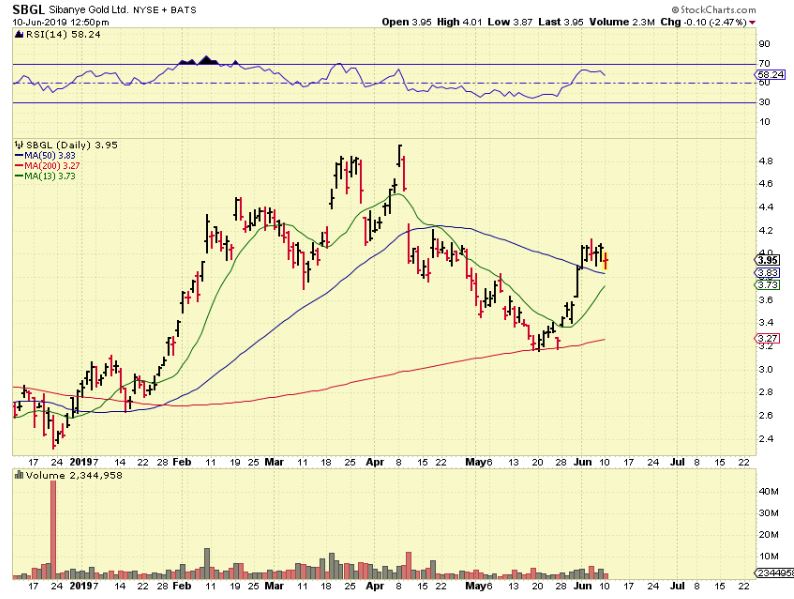
SBGL – I have been pointing out the upside potential on SBGL. This ran from $4 to $19 in 2016. Did it get crushed on Mondays sell off?
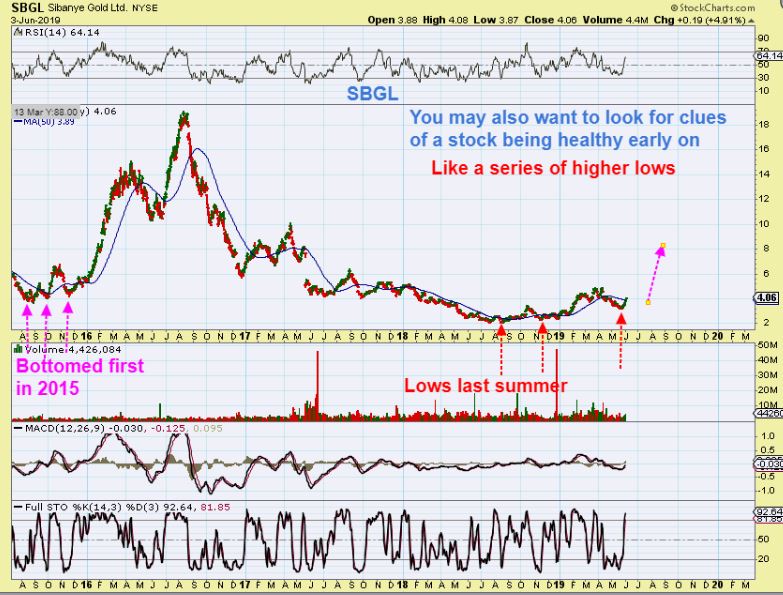
SBGL – No it did not get ‘crushed’, but is ( so far) bullishly flagging along the 50 sma. Since The 50 sma is sloping down, my experience has seen that Price can more easily slip below the 50 sma, but it may not. I do like this set up, especially if it just crawls along the top of the 50 sma from here.
.
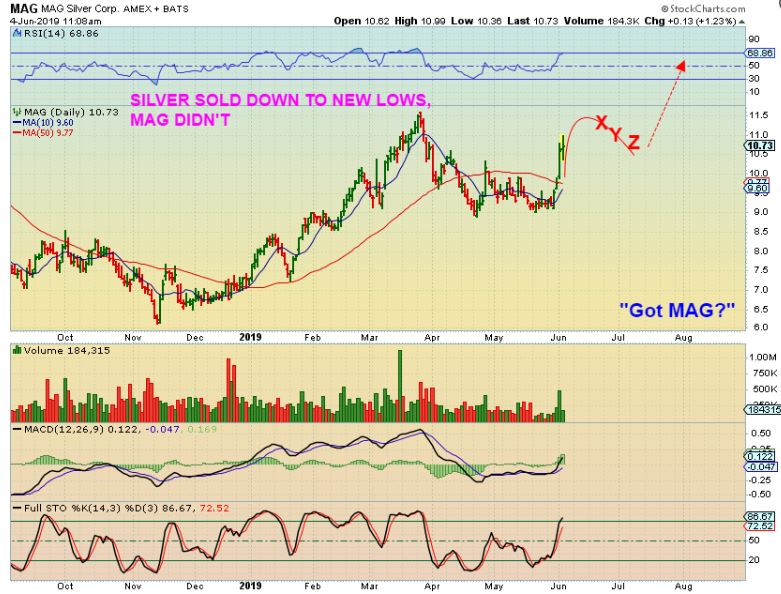
1 last example of how I will be watching this pull back. I will use MAG, which was strong on the last run, as my example:
.
MAG #1 of 5 – When MAG was starting to run strong, I drew this to show a possible path. This would form a cup & handle and would allow you to buy the dip…
MAG #2 of 5 – That run reached the peak last week, and this started to pull back Wednesday. I am watching the 38.2% & 50% area as possible support ( reversal). The selling has had fairly big down days, but on light volume.
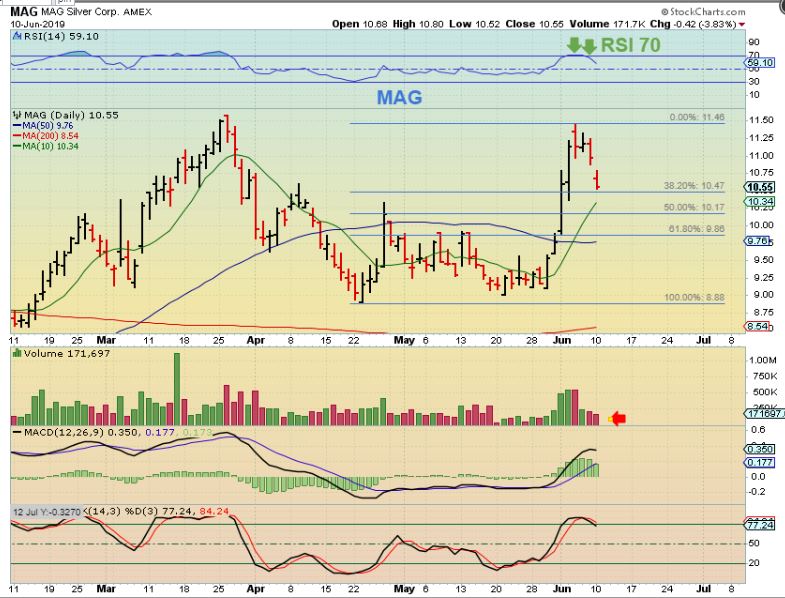
MAG #3 of 5 – So I will be looking for selling to lighten up near support. This would be a bullish reversal, reversing sooner than later, because the selling started sooner, but my #4 chart will show a more prolonged sell off into next week.
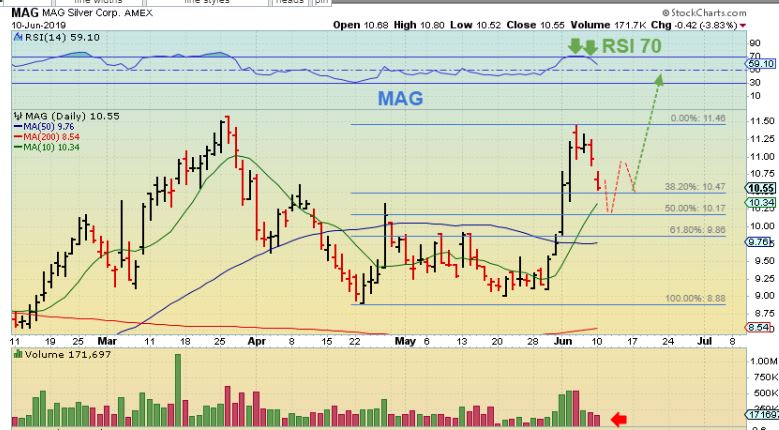
MAG #4 of 5 – A deeper drop is possible, because that 50sma often gets ‘back tested’. That is a 61.8% Fib area, and also very possible. That would be hard to ride if you own it, but it also means you could buy or ass MAG near $10 again.

MAG #5 of 5 – And the Big Picture for MAG is really quite a bullish looking chart, but it may or may not have more downside.

.
Due to the Bullish set up of the precious Metals sector, I would say that you can buy some Miners a little early as long as you can withstand the possible return of choppiness or even a deeper drop. This can drop further, but in the long run, this set up is very promising for big gains as time goes forward. My weekend had this chart in it, and the current pull back should be a buying opportunity. I expect that blue line to hold up as support, but price shouldn’t reach that low.
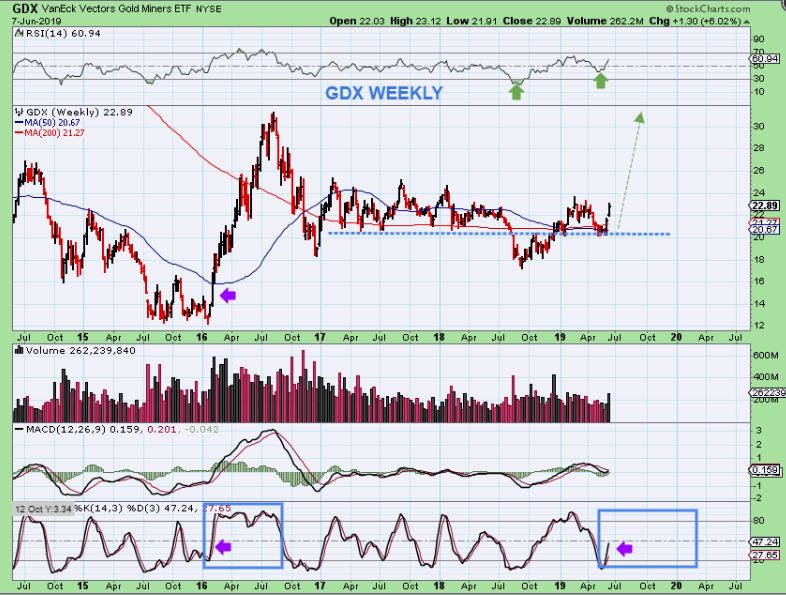
I will run through my watch lists of Miners and present buying opportunities as the set up. Usually the Low Risk Buying Opportunity presents itself at a support area during a sell off, and this daily cycle could have a few more days left in it.
.
Enjoy your Tuesday trading!
.
~ALEX
.
I just want to repeat that this is a very busy week for me, since I am going to be working away Thursday into the weekend, I am also getting a few things done around here during the Precious metals dip. My presence in the Live trading area will be minimal at the end of the week.
Next week I will be around as usual, and hopefully we get the DCL in GDX then, followed by the next leg higher of a rally. Then I am going away for the final week of June. I will still have the daily reports as usual, and most do not even notice that I am away when I go away, other than being in the live trading area less during the market hours.
.
GOLD LIVE 7 a.m. E.T – GOLD DROPPED, chopped sideways ( bear flag?), and may do another leg down. $1300 would be a back test of the break out.


