Thursday May 30 – No Real Bounce Yet?
We are due for a bounce, but the markets have not been able to muster one up yet. Yesterday we did see some reversals heading into the close, so maybe a bounce is next? Let’s take a look and see what the charts say…
DJIA – The markets were selling off again on Wednesday, this was a midday chart as the Dow broke the 200sma. This often gets people to go short and then the bounce can cause a bear trap as shorts pile in…
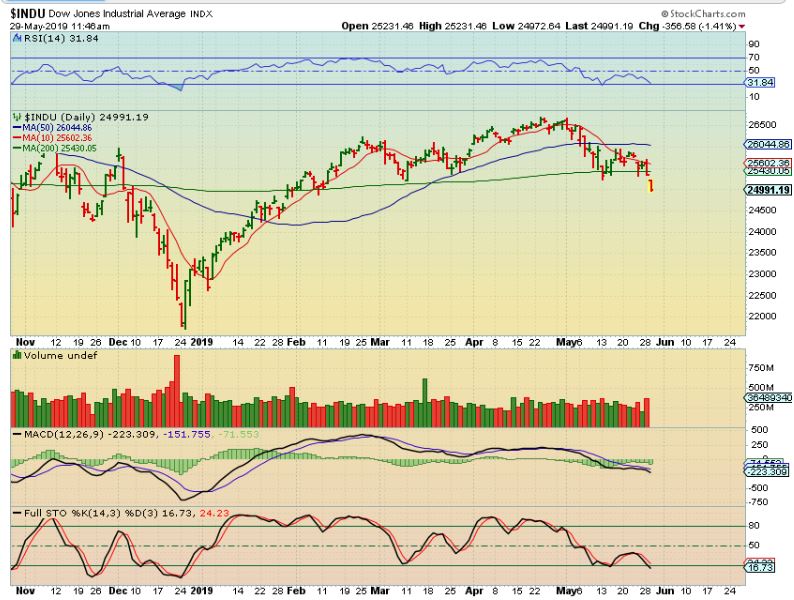
DJIA – We did get a reversal, and now Newly Added shorts on the break of that 200sma might be trapped. That may lead to a bear trap with any follow through higher. The entire pull back in the Dow has been somewhat normal, but the amount of time that it has taken to bounce has been weighing on the bulls. Sideways chop is difficult, but now we’ll look for follow through after that reversal (or not).

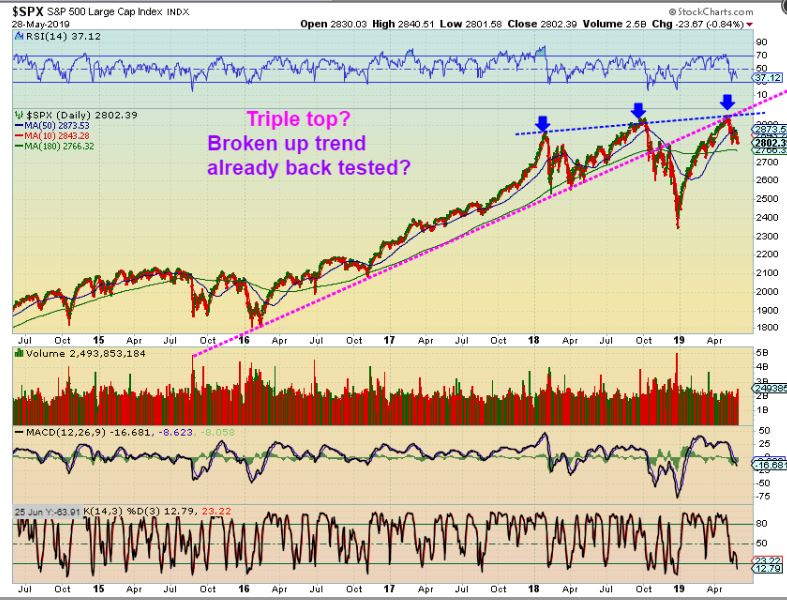
SPX – I usually discuss the Big Picture on the weekend, but right now this does look bearish in the longer term. I’m expecting a weaker 3rd daily cycle bounce and possibly a 4th daily cycle sell off. LOOK AT MY MAGENTA TREND LINE. That looks like a break down & back test triple top to me. I may short the next bounce.
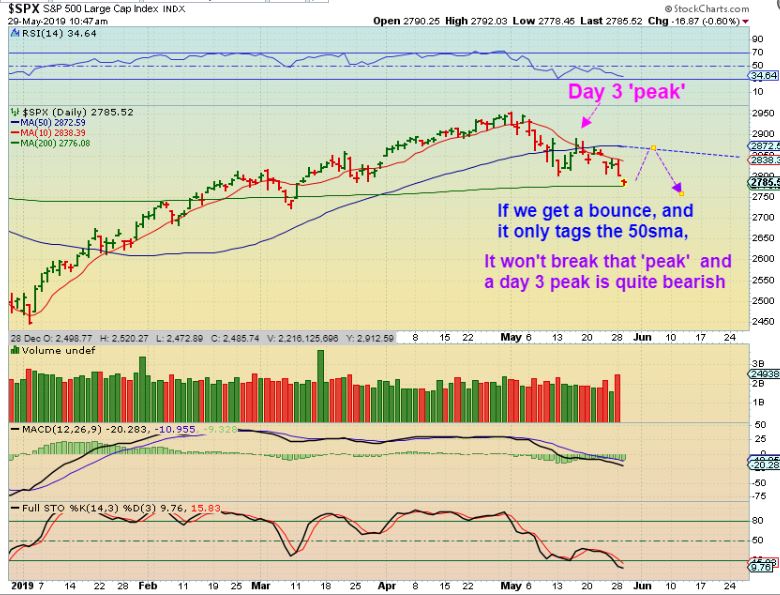
SPX – What if this is all the next bounce does? Please read the chart, a small bounce to the 50sma would give us a day 3 peak. THAT is weak.
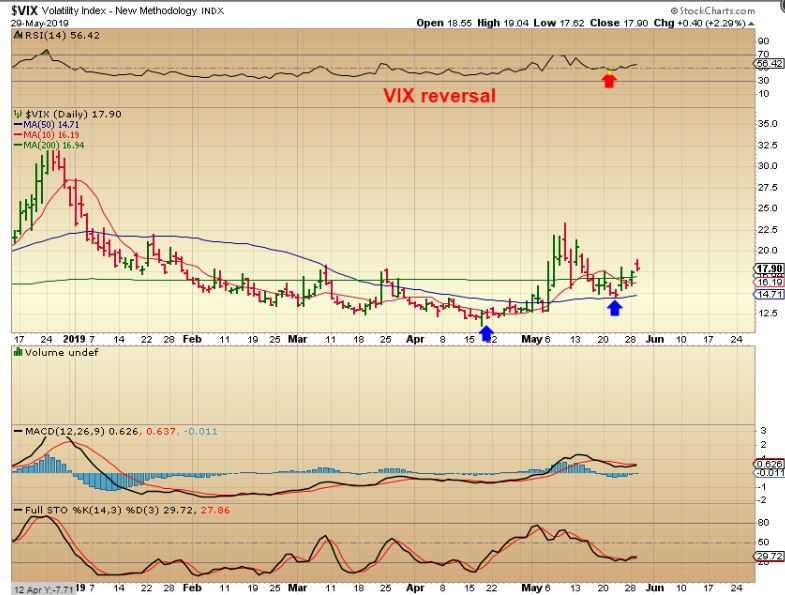
VIX – The VIX popped Wednesday but closed back at the 200 sma. This looks like a bullish chart, so it may only drop to the blue 50 sma and then the Market could top.
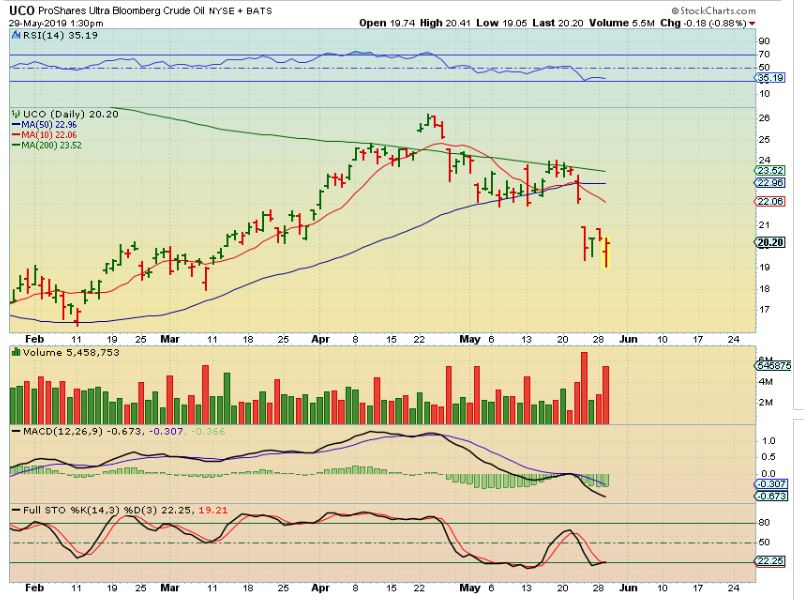
UCO – I saw a strong looking reversal forming in Oil Yesterday, so I captured UCO Midday to point that out. I mentioned in the live trading area that often Oil & the Markets have been running together, so if Oil reverses here, maybe the Markets would into the close too ( and they did).
WTIC – Oil closed with a big reversal candle. This is only day 16 and we have a ‘peak’ on day 9, so I’d expect just a weak back test of the moving averages, and maybe then some choppiness. We could then drop again, since Oils daily cycles can be 30-50 days long. That also may be a short-able reversal after the bounce too. See the chart, and we’ll watch it as it unfolds.
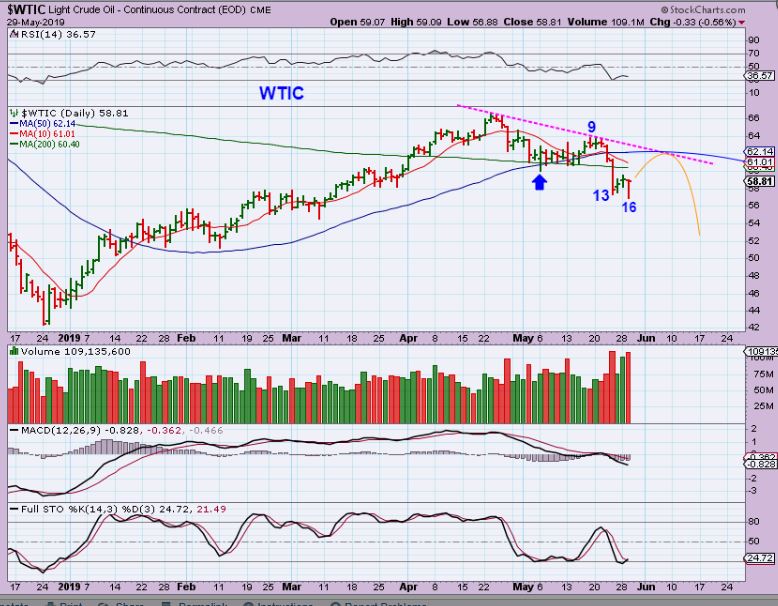
So short term ‘Traders’ often try to grab a reversal and put a stop under the lows. It would need to be watched as it gets to the moving averages, and it may become time to flip short. We’ll know better as the move unfolds.
.
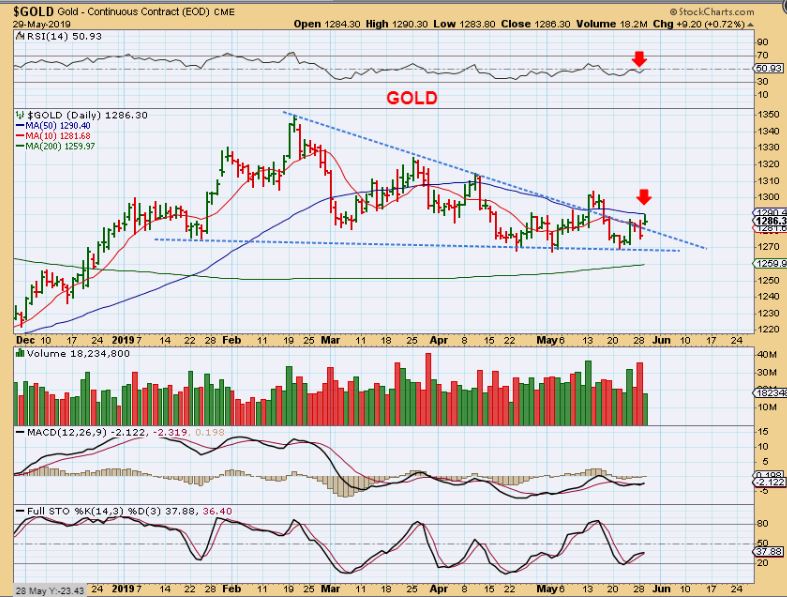
GOLD – Gold ran higher Wednesday morning but was stopped at the 50sma. Gold is somewhat neutral until it picks a direction to run in. GOLD IS CHOPPY.
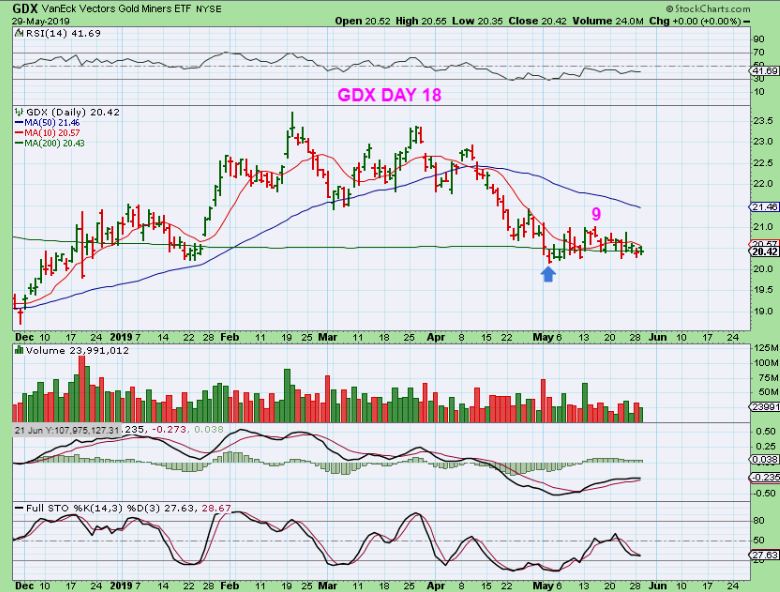
GDX – GDX is just staying sideways and choppy. There really isn’t a solid trade here yet.
.
I hate to say it, but patience may be the best trade out there again for the majority of longer term traders. If you are working full time and can’t be in front of the screen, trading under these conditions can be difficult and frustrating, but LONGER TERM TRADES WILL EVENTUALLY SET UP. Reversals in the General Markets have yet to find any real follow through. Actually, stocks in all sectors have been pretty choppy and frustrating day after day. The Miners are also mixed and in a choppy sector with some Miners selling down to their lows, and others chopping around sideways. Choppy directionless markets often just eat up traders, so it still may be best to be patient and wait for a solid set up to take place. More active traders can buy reversals with tight stops and look for set ups in those sectors, but it may remain choppy and tricky for short term traders too.
.
For those looking for some trade ideas, I have to repeat myself: It is best to keep positions small and always use stops. I will discuss a few additional ideas below for active traders, SOME ARE HIGH RISK or EVEN LEVERAGE, please be cautious in this choppy environment. =) Enjoy your Thursday !
.
~ALEX
.
I’ve been watching some stocks that are ignoring the selling, just in case the Markets recover. If the markets bounce, they could really be better performers, unless they are already extended. ROKU, ENPH, and a few others look great, but may be too extended to enter where they are now. Let’s just look at a few example of stronger stocks:
.
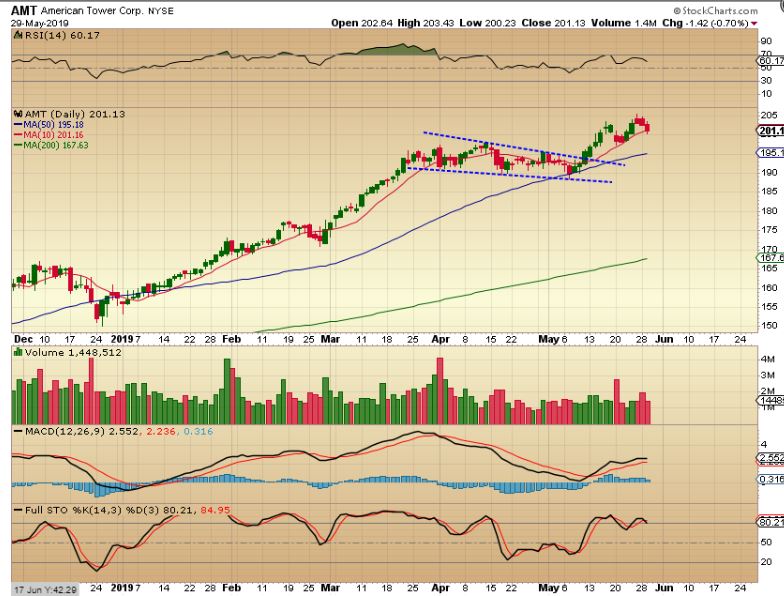
AMT – For the Watch list. American Tower broke out in May and has been climbing the 10sma, as the markets sell off. It has pulled back this week though. I’d like to see it drop to the 50sma & reverse as a lower risk entry, but it may just keep climbing that 10sma.
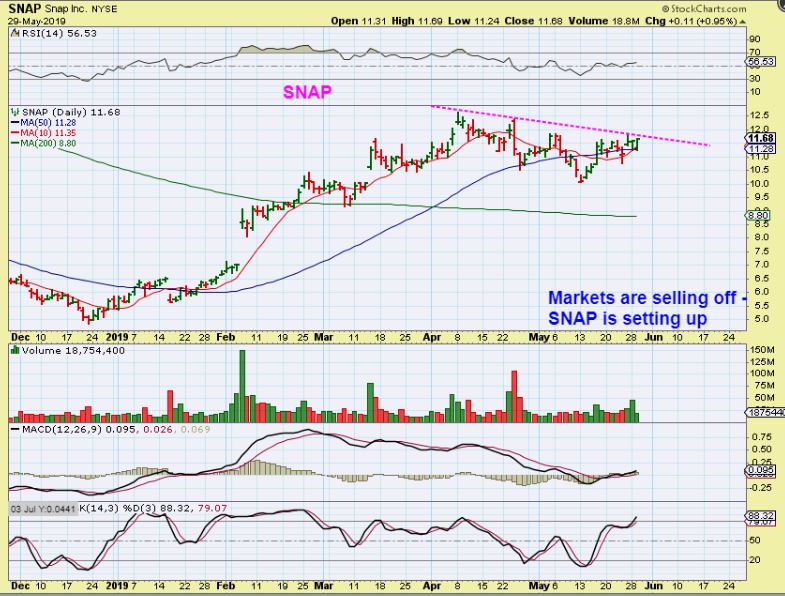
SNAP – Ready to go? It looks good. Snap doubled since the December lows and now after a consolidation period, this looks ready to break out. It regained the 50 sma yesterday. This is actually a buy if it breaks out.
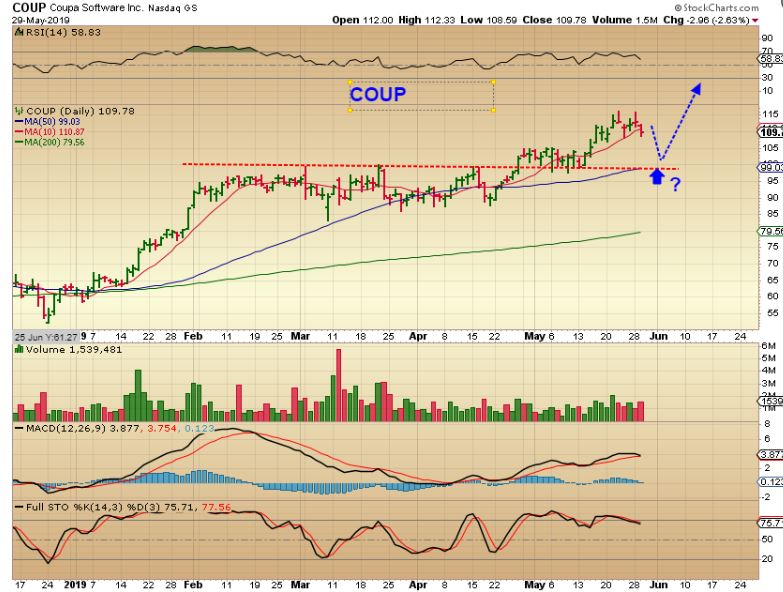
COUP – WATCHLIST? Coup rallied in May, it did not follow the Markets lower. I feel that COUP should pull back to the 50sma for a back test. If it does and then reverses there, it is a low risk buy with a stop in that area.
.
What about the Semiconductors? They have been hit pretty hard, and it is possible that they will put in a nice bounce, so let’s just look at a few. This may be for short term traders…
.
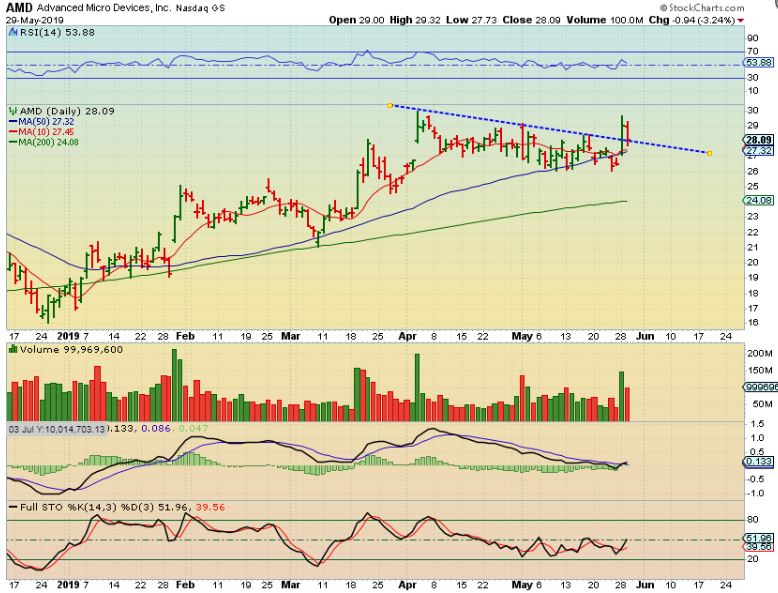
AMD – AMD ran up on good news Tuesday and pulled back Wednesday, so this is not extended, it is back at the consolidation and could be a good buy when the markets move higher.
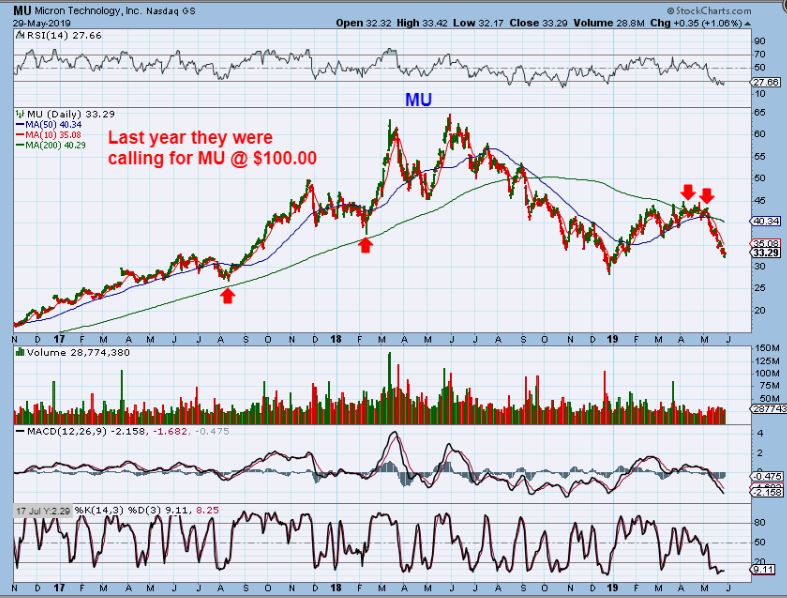
MU – Then I looked at MU. Notice that Green 200sma that used to hold price up. MU was called by analysts to target over $100 and then it double topped and broke that 200sma. Now it back tested it. THAT IS NOT USUALLY GOOD, but it could bounce back to it again for a run from near $30 to $40. You could buy it with a trailing stop and hope for a break out & run to $100, but if the markets are going to roll over again, you may want to sell a good chunk at the 200sma and raise stops on the rest.
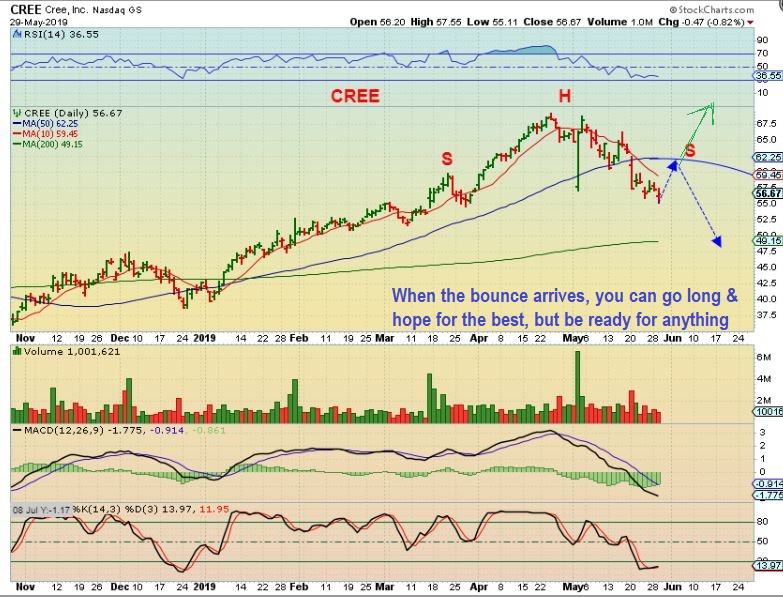
CREE – It is the same with CREE. You can buy it and hope that the markets stay Bullish , but if not, be ready to lock in gains.
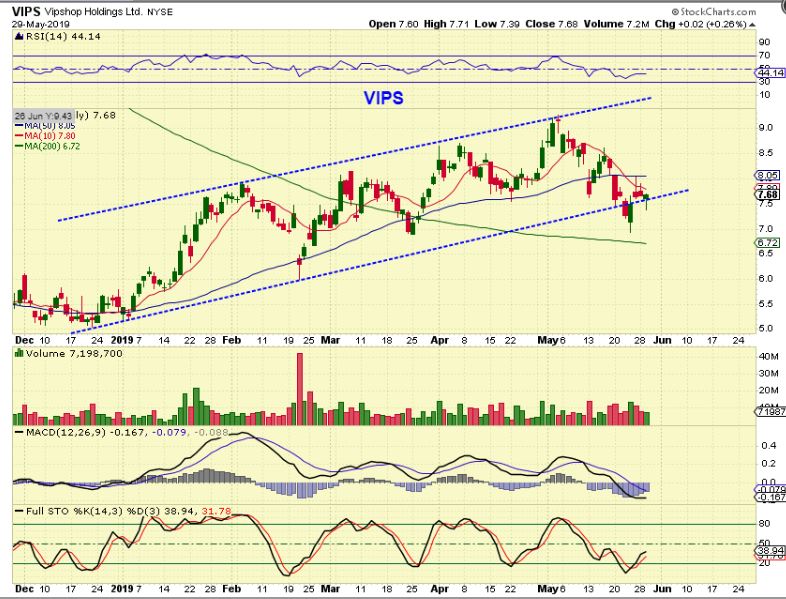
VIPS – Vips could be on support and ready to run higher again.
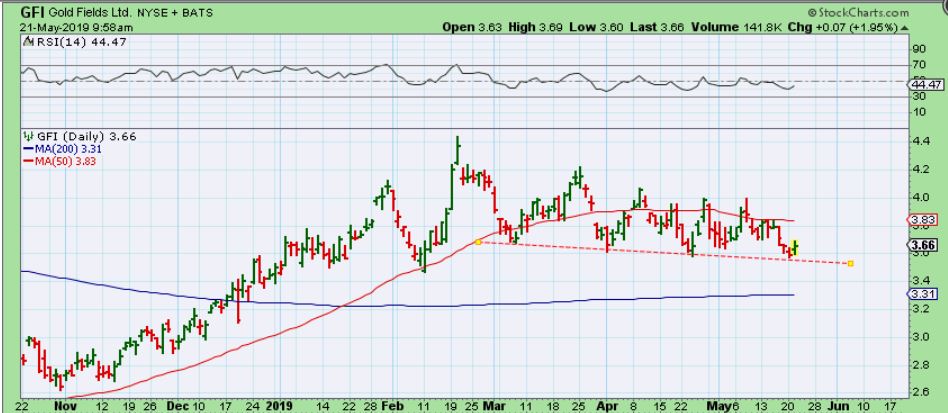
GFI – On May 21 I pointed out this buy at the support as it reversed. It has been a reliable reversal area.
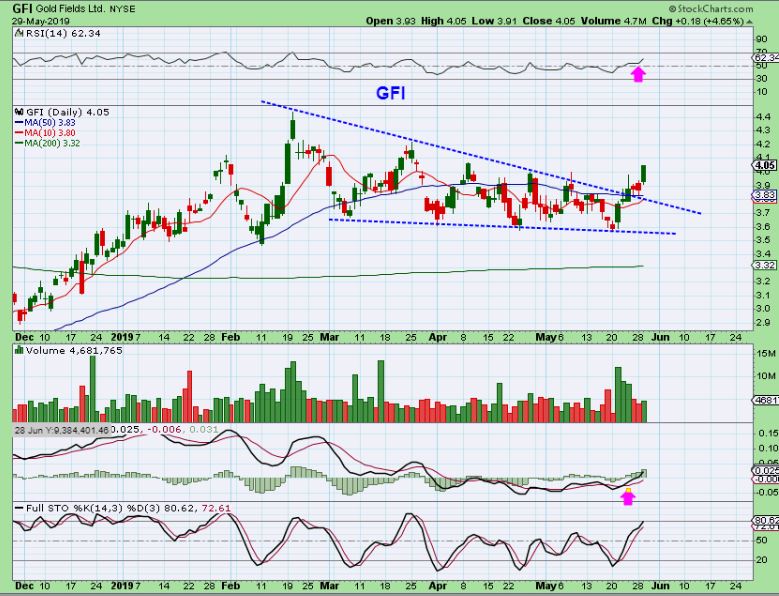
GFI – GFI has ignored the rest of the Miners and broke out. I would let it ride, in case someone knows something. You could also protect gains by Raising stops if you wish.
RARE EARTH EXPLOSION: HIGH RISK TRADES! The Rare Earth Miners are exploding higher but they also have some sharper pull backs, so you want to try to catch them close to support if possible. You probably want to go small, since they can pop 30% one day and then also drop 20% on any given day. I have a list of several Rare Earth Miners, but some have No Volume and trade for 2 cents or so, so I will ignore those for now.
.
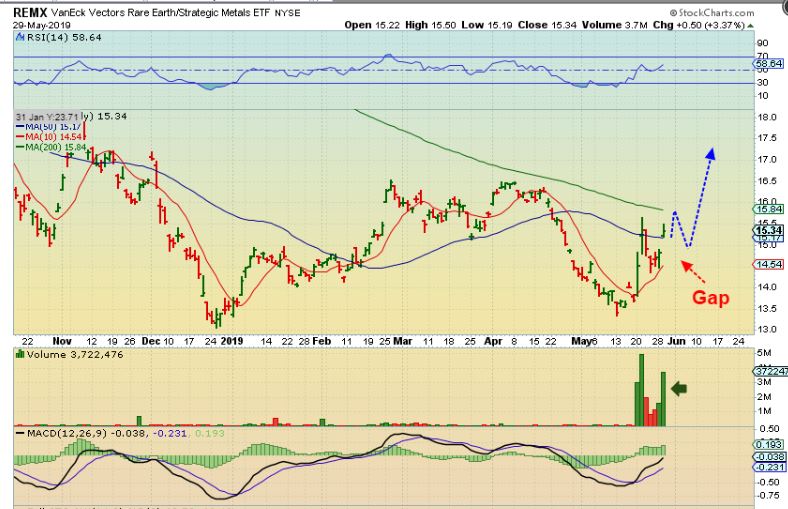
REMX – This is the Daily etf for Rare Earth and it gapped higher yesterday so I didn’t buy it. It may or may not close that Gap as shown , but as you’ll see, the weekly chart looks very good…
REMX WEEKLY – Rare Earth Miners ran well last year too. This is the weekly etf for Rare Earth and you can see that it is a nice double bottom that does look bullishly set up to run higher. Last year this ETF ran from this area to $29.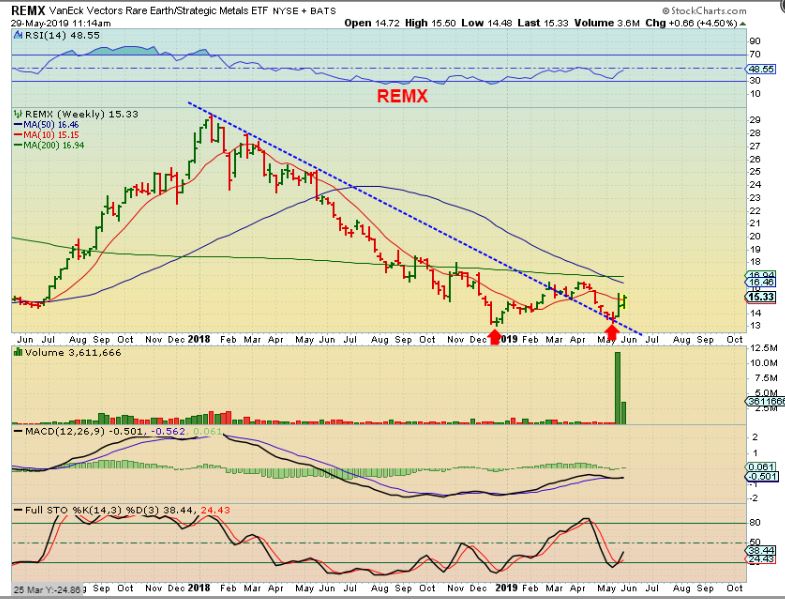
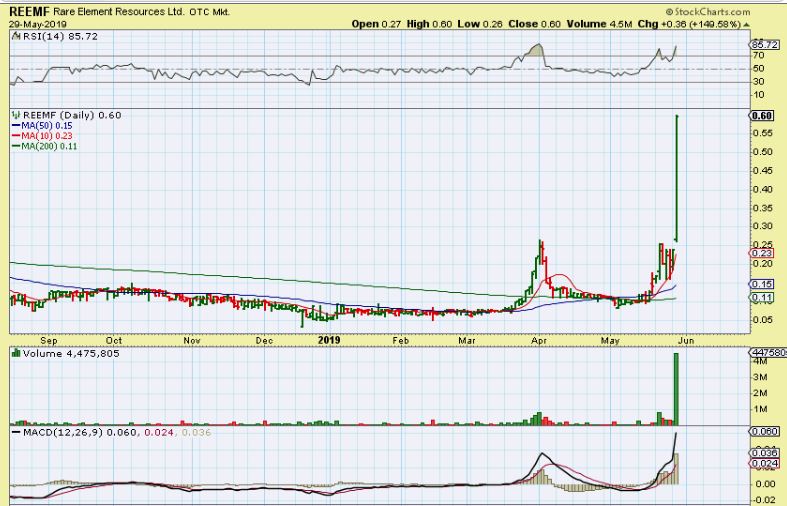
REEMF – It’s too late to buy this double bottom, but I wanted to show you how these are moving. We were discussing these a week ago in the live trading area. This looked like a cup flagging and then REEMF just took off , surged 150% yesterday.
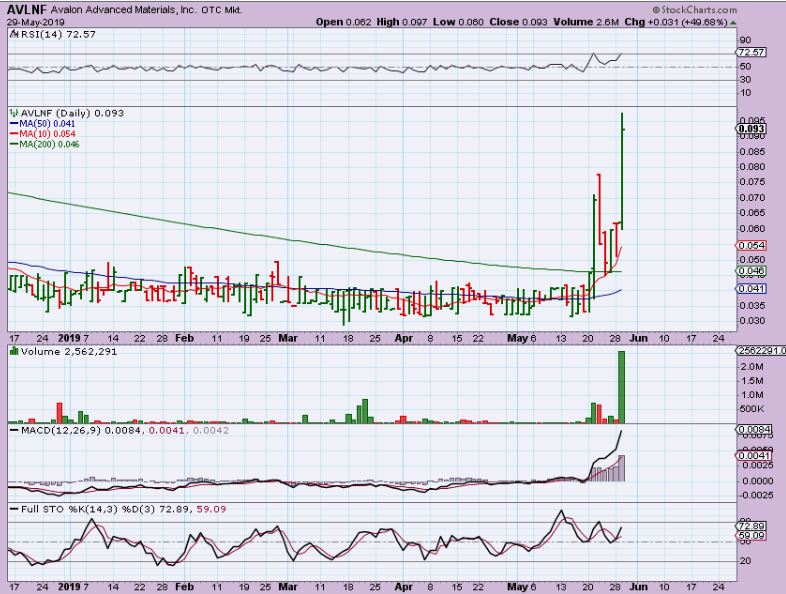
AVLNF – AVNLF also Popped, dropped to the 10sma , and then surged 50% too. Even though it can run higher, it seems to extended to just jump into here. If I recommended this and it dropped to the 10sma, that would hurt.
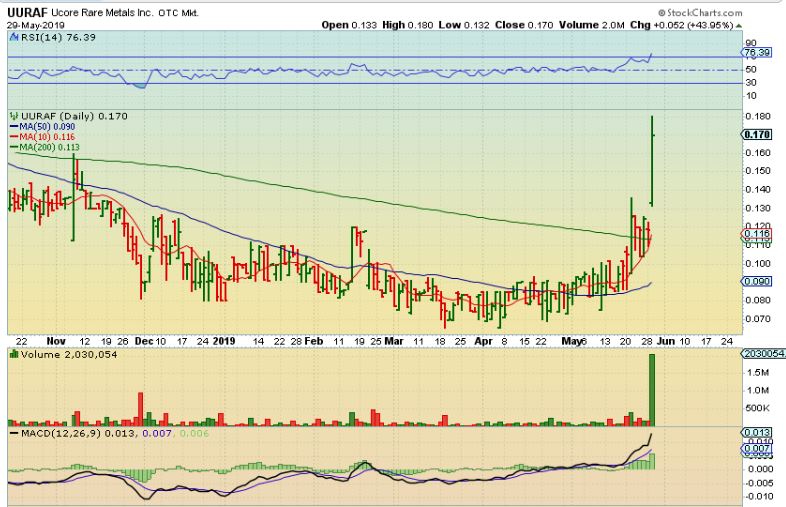
UURAF – This was also up 40% from a long base, and there were even a few others that move 30-50% yesterday, BUT YOU REALLY SHOULDN’T JUST JUMP INTO THESE UNLESS YOU ARE EXPERIENCED AT SCALPING. This can pull all the way back to the gap, and that is a big %-Drop. If, however, they pull back, they may become a Buy, and…
UAMY – This popped 9%, but it isn’t overly extended. It might start moving higher next, since it does have a similar base and consolidation.

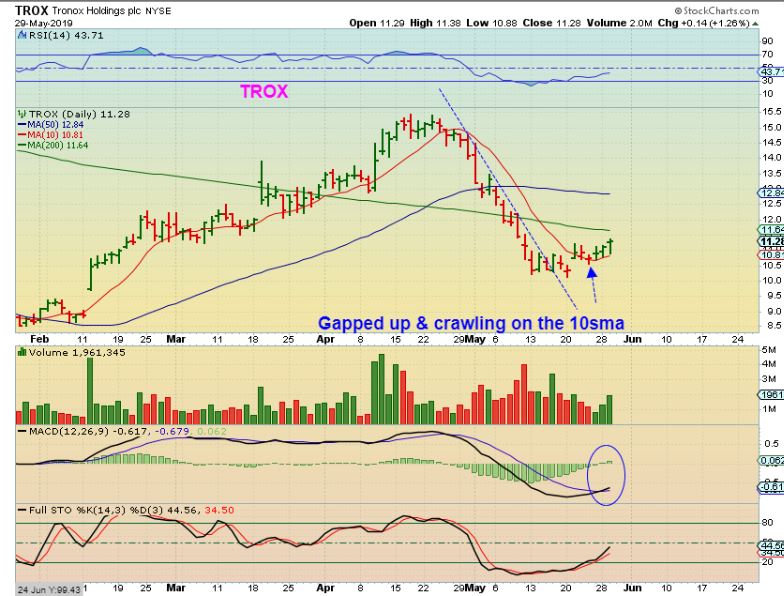
TROX WEEKLY – TROX can be put in that group too. Remember when the Gold Miners bottomed in Jan 2016? So did TROX. From 2016-2017 this ran from $2.50 to $27.50 and then pulled all the way back to $6 in 2018, bottoming when Silver and GDXJ bottomed. Now TROX has run from $6 to $15 since Dec and back tested the down trend channel, so this may actually be ready to move higher again. Let’s look at the daily chart…
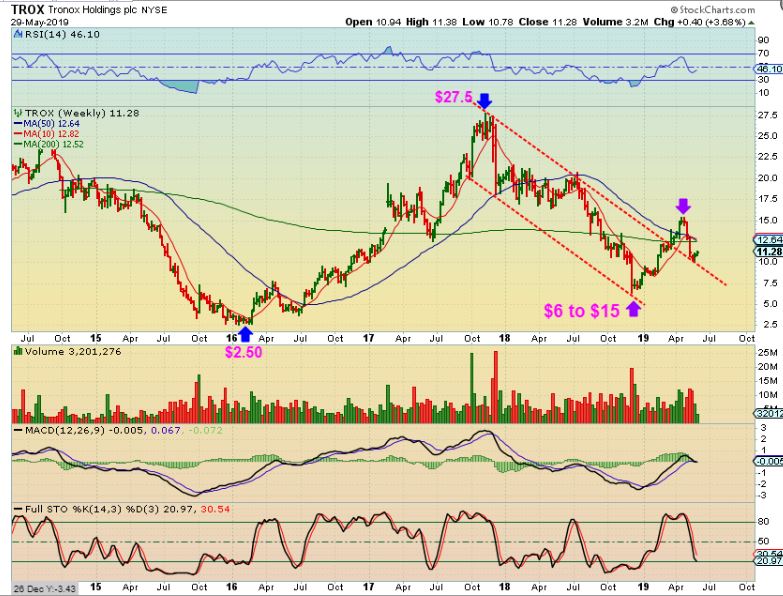
TROX DAILY – TROX looks like it did have an ICL drop this year this year. It sold off from $15 to $10, but it did pop over the 10sma & has held up there recently. It is oversold, the MACD is crossing, and volume seems to be increasing. It may be ready to move higher and can be included in a rare metal miners
I did some research to find these, and I found others like MLLOF and LYSCF. They popped 30% yesterday too, but are too extended to recommend. You can look those charts up on your own and maybe watch for a pull back. I have them on my watch list.
.
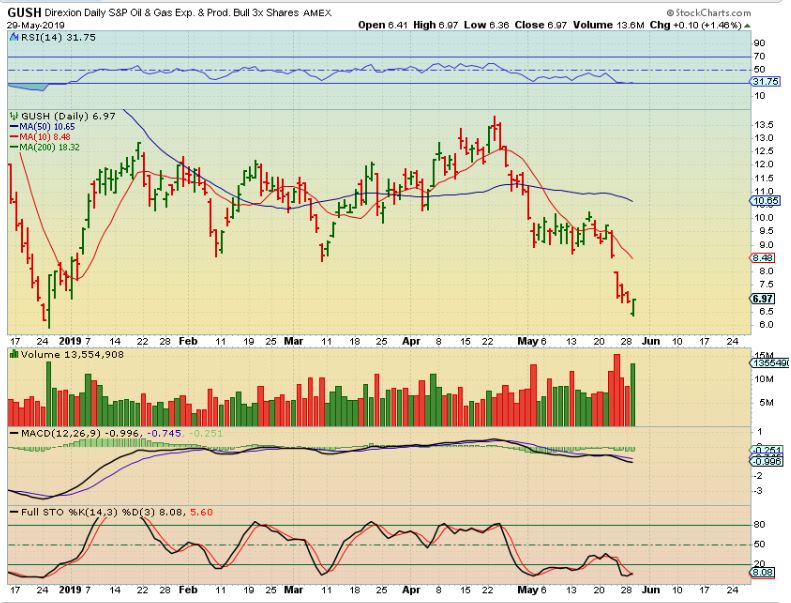
IS OIL GOING TO BOUNCE? IT looks like it is , and the XLE, XOP, OIH also look oversold, so GUSH also becomes a ‘Higher Risk’ leveraged way to catch a quick trade .
GUSH – We see a reversal at $6.30 yesterday. Even if this bounced to the congestion area or up at the 50 sma with a 1 or 2 week bounce, those would be good gains. Its risky, since I think Oil is early in a daily cycle that fell apart. I THINK THAT THE OIL INVENTORY REPORT IS RELEASED TODAY, DUE TO MONDAY BEING A HOLIDAY? You may want to google that.