
May 18th 2019 Weekend Report
For our Weekend Report, we’ll take a look at the changes that took place this week, and see how our Big Picture Views are shaping up. I think that you that you are going to love this report, so please take your time with the precious metals Sector and enjoy…
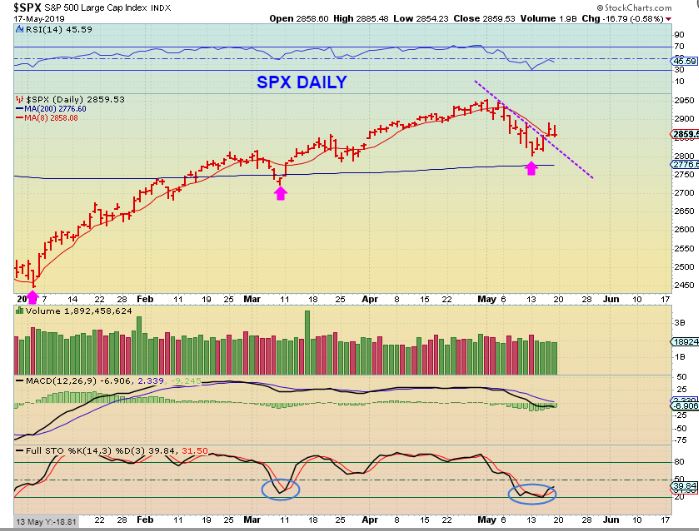
SPX – The General Markets are due for a dcl, and this looks like day 4 even though it sold off Friday. I wanted to start with the DAILY Chart, because the weekly alone would look less like a DCL formed.
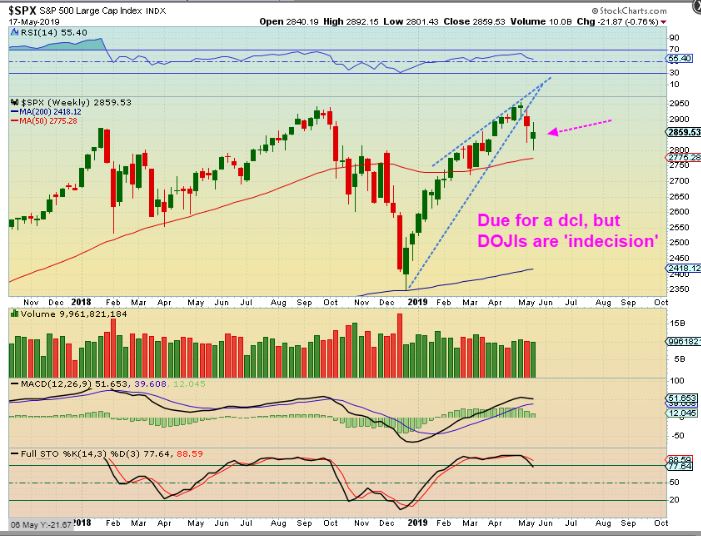
SPX WEEKLY – A Weekly Doji indicates indecision, so this looks less like a dcl is in place and more like it could drop to the 50 ma. That is why I showed the daily chart first, since it seems to indicate that this indecision will end up moving higher and that a dcl did form last week.
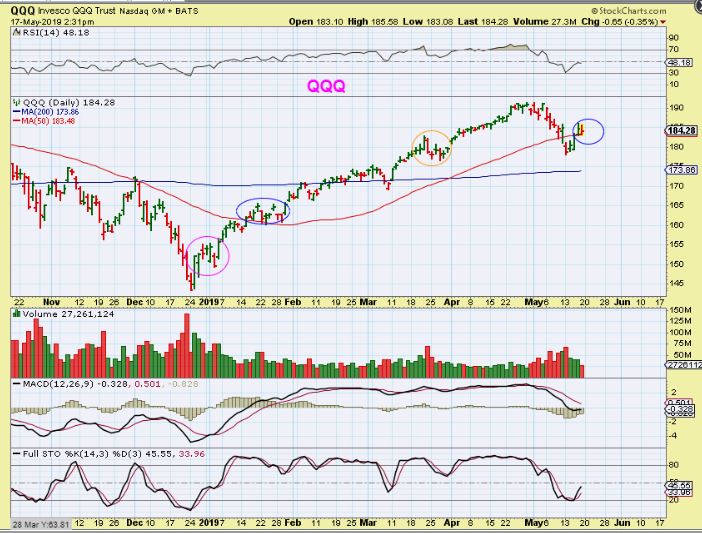
QQQ DAILY – The Q’s began to dip after gaining the 50sma and actually closed below it by the close. I am circling prior areas that show the choppiness can be normal as price moves out of the lows. I do think we have a dcl.
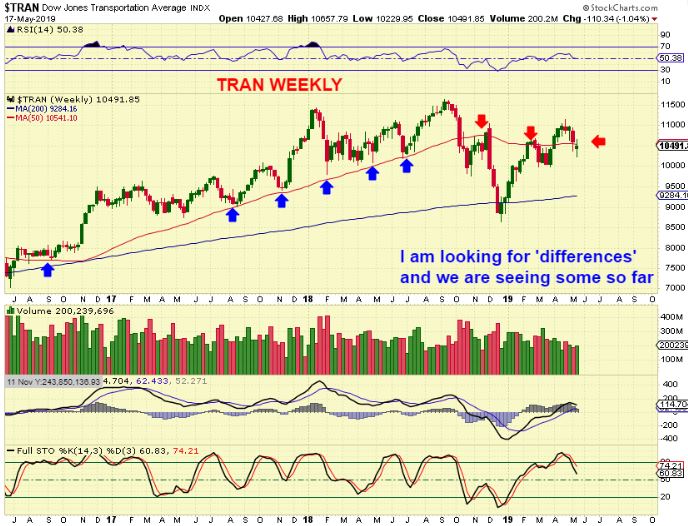
TRAN – The TRAN WEEKLY is seriously lagging since it never reached 2018 Highs. The inverse H&S never progressed either. The TRAN bounced along the 50 weekly red line when it was healthy (blue arrows), and it is struggling there now. As we enter the 3rd daily cycle, I am looking for weakness or strength, and so far this is weakness.
SOX ( Sorry for the typo on the chart) – The semiconductors were very strong moving out of the Dec ICL. Now we see a sharp 2 week drop that broke the uptrend line, and that could be signaling that these markets will peak on this 3rd daily cycle and start their roll over into the next ICL. THAT MAY BE GOOD FOR THE PRECIOUS METALS AS A SAFE HAVEN. I’m going to look for a double top / back test of the trend line as a possibility.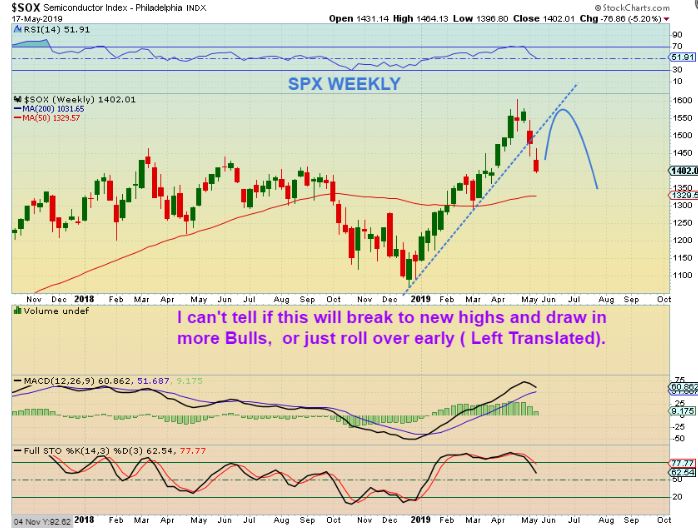
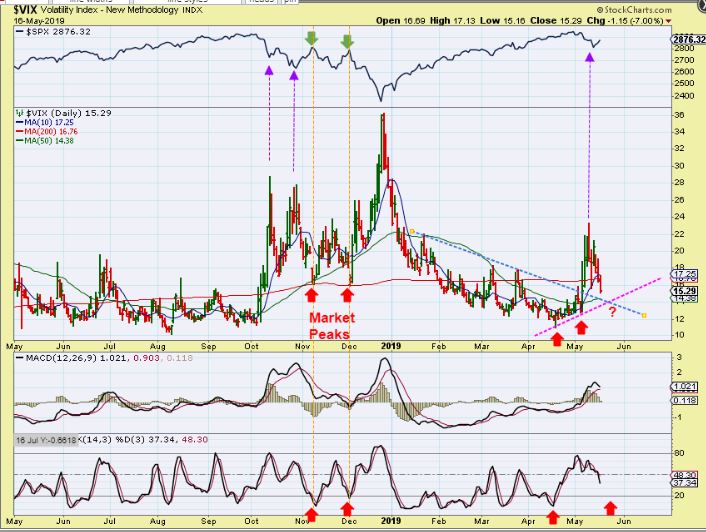
VIX DAILY – The Upper box is the SPX, this main box is the VIX. I’m pointing out the October sell off starting with the VIX pop. That is similar to what we just saw on this drop. Now we bounce out of a daily cycle low (DCL) as the Vix drops , but if that VIX finds support where it looks like it will, that seems to indicate that the markets will top fairly quickly. Maybe day 10-15 as left translated? Please examine this chart, comparing Now vs October.
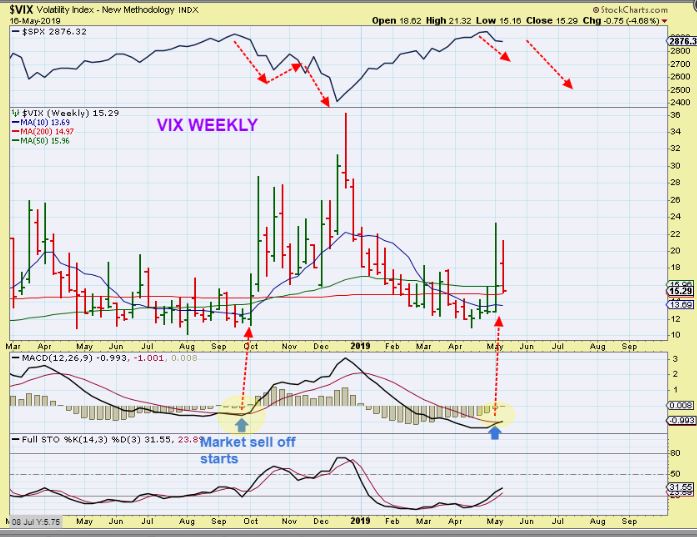
VIX WEEKLY – This is the weekly comparison. Look at the weekly MACD and it appears ready to cross upward, and that would be bad for the general Markets. There is an old saying that foretells the summer doldrums as ‘Sell in May and go away’. This may help the Precious Metals.
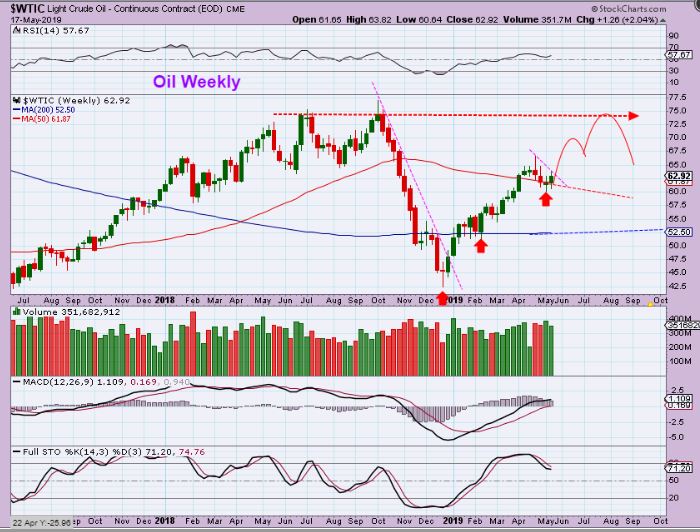
WTIC – Oil also has a dcl, but it has meandered sideways along the weekly 50 ma. I expect higher prices for Oil, however…
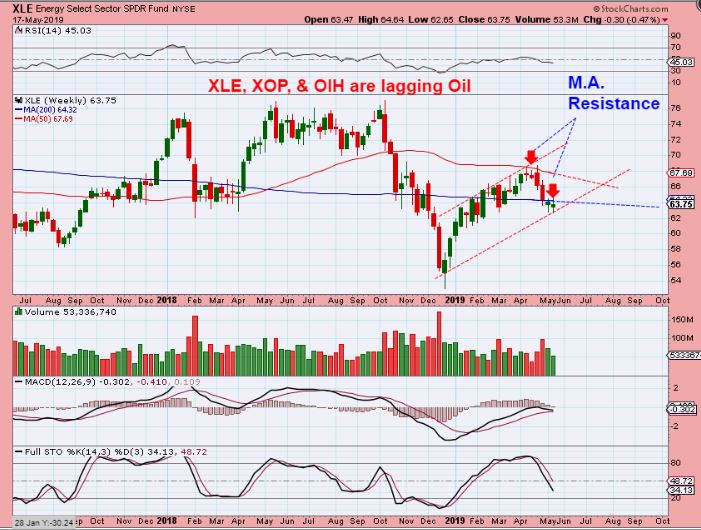
XLE – The Oil & Energy Sector seems to be lagging and weak compared to Oil lately. It may be following the General markets? That does seem to give us the need to pay attention if the General Markets do roll over while Oil continues higher. This sector may not be a good ‘Oil’ trade any longer.
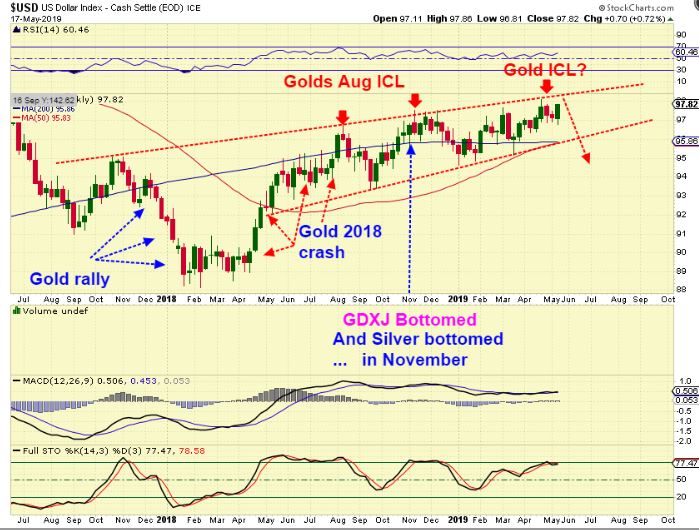
USD WEEKLY – I’ve pointed out past ‘peaks’ for the USD and they seem to line up nicely with Golds ICL (red arrows) . When the Dollar dropped, Gold then rallied.
1. The USD ‘peaked’ 2 or 3 weeks ago, and Gold looked like it put in an ICL.
2. The USD stalled and Gold bounced higher out of an ICL.
3. The the USD pushed higher last week, and Gold sold off.
4. I’m watching the USD next week – there is still some room to move higher again, so Gold could drop a bit further. THIS IS WHERE THINGS GET INTERESTING…
YES, THIS IS WHERE THINGS GET INTERESTING. I’m getting a little Mixed Signals here again, and even though this part of the report starts off looking bearish, I think you’re going to love the ending. That said, read on with a joyful anticipation of the conclusion, and not a heavy heart. 🙂 Let’s take a look at Precious Metals…
.
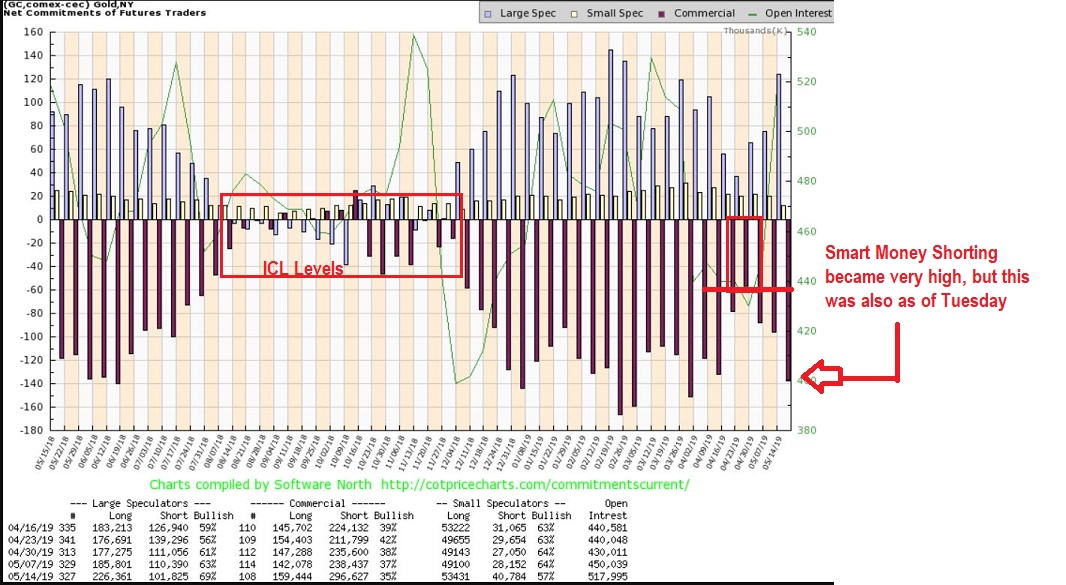
GOLD COT – After reaching a level where an ICL can form 4 weeks ago, The GOLD COT Shot up quickly, especially last week! This indicates that Smart Money was heavily shorting Gold. They are often correct, and Gold sold off this week.
GOLD – So you can see that
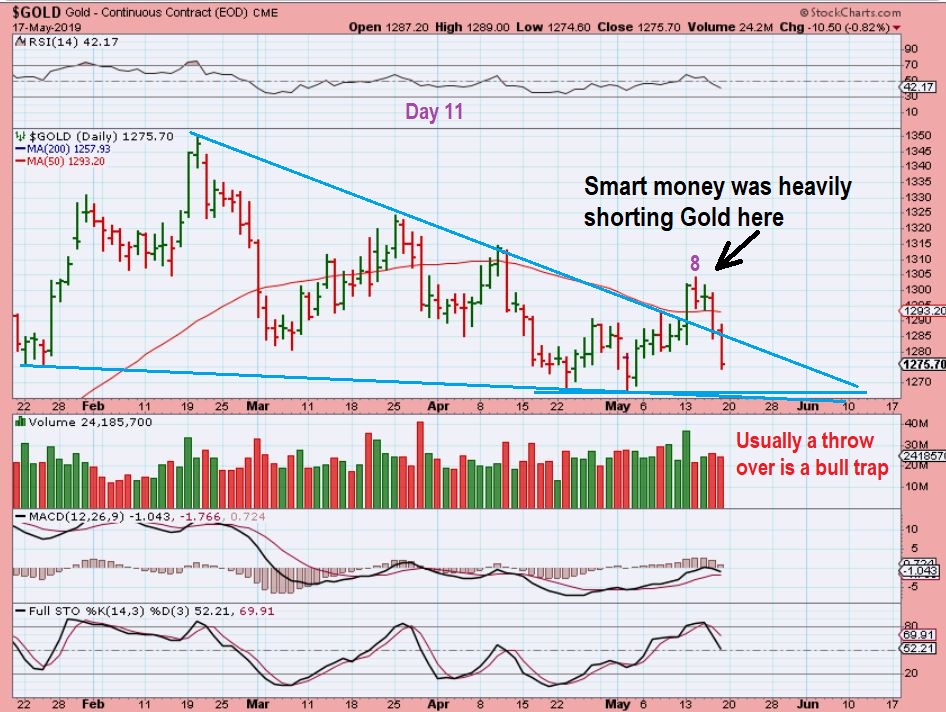
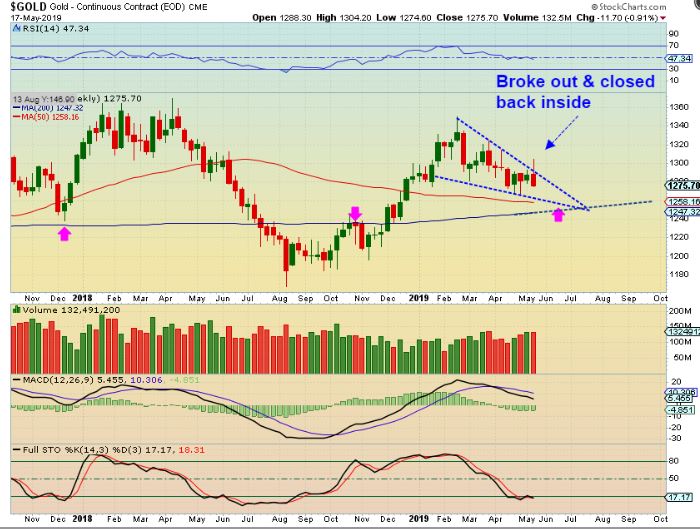
1. On day 7 Gold broke a down trend line, usually indicating that an ICL is in place.
2. It gained the 50 sma and closed on top of it for day 8 & day 9, often Bullish, but instead of a normal ‘back test’ of that trend line, Gold sold back into the pattern.
3. That is a throw over and is often a bull trap, luring bulls in & then shaking them out. I DO NOT LIKE THIS THREAT TO THE LOWS ON DAY 11, it makes me question whether that is an ICL or just another dcl? The USD had a little higher before it tags that upper line again, so Gold could go to the lows, we’ll see if they hold up next week. Remember, GOLD has not broken the lows yet, this could still be the ICL, and at least the selling should have helped the COT a bit. Let’s continue…
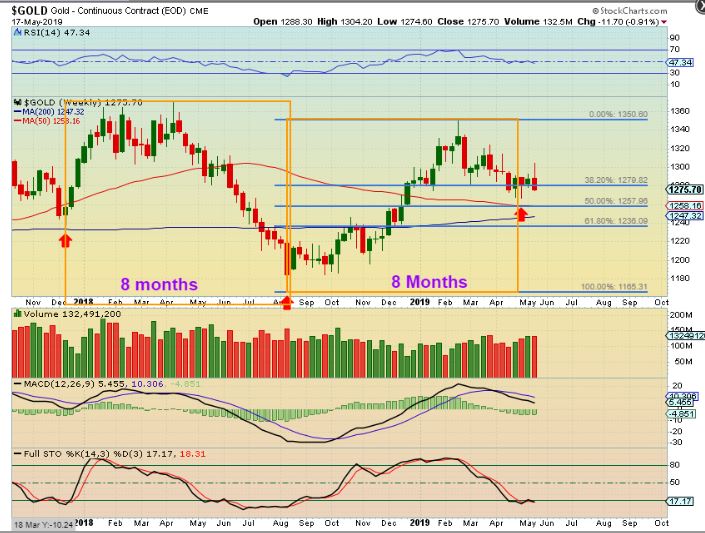
GOLD WEEKLY – You can see that Gold still looks like it may have more room inside of this pattern to chop around or drop. A drop to that 50 week MA even seems possible. Maybe the Blue line? If so, that obviously wasn’t an ICL in place, but we won’t know for sure unless the current lows from 2 weeks ago are broken.
GOLD WEEKLY – And we had a bullish pull back of roughly only 50%, and the ‘timing’ for an ICL was in line with our last intermediate cycle, so this looked very good as a possible ICL. So can this drop further?…
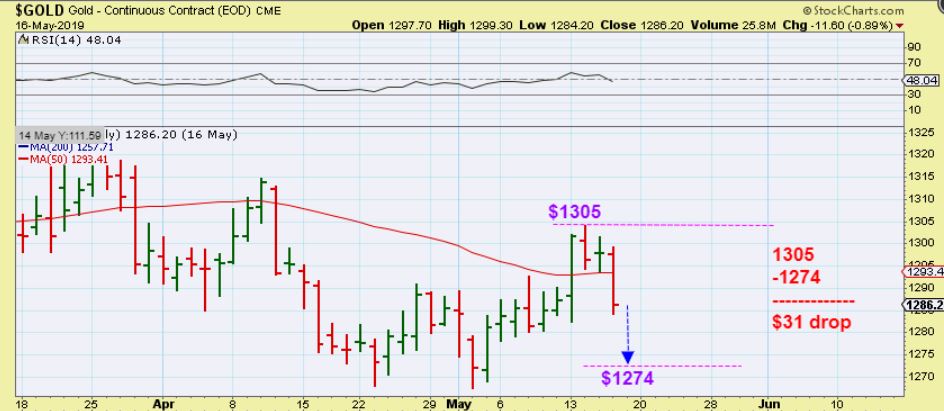
GOLD WEEKLY TARGET– Months ago my original Targets for the downside in Gold was $1240-$1260. We never quite got there, so now I have to wonder if we will. The current lows are $1267.30.
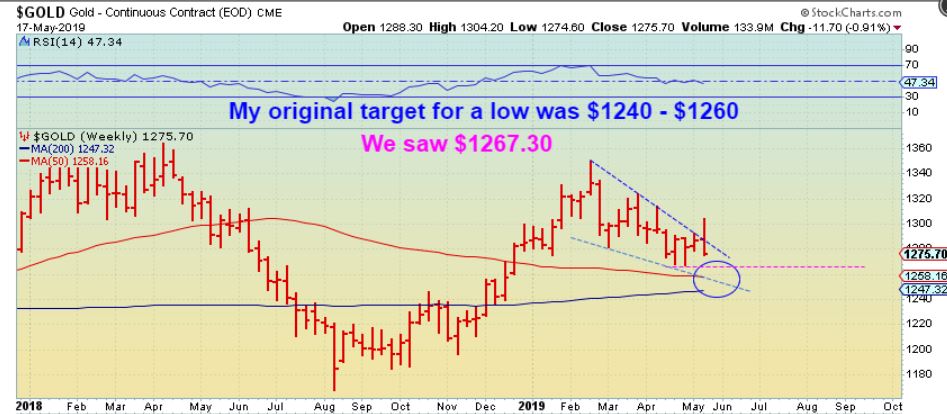
So maybe Gold can drop further, now lets look at SILVER & THE MINERS
.
SILVER – Silver breaking down here could easily be a bear trap. Silver ‘Bears’ see a break down and enter short positions, but it can be a trap as it reverses and breaks back inside of the pattern shortly after. Shorts would cover & a rally would begin.
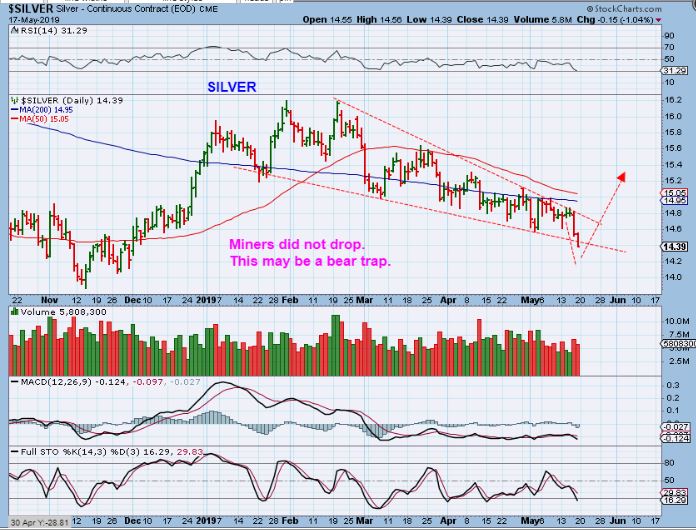
SILVER – Silver never really looked like it bottomed yet. To me , that break down looks like it could lead to back testing prior lows, since we are already close to those lows. That base of support has weakened. Silver may even do a shake out below the lows to draw in more shorts. I do see strong divergence on the weekly chart though, so that is a good sign. Recently Silver struggles at the overhead Moving Averages.
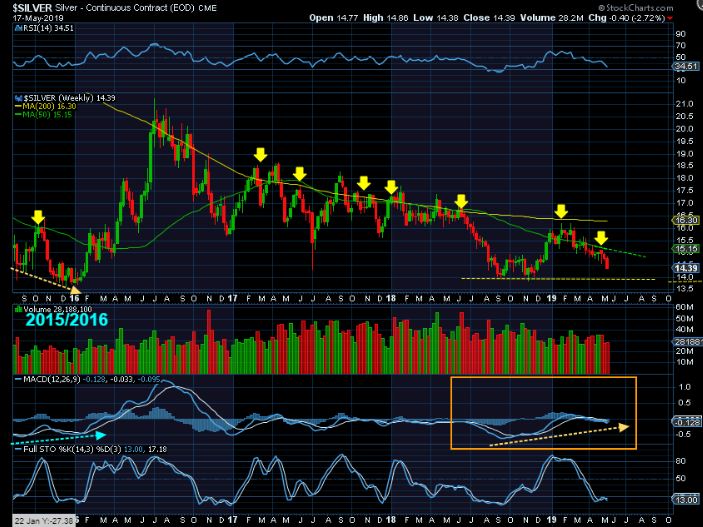
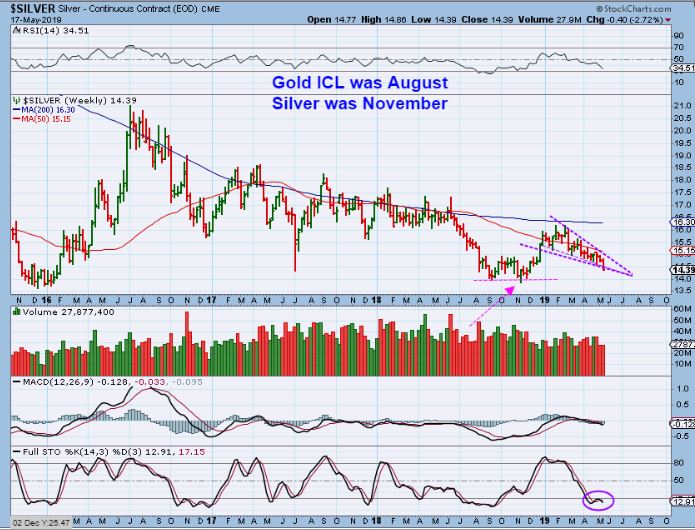
SILVER – The ICL for Gold was August, but remember that Silvers lows formed with a slight undercut in November. I guess that SILVER & GOLD do not have to be in Sync all the time. We could see that again, undercutting November and maybe even Jan 2016 lows, but that is strong divergence in the MACD.
.
THE MINERS: THIS IS WHERE THINGS GET VERY INTERESTING, THIS IS WHERE THINGS MAY NOT BE AS BAD AS THEY MAY HAVE SOUNDED ABOVE – ‘MIXED SIGNALS’
.
STEP 1, GOLD – Gold dropped over $10 on Friday. In fact…
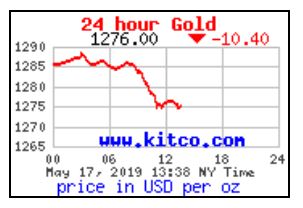
GOLD – Gold dropped Tuesday, Thursday and Friday, for a total of $31. If Gold dropped $31 last week, and $11.50 of that was on Thursday and $10 of that was Friday , Miners should have melted down & been destroyed at the end of the week, right? …
.
GDX #1 – So GOLD was down over $11 Thursday and Miners bounced off of the 200sma. Then on Friday Gold dropped another $10+ and GDX held support at the 200sma again and this time it even closed green?
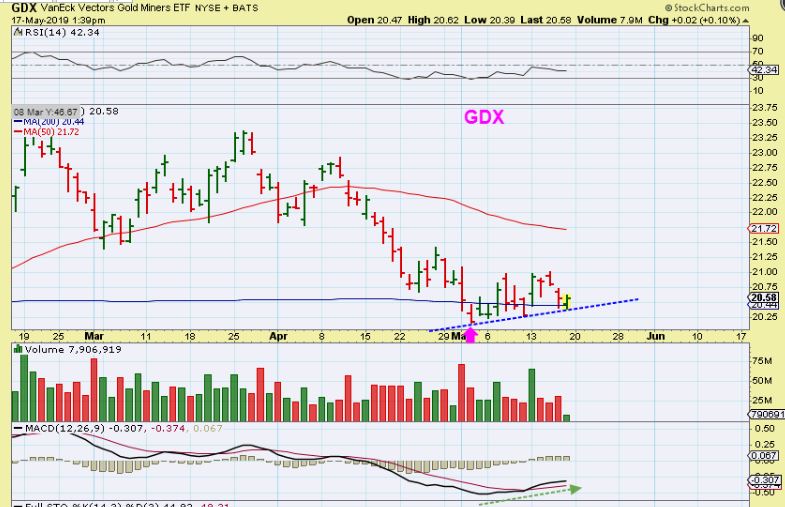
GDX #2 – And I drew this midday Friday to point out that the trend line held up perfectly and Miners went Green with Gold down $11.
,
ATTENTION PLEASE!
.
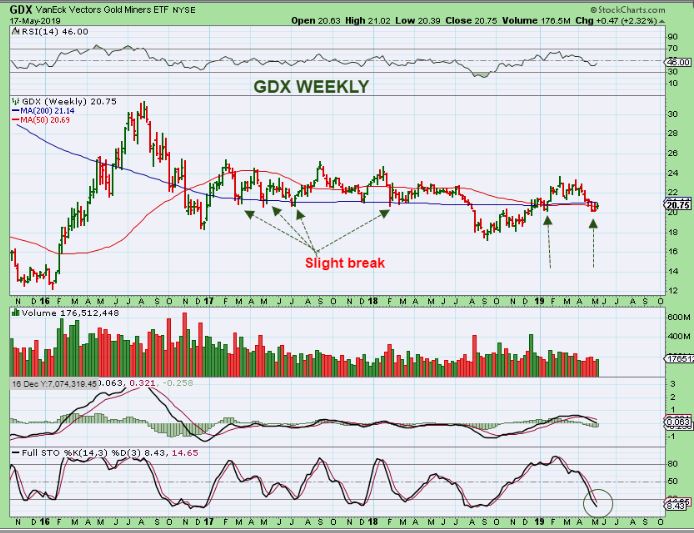
GDX #3 – VERY IMPORTANT*** Did anyone else notice that when Gold sold off $31 last week, Miners only sold off only 27 cents from $21 to $20.75? YES! AND…
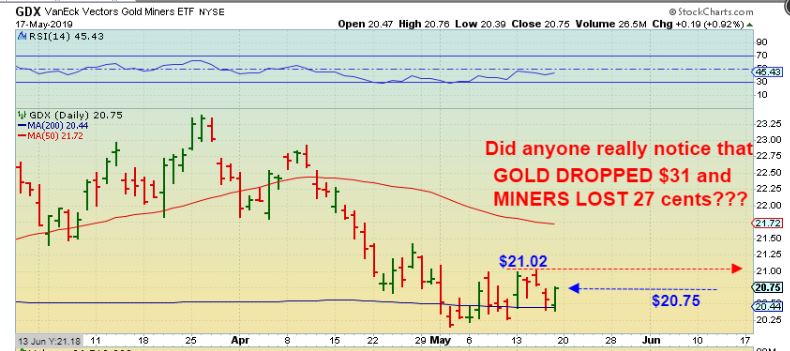
GDX #4 – Gold sold down $31 and even closed down $12 for the week, yet Miners closed up 2.32% for the week. That does show that the Miners resisted the sell off in Gold and the break down in Silver. If we get more selling in GOLD & SILVER, the MINERS may be telling us another story. Maybe it’s a story called ‘accumulation’?
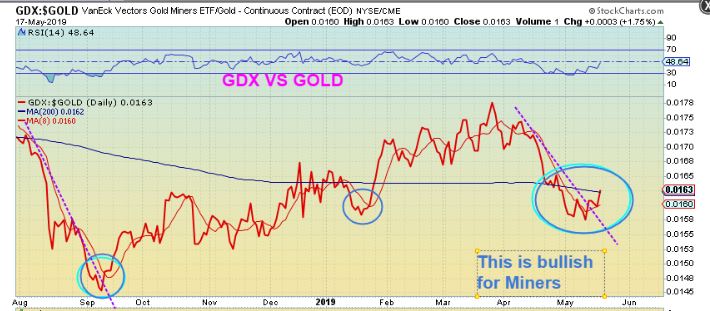
GDX / GOLD RATIO – Look at this. I see that the Miners took the lead and the GDX / GOLD RATIO is even breaking out higher with Golds drop. It held the 8sma & is breaking through the 50 sma as Gold plunges down. THAT is usually a bullish sign for this sector. Miners leading the metals. It shows that Miners are resisting Gold & Silvers selling. Miners may be leading the way higher from here. Lets take a Big Picture look at GDX weekly…
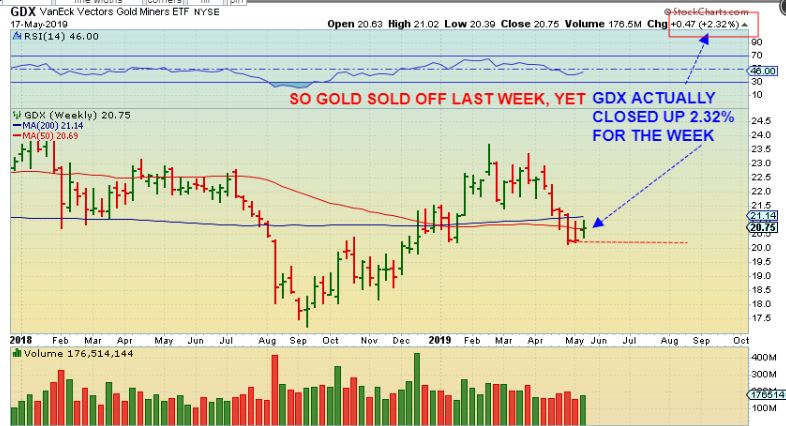
GDX #5 – And our Big Picture Chart was up for the week from last week. Hardly different from last week, but yes, It closed UP for the week 2.3%.
.
After last weeks selling in GOLD & SILVER, I would be willing to bet that many thought the Miners sold off too, and were down last week.
.
I’d be lying if I said that I know exactly what is going to happen next week, but based on the charts that I have presented to you here, you can see that we may need to expect the unexpected. The ‘unexpected’ happened last week. Gold sold down sharply, Silver broke down, and the Miners actually closed up 2% for the week? If this is a form of manipulation by the market makers, it could be that they are slamming down Gold & Silver to scare people out of the Miners – so that they can accumulate them as people sell out, right before a nice rally takes over.
.
If this chart below attached here repeatedly over the past several weeks is the kind of Rally that we’ll see in Miners, you can see why they’d need to accumulate some positions in the area that we are at now. That would be at the #2, before a 3 wave rally. Push Gold down $30 and sell Silver below the lows, and buy up the shares that the sellers bail out of. Nice idea. And then Miners close the week out up 2%. Sound possible to me. Time will tell.

.
Like I said, I’d be lying if I said that I know exactly what is going to happen next week, but last weeks trading was interesting to say the least. If we see Gold sell off again next week, and Miners drop & bounce back, drop and bounce back, you will realize that you may be seeing the buyers buying what the sellers are selling.
.
We’ll have to wait and see what next week brings, but last week was choppy and tiring, so Rest Up and enjoy your weekend!
.
~ALEX
.
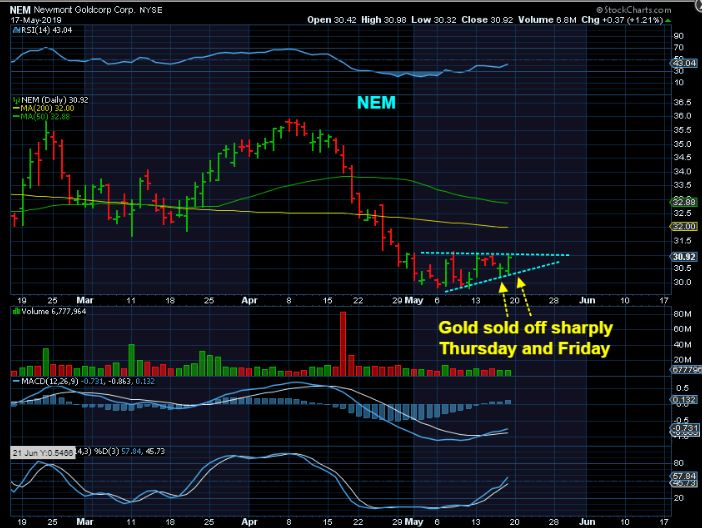
NEM – Gold sold down $30 Thursday & Friday and NEM closed up both days, pushing back up near daily cycle highs. Sounds Bullish.
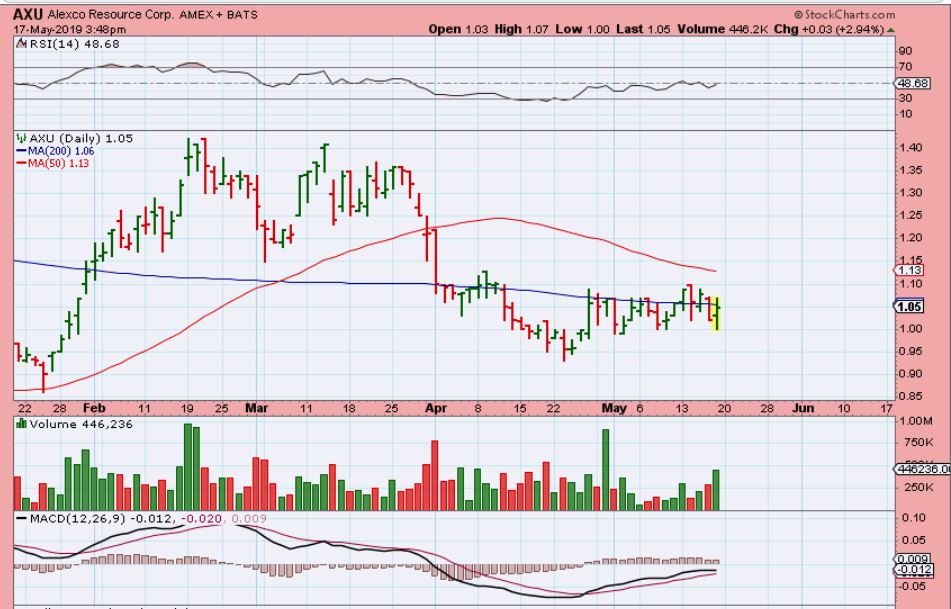
AXU – Silver crashed to new lows again, and AXU dropped and recovered with increasing volume. Someone must have been buying during the silver sell off, right?
NAK – NAK is back at the lows and suddenly pushes 16% higher as Gold & Silver crash down?
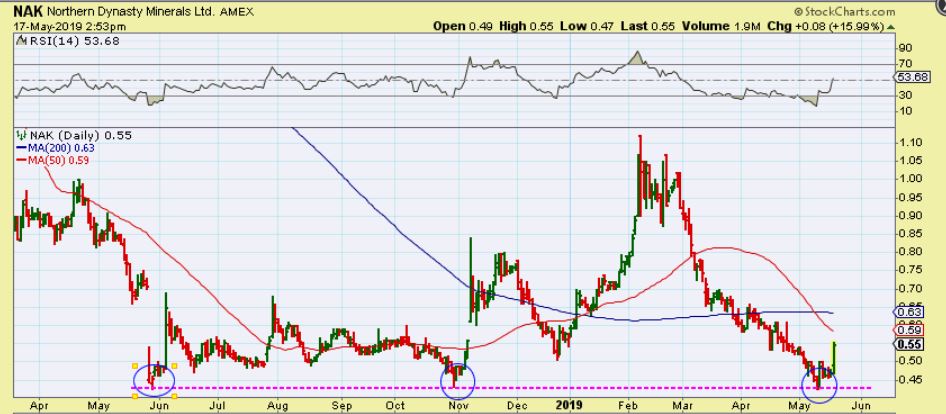
Those are just 3 of the many Miners that exhibited strength during a big GOLD & SILVER Sell off. Next week ought to be an interesting one too. Enjoy your weekend!

