Wednesday April 17th Trading
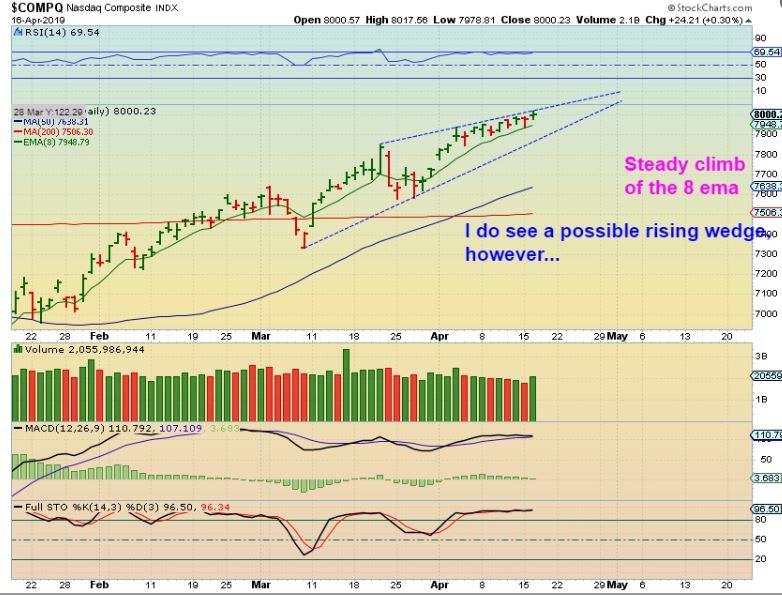
NASDAQ #1 – The NASDAQ has been climbing along the top of that 8 ema ( or 10sma) Bullishly.
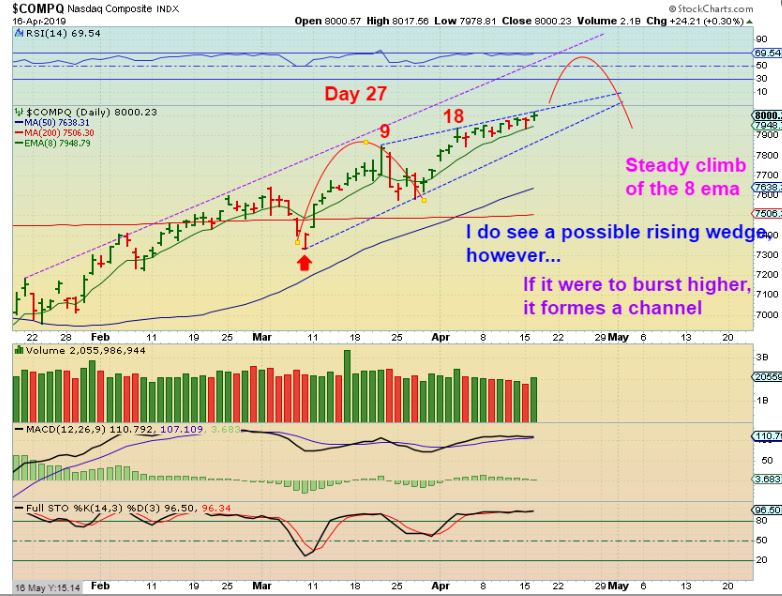
NASDAQ #2 – Usually a daily cycle can run 30 – 40 days and we are at day 27 . I looked at the last DCL, and notice that the entire dip came in a quick 5 day drop and 5 days later the NASDAQ was at new highs again. I do see a bearish wedge and we could break down, but this also has time to POP before a drop. Just use a stop if you don’t want to give any gains back, just use a loose one if you want to ride it out. AND…
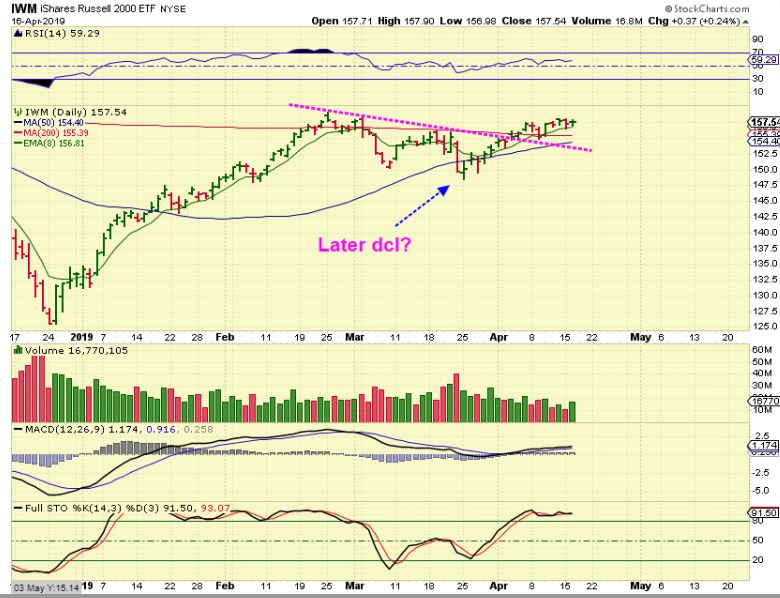
IWM – When I look at The Russell 2000 and The Transports, we had that break down & recovery. It has only been 16 days since the IWM lows, so when the Nasdaq pulls back, other sectors may chop around or do their own thing.
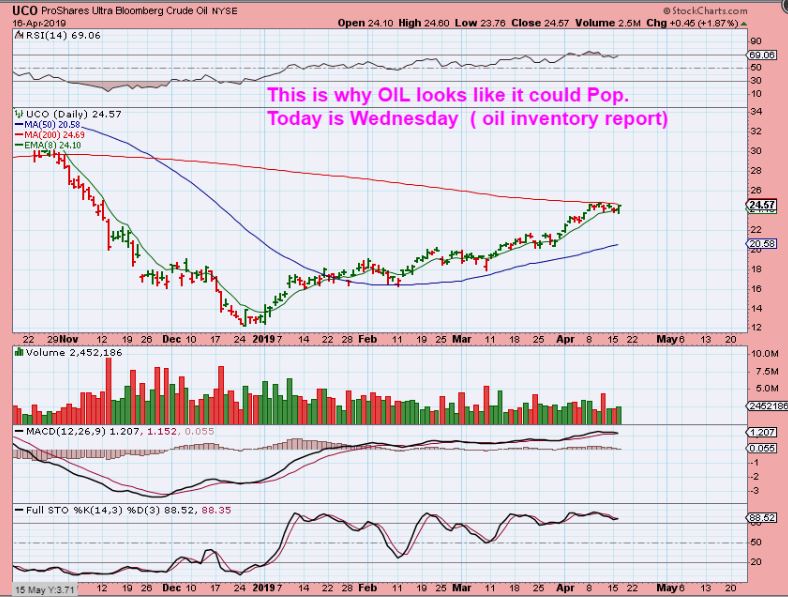
WEDNESDAY IS OIL INVENTORY DAY, AND OIL HAS CERTAINLY BEEN BULLISH.
.
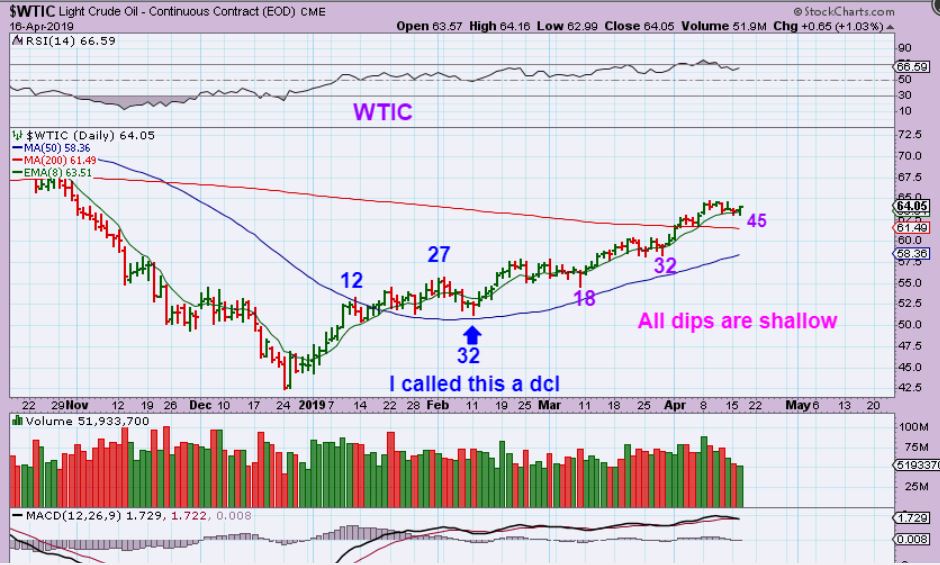
WTIC – Look at this run, with shallow dips and sideways chop. my last chart called for a sideways dip to a dcl, since we are on day 45, but this actually looks like it may want to do another quick run higher first. Why do I say that?…
UCO – The UCO has been crawling along the 200 sma, and it is pinched between the 8 ema and 200sma. A bullish inventory report would surely cause a break out higher, so watch Oil tomorrow. UCO will break out or break down.
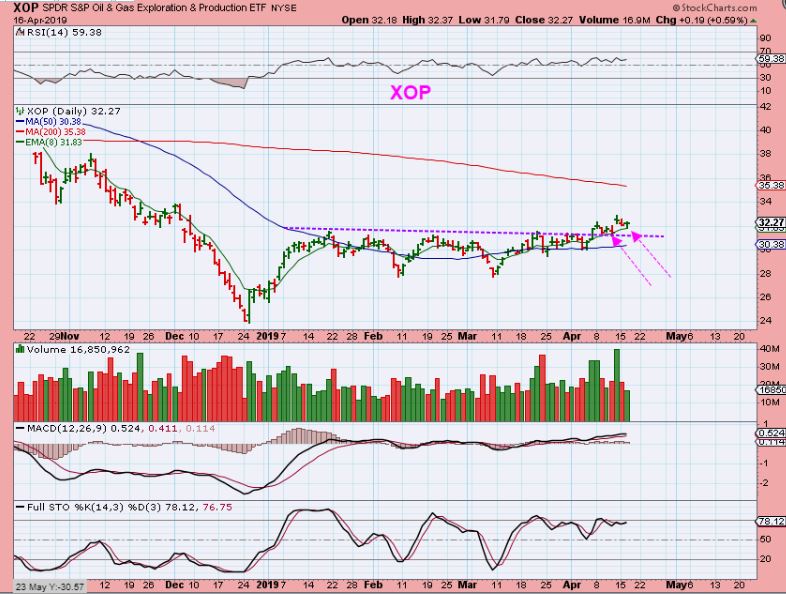
XOP – We have seen a long consolidation in XOP, XLE, and OIH, but they have started to move higher. I see some bullish looking Energy Stocks and will point a few at the end of the report.
.
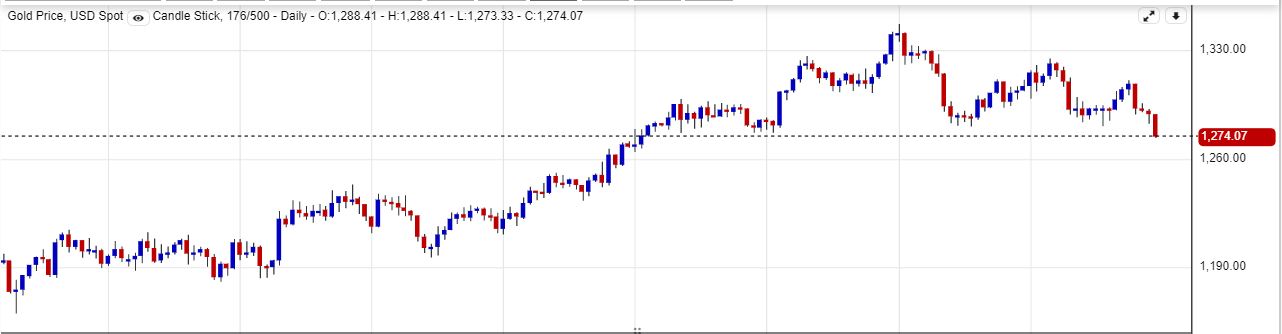
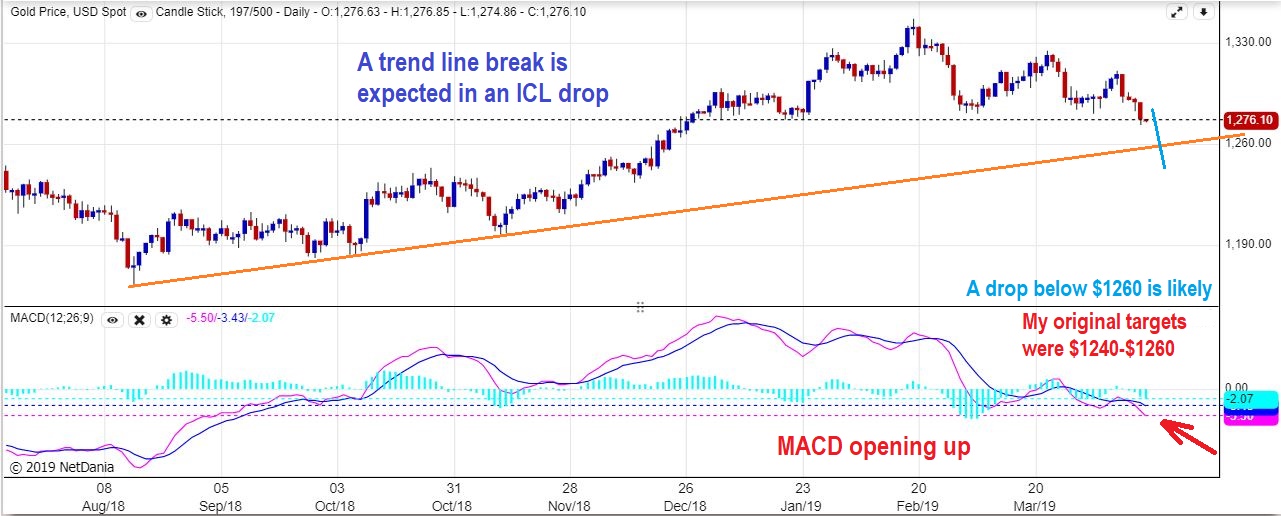
GOLD MIDDAY – Gold broke the lows from the last 3+ Months. Now we wait and see if we can get some acceleration in the selling.
.
GOLD – A drop to $1240 – $1260 may be enough, but I like to be patient and wait for the reversal.
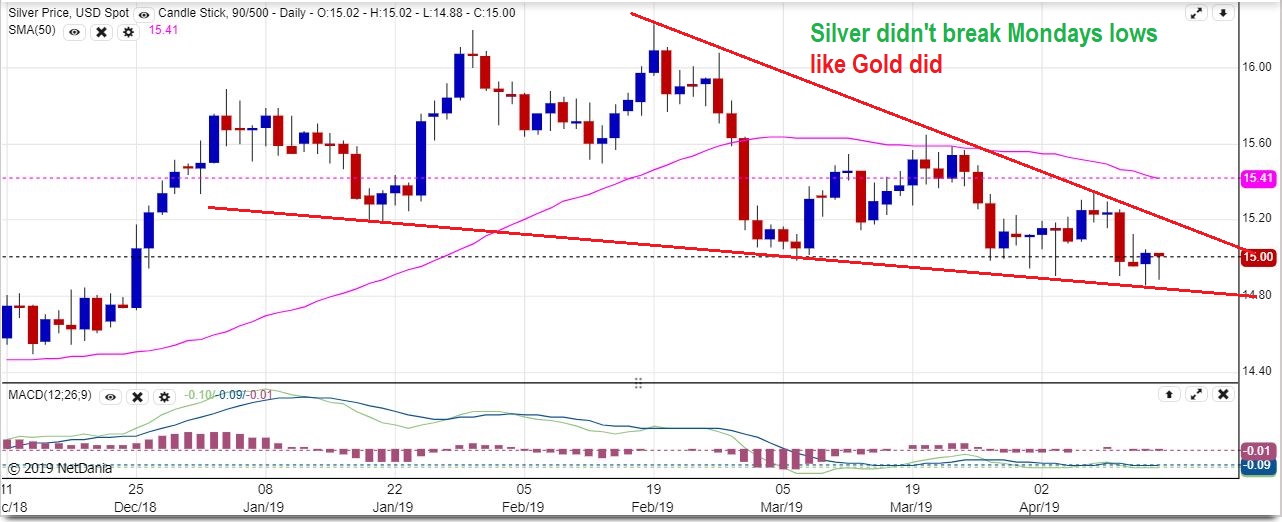
SILVER – Silver didn’t even break the Monday lows while Gold sold off.
.
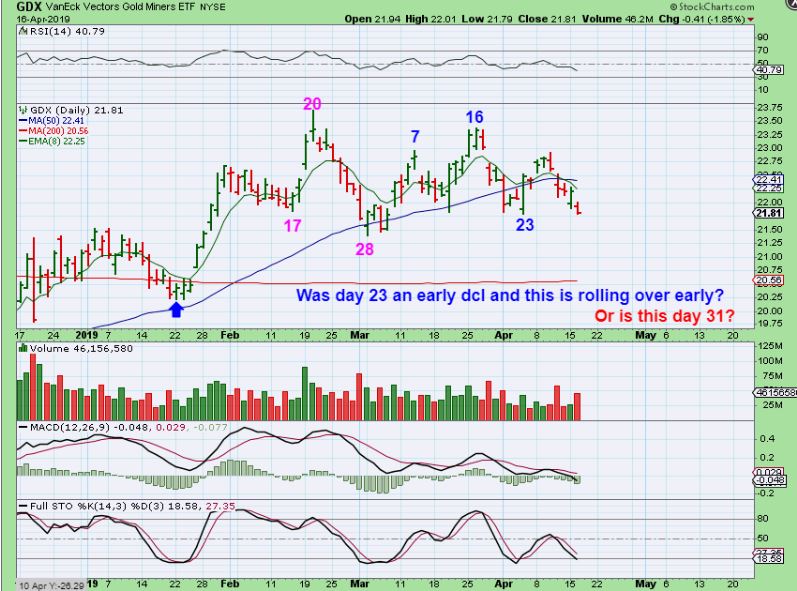
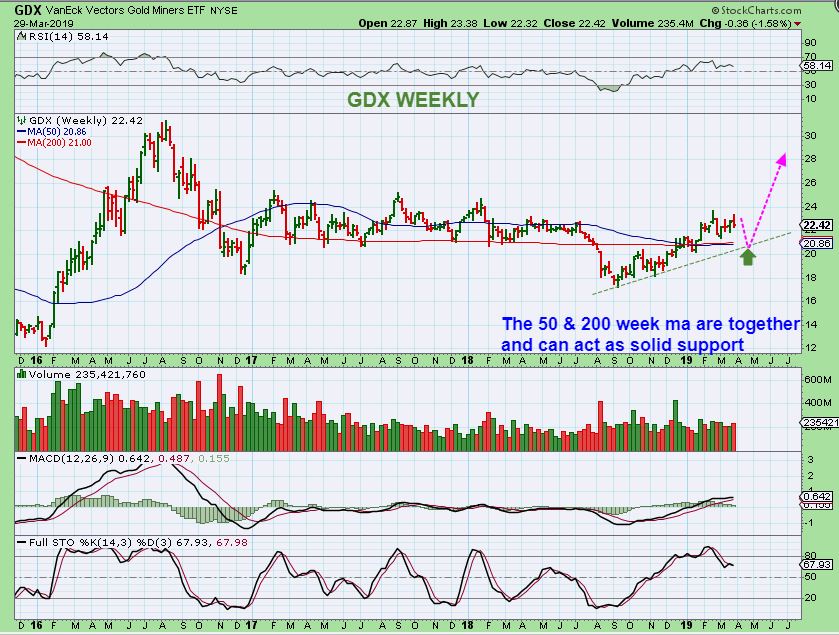
GDX – GDX & GDXJ sold down, but not as much as we would expect when Gold drops $11 or $12 . Cycle count is questionable, see the chart, but a drop to the gap fill at the 200sma would be great if we could get a drop like that.
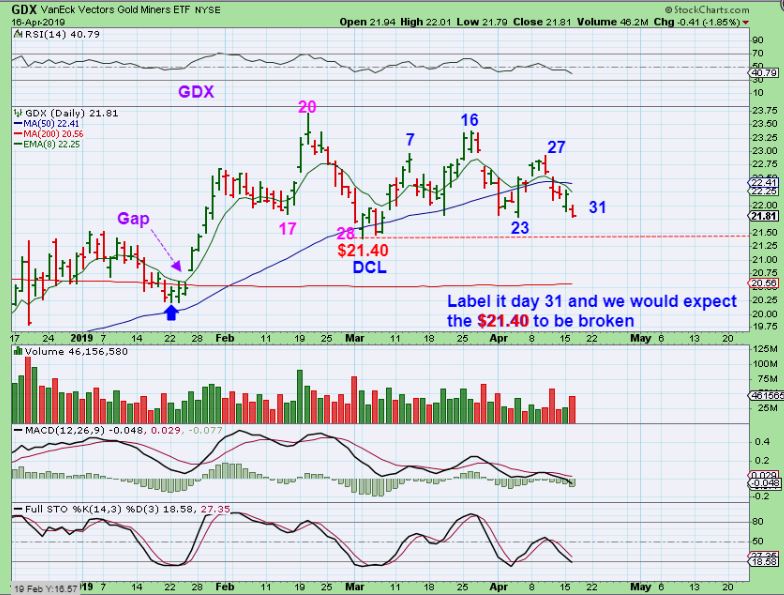
GDX – If this is all one daily cycle, the lows should be broken, so look for $21.40 to at least be taken out.
.
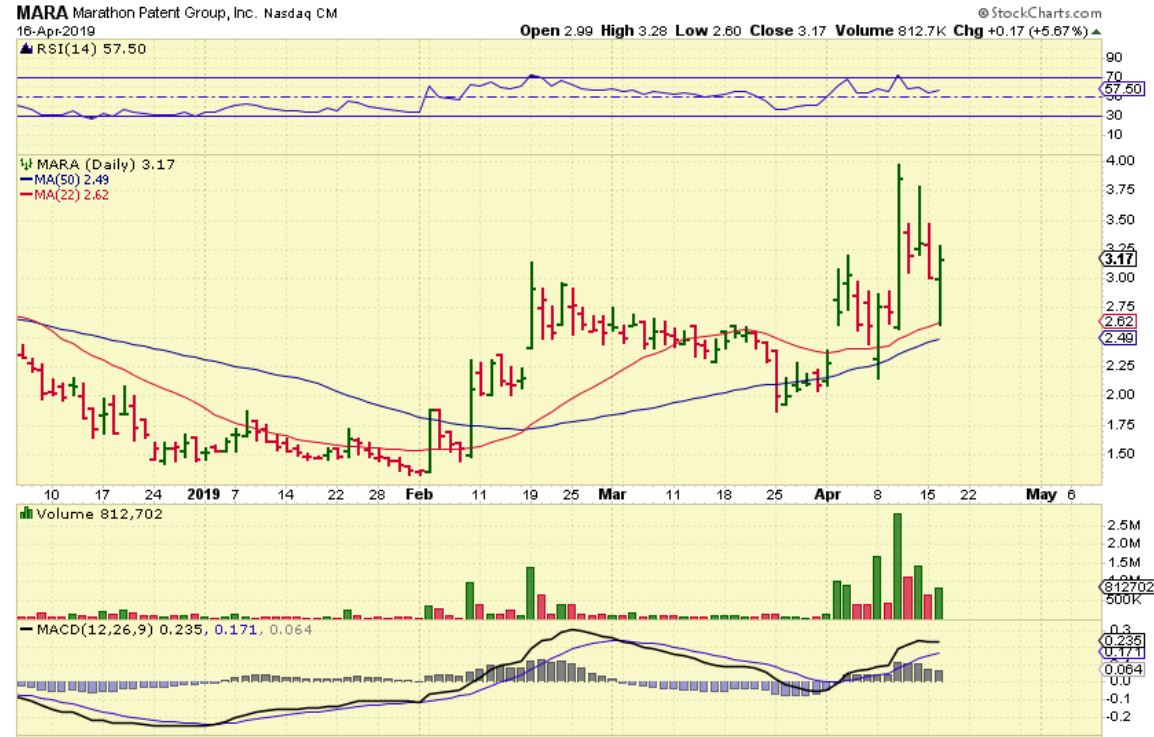
With some renewed selling in the precious metals, and Gold breaking recent lows, we can really start to anticipate a buying opportunity in the future for the Miners. We are due for an ICL, and this would be the best buying opportunity for the next run higher. Below I will ( by popular demand), have a few trade opportunities for those that like to trade. I still own AG & LODE, but I’ve also been trading ( TGB, HVBTF, MARA, FLWPF, etc ). I do have maybe 30% of my account in cash for the ICL, and some trades that I have I may also just be ready to sell and switch over when the time comes to buy Miners. The next run could be the Big one.
.
Enjoy your Wednesday trading!
.
~ALEX
.
Click to enlarge the charts if needed.
BITCOIN last week – 1 hr chart – I have been discussing this consolidation pattern in Bitcoin after the initial ramp up.

.
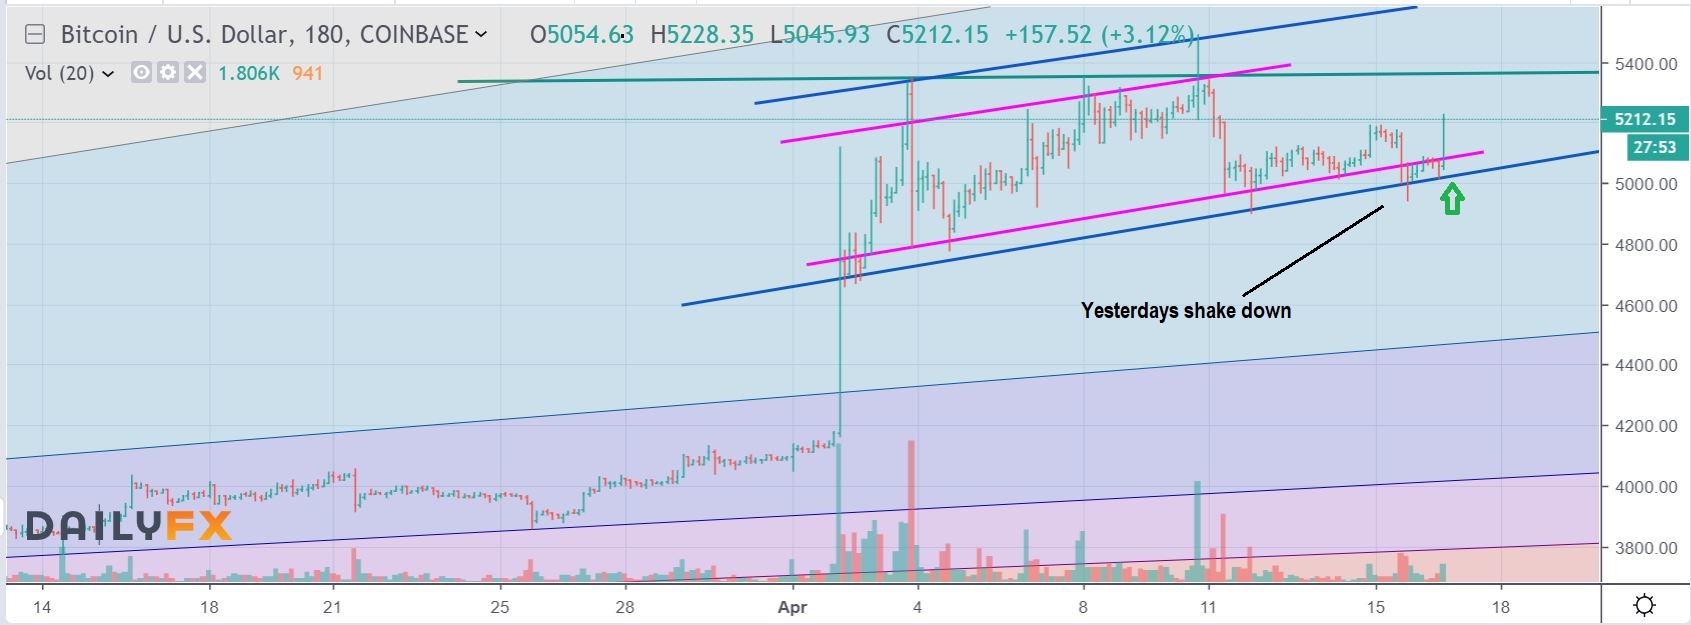
BITCOIN 2 hr chart – After a false break down, Bitcoin Popped midday yesterday, and the Blockchain stocks responded.
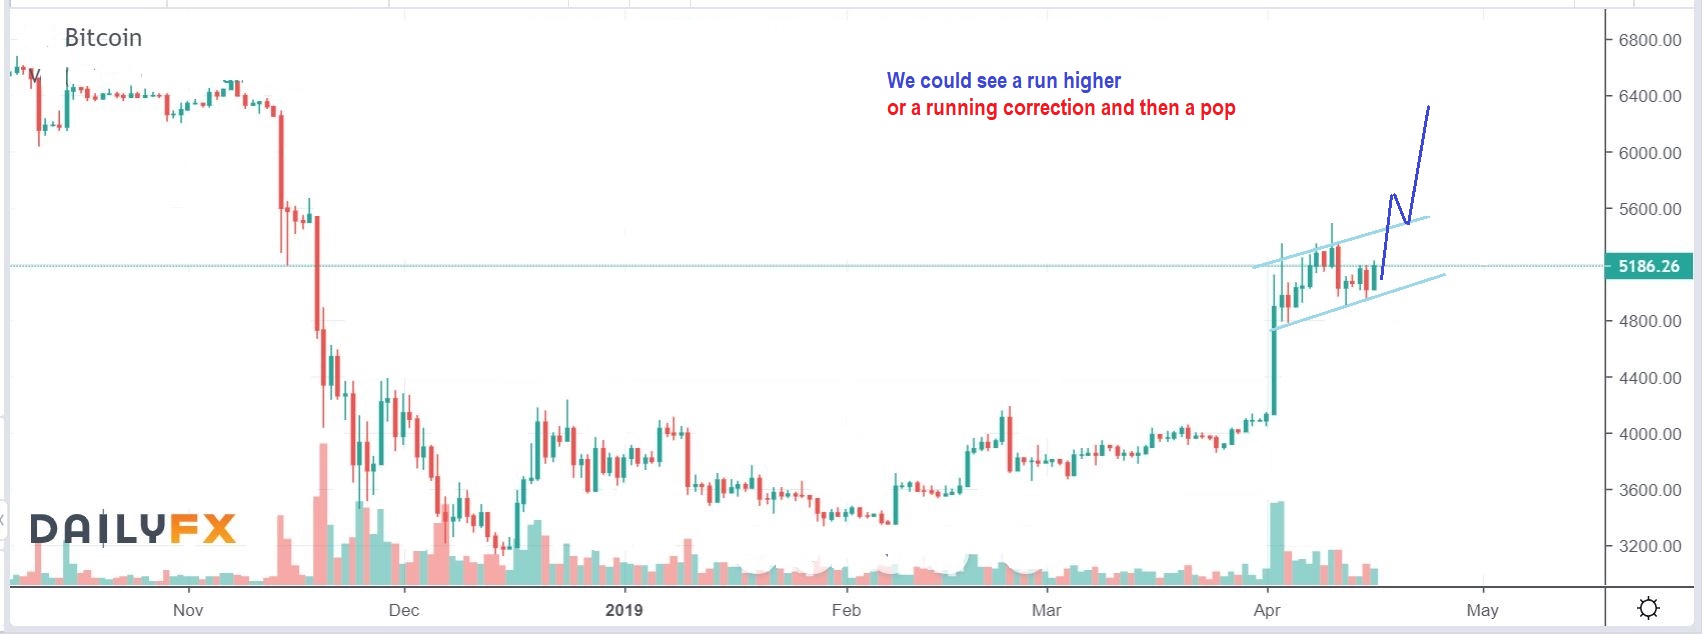
BITCOIN DAILY – So I would expect this to run to the top of the consolidation and continue to consolidate in the same choppy manner, or it may break out & complete the run to $6000 area as shown here.
.
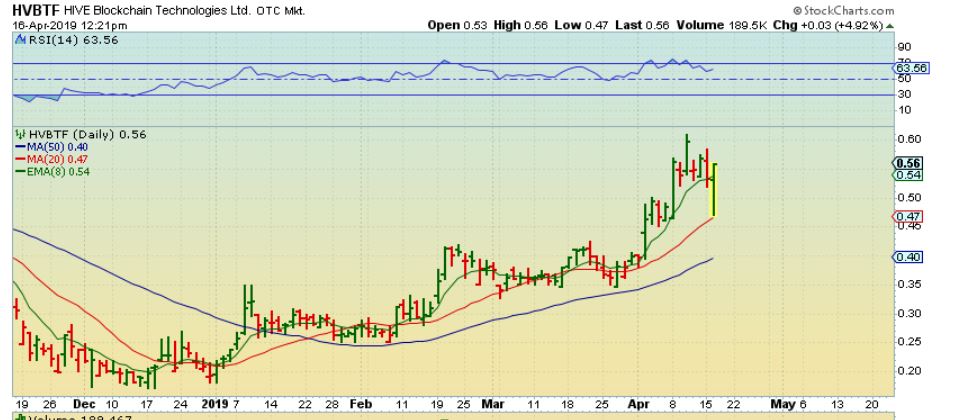
HVBTF – This was quite a drop & recovery, right to the 20 sma support.
MARA – MARA did the same type of drop & recovery. These are BIG moves, running from $2.60 to $3.28 Tuesday. Thats roughly 70 cents on a $3 stock, so this is NOT an easy ride.
.
SOME ENERGY STOCKS ARE LOOKING BULLISH
.
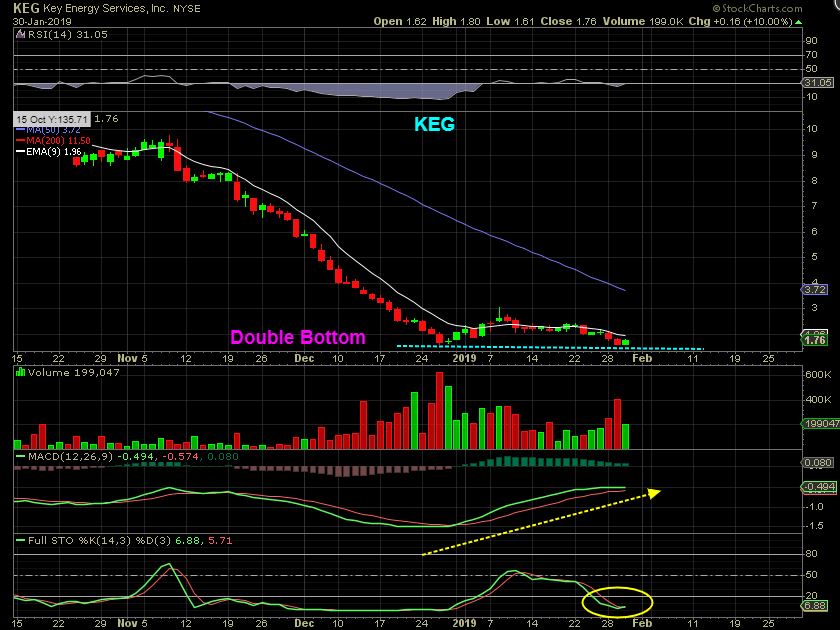
KEG – Do you remember this double bottom on KEG , recommended at the end of January?
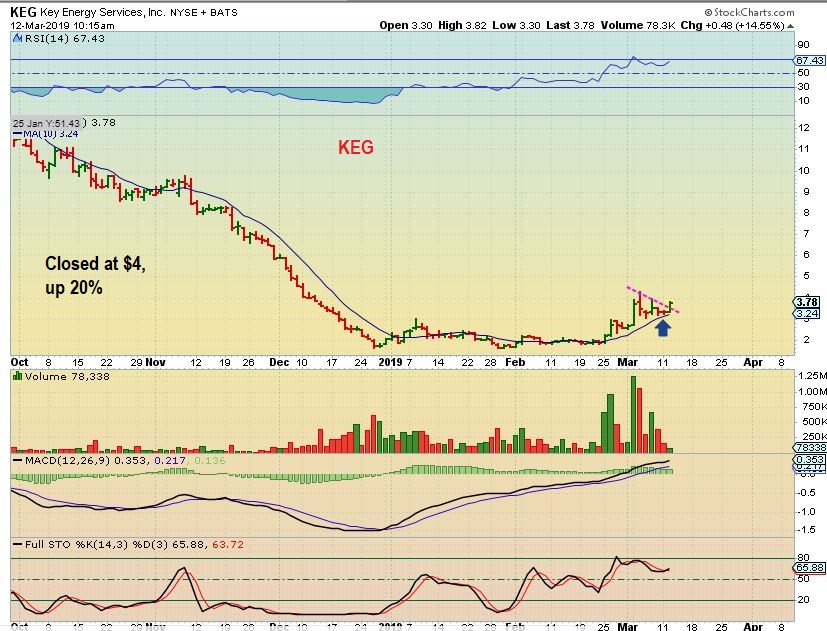
KEG – It ran from $2 to $4 and then offered this bull flag, so I posted this as a buy . It then ran to $6. What if you missed that run from $2 to $6?
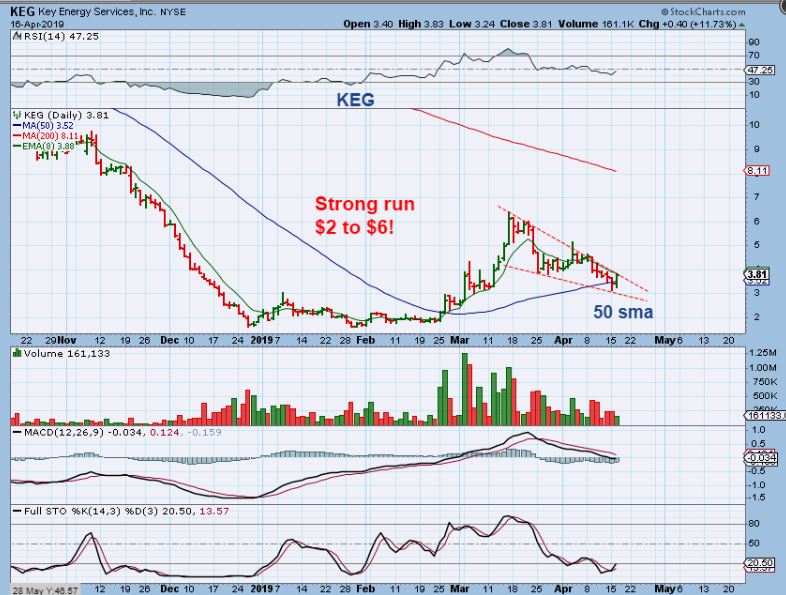
KEG – It has now dropped to the 50sma near $4 again, and this may be setting up for the next run ( to $8). This is a bullish descending wedge. It is a low risk opportunity, since the downside is minimized with a stop, someone could buy the break out.
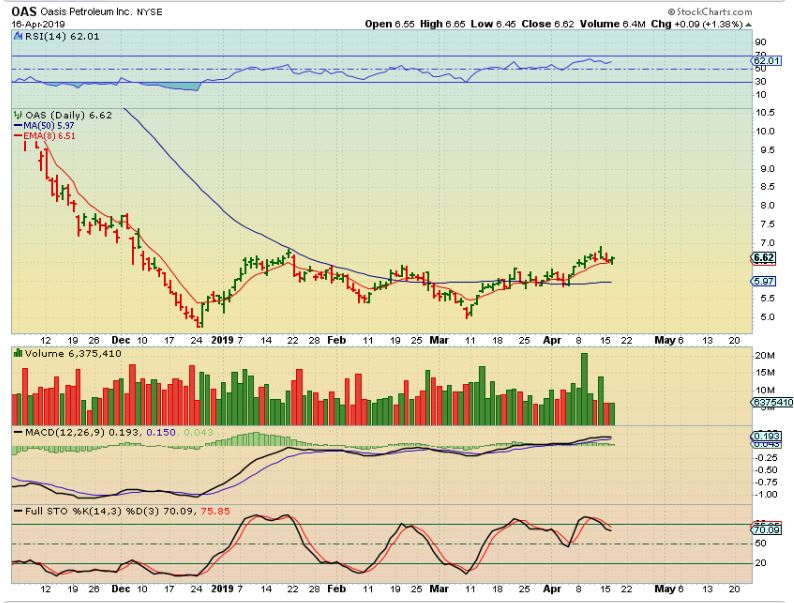
OAS – I wanted to show the progress that OAS has made, since recommending it under the 50sma. Admittedly, it has been slow progress, crawling on top of the 50sma, but it is moving higher , and…
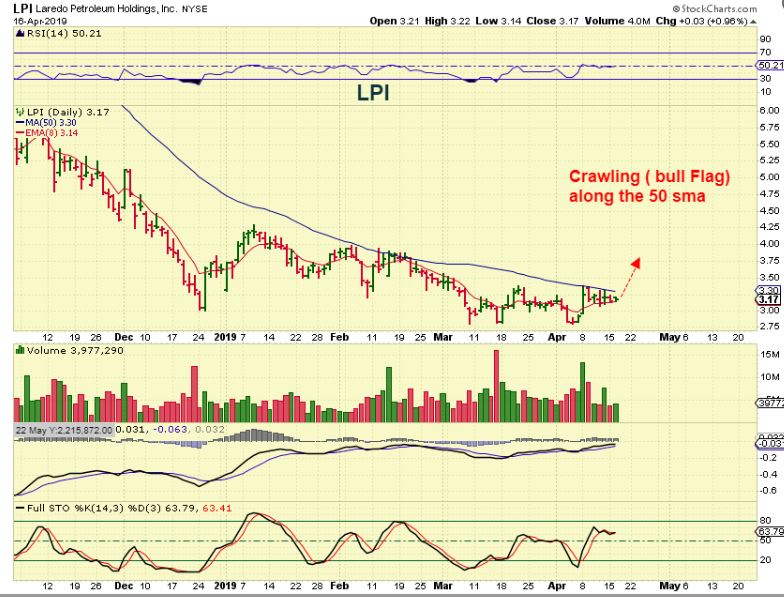
LPI – LPI has a similar set up as OAS before it broke out. IT has crawled along under the 50sma. This can go on a watch list and is a buy if it breaks out.
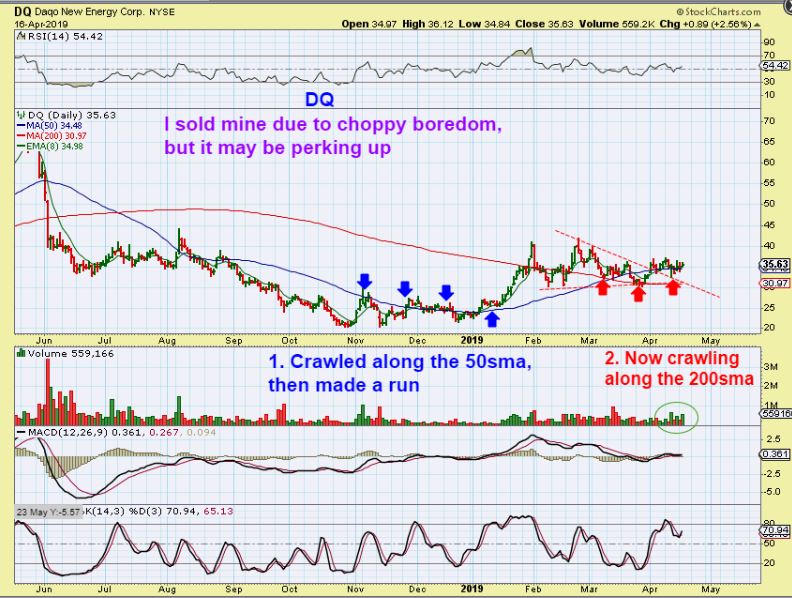
DQ – I owned DQ, but sold it a while ago. It has chopped sideways , but it has done so in a constructive manner. Notice how it acted at the 50sma before ramping up higher from $23 to $40. This has been crawling along the 200sma. Lets zoom in…
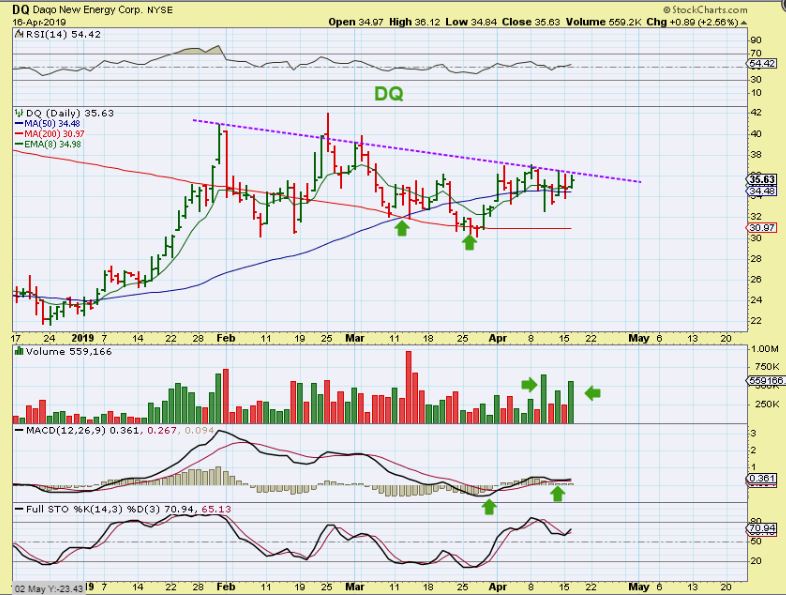
DQ – This can go on a Watch list too. A break higher should break the consolidation down trend, and when DQ moves higher, it usually does so nicely. Volume has been popping lately too.
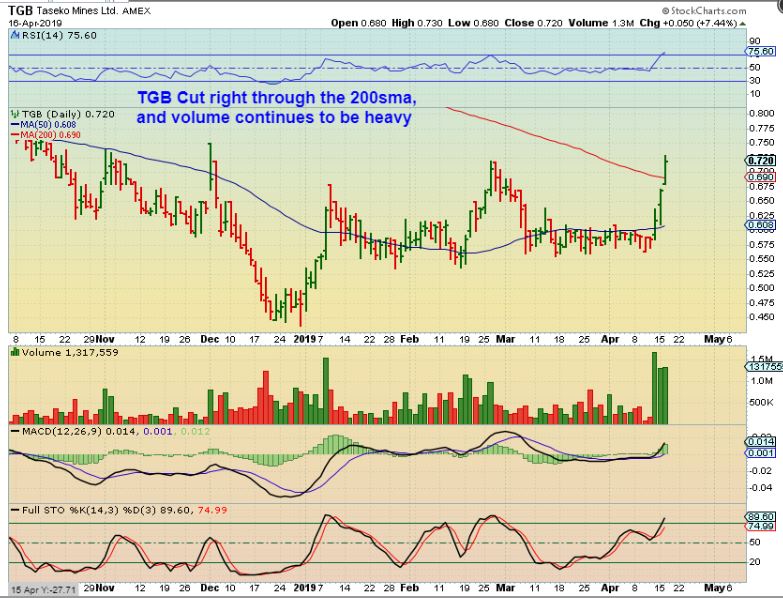
TGB – Using this chart, I mentioned buying TGB yesterday , as it breaks from this consolidation. The volume has been very high and that is often fuel needed for a good push higher.

TGB – With that volume, TGB cut right through the 200sma yesterday. I hate to recommend it after 3 big days, but it is a break out, or maybe a back test of the 200sma could be an entry later, but this looks very good. If you own it too, I would continue to ride it, because …
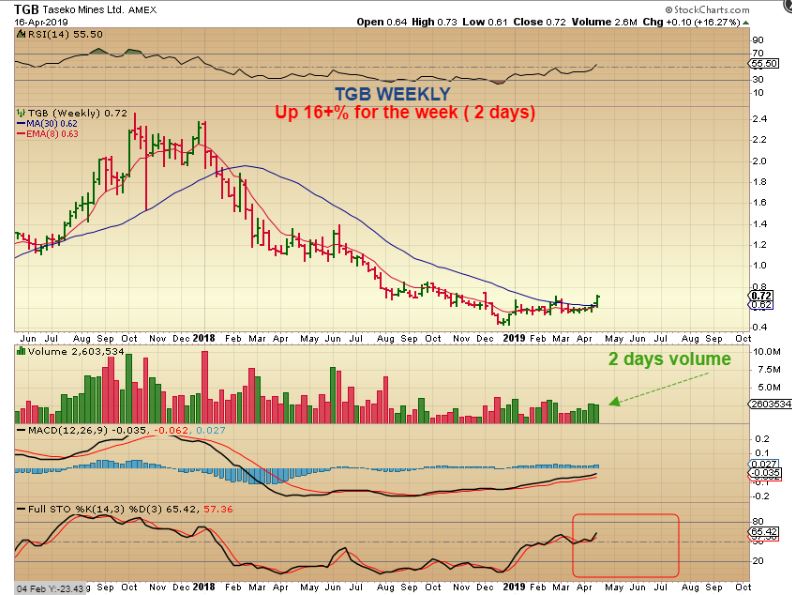
TGB WEEKLY – The weekly chart shows a break out too, and the volume is already as big as prior full weeks. (Watch list). You can still just jump on, the weekly isn’t extended, but it may be getting extended on the daily soon, and it might pull back to that 200sma again.
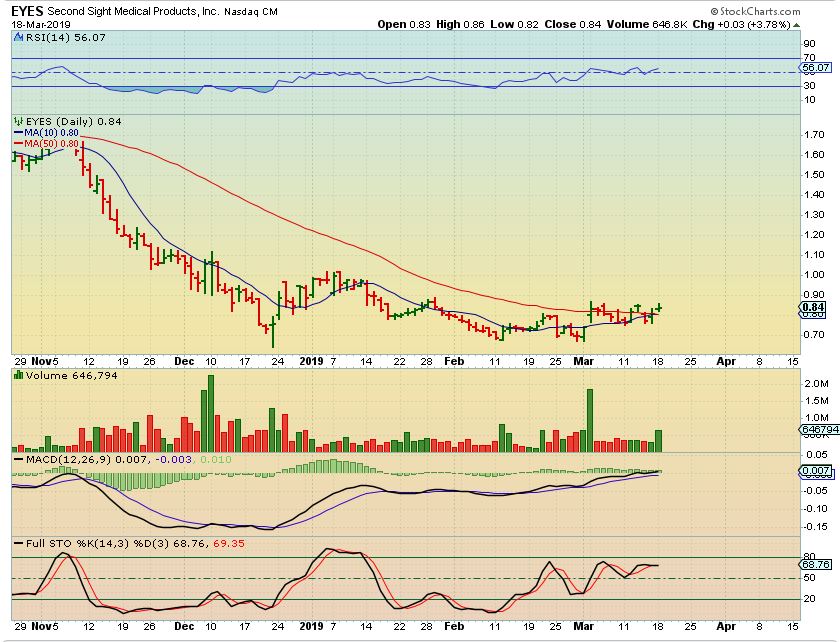
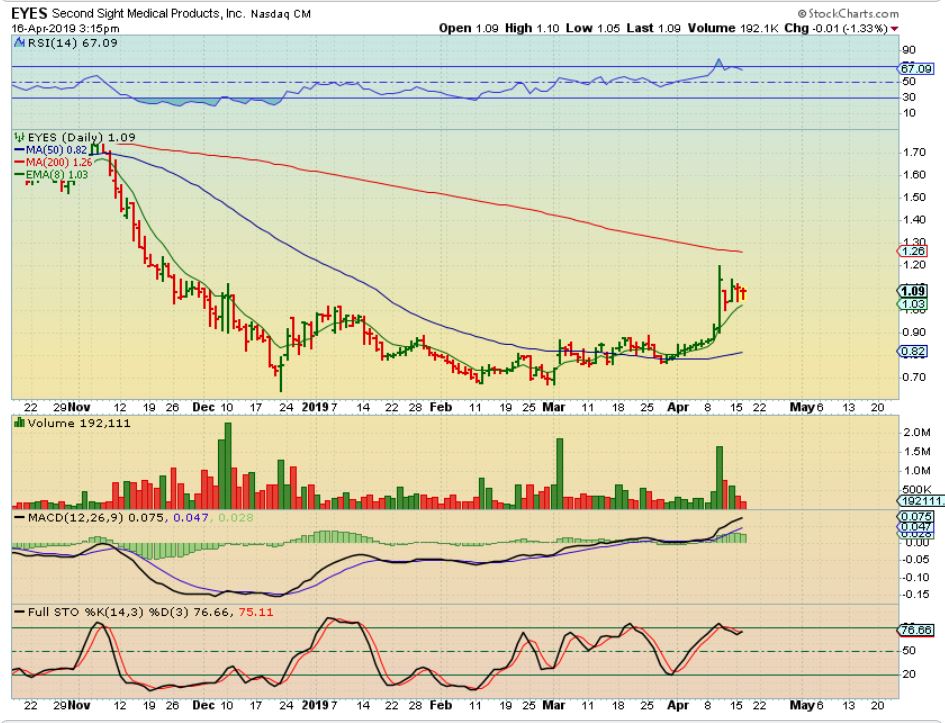
I posted this chart of EYES in March for the Base with strong MACD and the volume POPS, so I posted this buy above the 50sma ( I actually personally didn’t take the trade). It continued sideways for a bit and then…
EYES – Popped in a very big way a week ago. Now this may be a bull flag consolidation, building energy to attack the 200sma. Buy as it breaks the flag… Another for the Watch list.
LJPC – I owned this for a while and locked in profits, but it has continued bullishly crawling along the top of the 50sma as that 50sma curls upward. Since it already did the back test of the 50sma, it may be starting higher as of Tuesdays pop. This really could make good gains if it gets going. So far sideways is boring, but once these run higher they can pick up momentum.
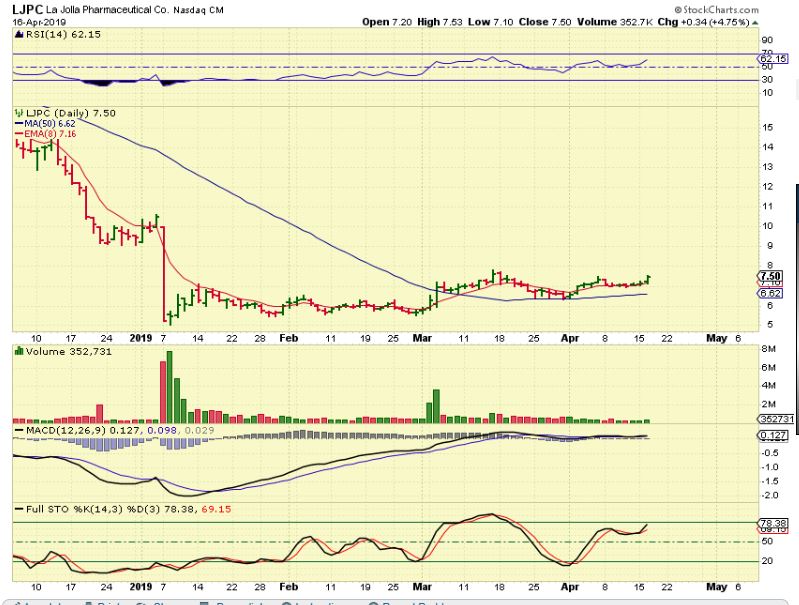
Don’t jump into this yet, but keep an eye on it if you are a trader:
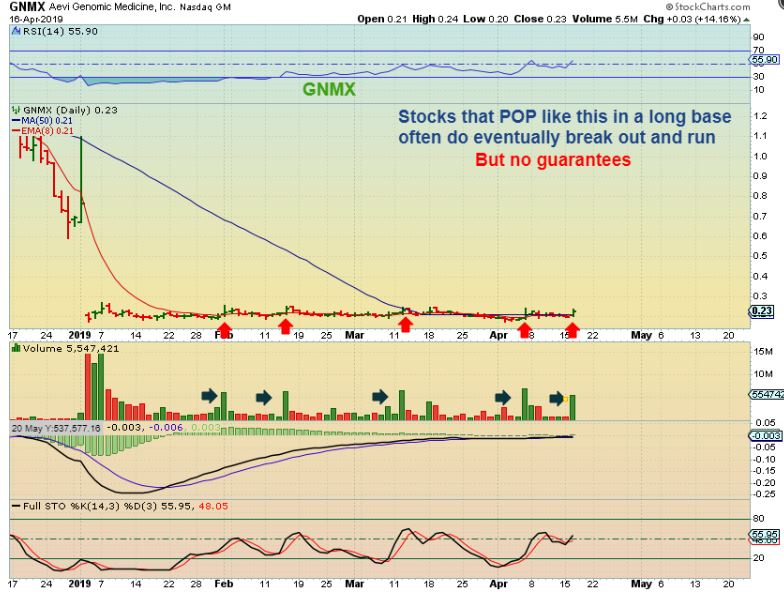
GNMX – I feel like this one wants to run higher soon, it could actually fill that giant gap on the left. I wouldn’t buy it until it breaks above these peaks though. Why? It may just continue to chop sideways and become difficult to hold week after week. This could be ready to go as soon as today though ( watch list)
MU – MU has been pinched between the 50 & 200 sma. Buy here with a stop or buy a break out.

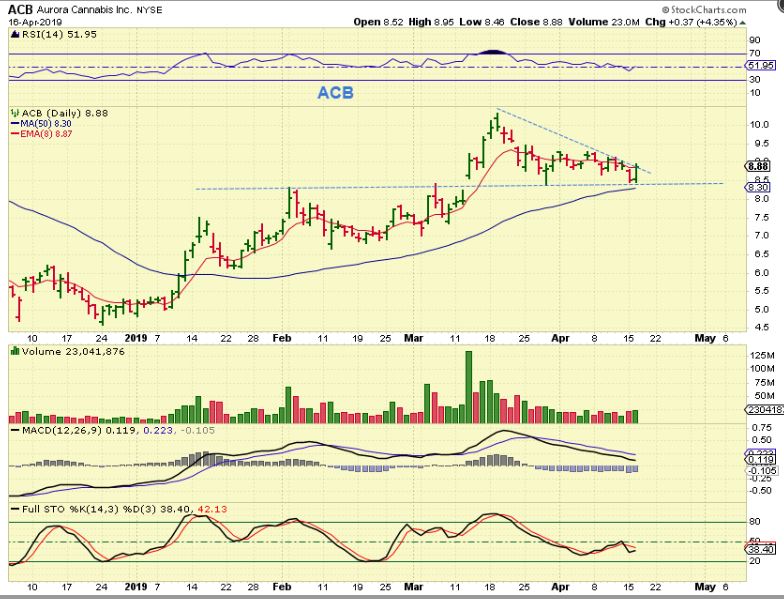
ACB – Low risk with a stop. MJ Stocks sold off to support areas. I don’t know if this is ready to go yet, but a break of that down trend should be bullish, and that could happen this week.
.
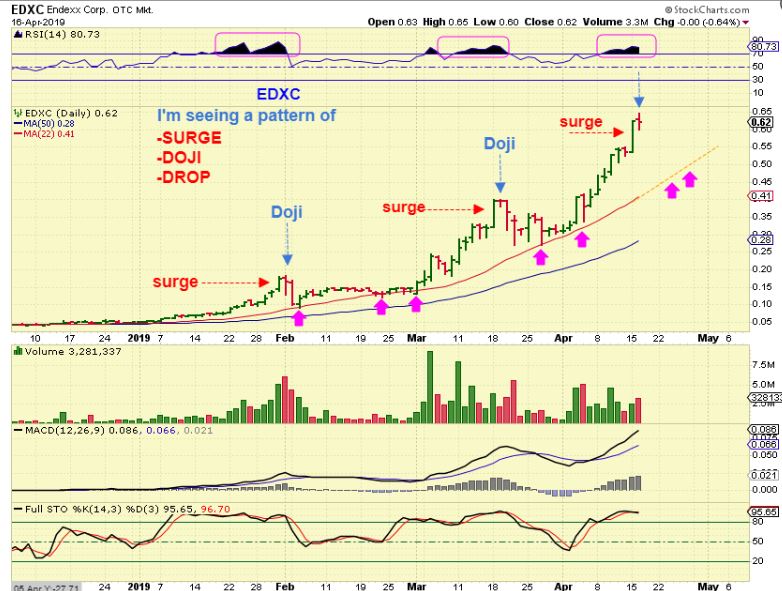
JUST AN OBSERVATION- Don’t shoot the messenger
,
EDXC – If this pattern continues, EDXC might finally be ready to pull back for the 3rd time. It has had 2 strong dips, and notice what happened at the top of each peak. Look for the Surge , the Doji, and then the Dip to support.