Tuesday April 9th
On Monday, the SPX & NASDAQ made higher highs, but the DJIA dropped 83 points, Overall, the markets had that bullish continuation look. They are getting extended and it is day 20, so keep that in mind if you are long. You may decide to ride dips out, you may want tighter stops or lock in some gains at some point. We should also take another look at the TRANSPORTS AND THE RUT.
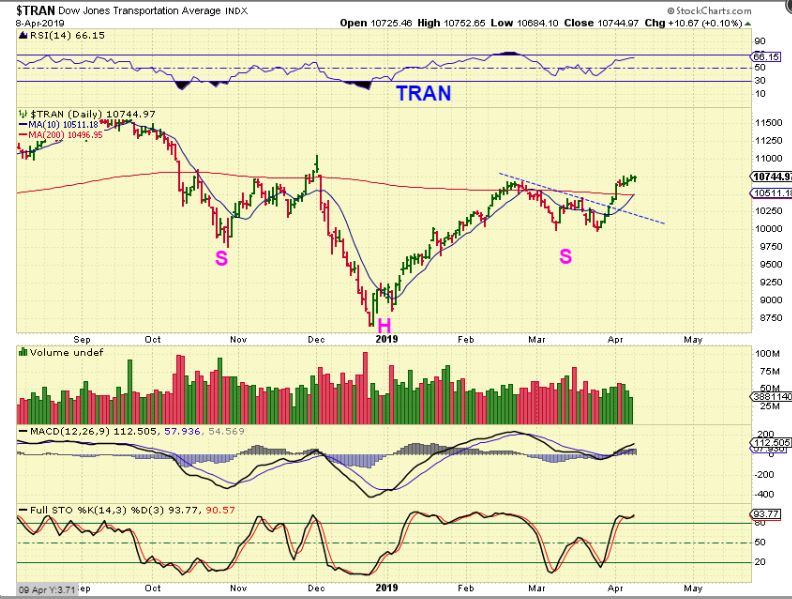
TRAN – The transports looked weak 3 weeks ago, but after breaking above the blue down trend line, and the 50sma, they took more of a bullishly improving look. In technical analysis, that is a buy with a stop. Now add to that the recent break of the 200sma and the TRAN has slowly stretched higher.
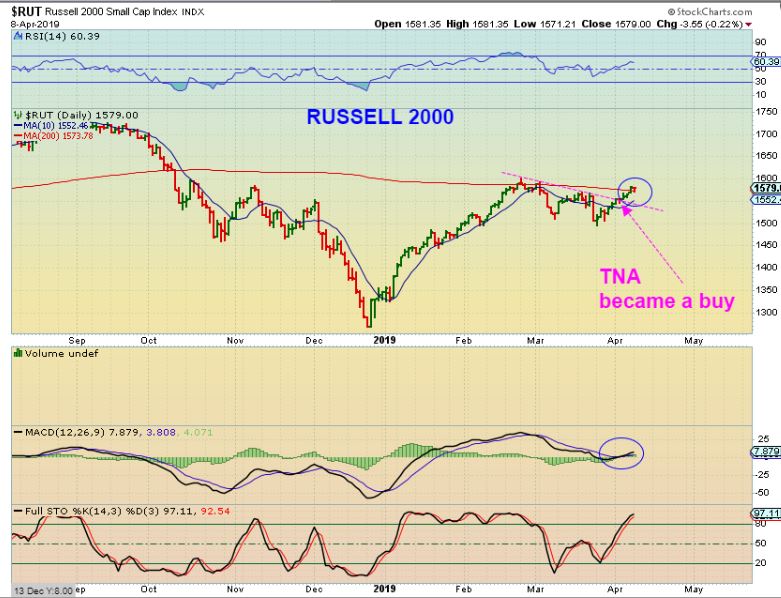
RUT – The Russell 2000 is lagging a bit, but it is also improving.
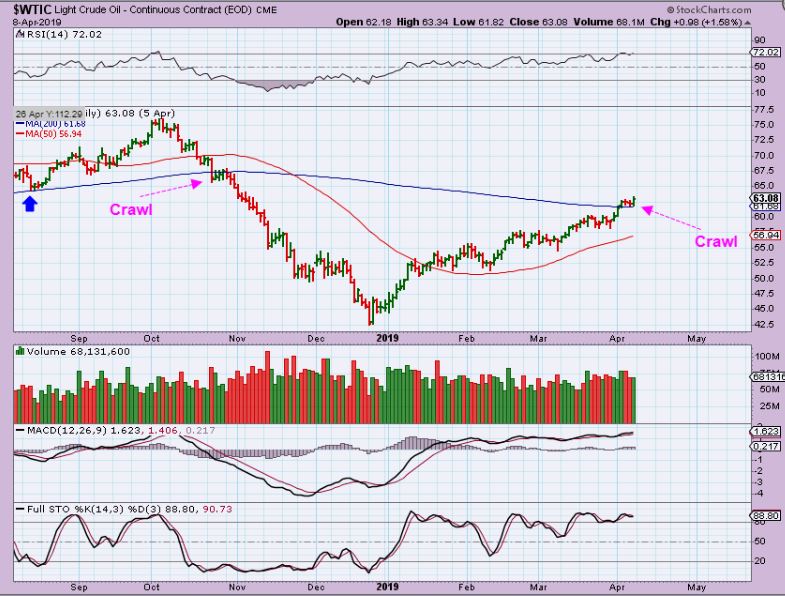
WTIC – Oil has crawled along the TOP of the 200 sma and remains bullish.
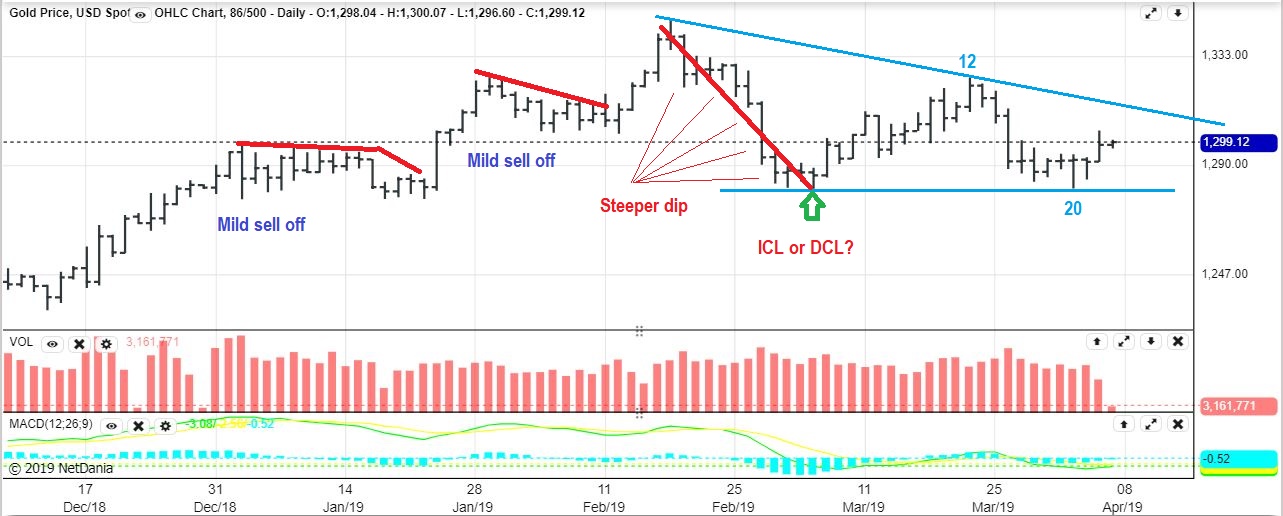
GOLD – We discussed that Gold has had some Mild dips into the DCLs in 2019. The last dip was steeper, so could that have been a Mild ICL? It seems unlikely, but it is slightly possible, so we keep that in the back of our mind until this current daily cycle breaks those lows or breaks higher. ( In technical analysis, you can buy these reversal candles hoping for a run higher, but using a stop under day 20 lows). Breaking above day 12 would be bullish, below day 20 is bearish.
GDX – We have a similar set up in GDX. As you can see on this chart, GDX has actually been chopping sideways at this level since January. I would have expected it to roll over and drop into a more pronounced ICL type drop, but now I am watching to see if day 23 lows hold up or is broken. It seems more likely that we have another drop ahead, maybe after a gap fill & tag of the upper blue line?
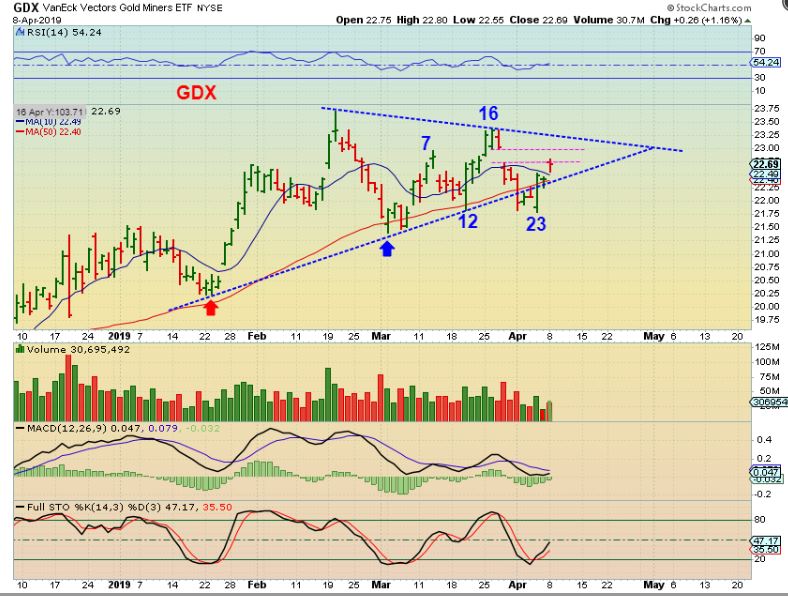
.
So for the Miners , it seems more likely that we have another drop ahead, but individual Miners have been doing their own thing. I mentioned in the comments yesterday that SBGL had actually made new 1 year highs midday, and TRX is also at 1 year highs. On the other hand, last week we saw reversals at the lows for CDE & FSM. They made a Double bottom low, so those could actually be bought with stops too. I will post charts of TRX & SGBL below, along with a few other ideas.
.
Enjoy your Tuesday trading!
.
~ALEX
.
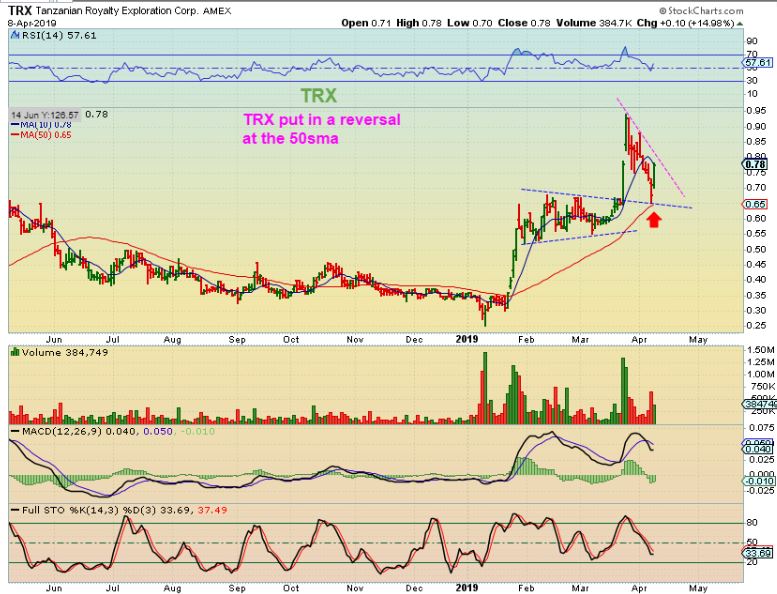
TRX – TRX dropped for 9 straight days to the 50sma, and then reversed there. Monday saw price spike another 14%, so again you can see that some of these Miners are acting bullishly despite their pull backs.
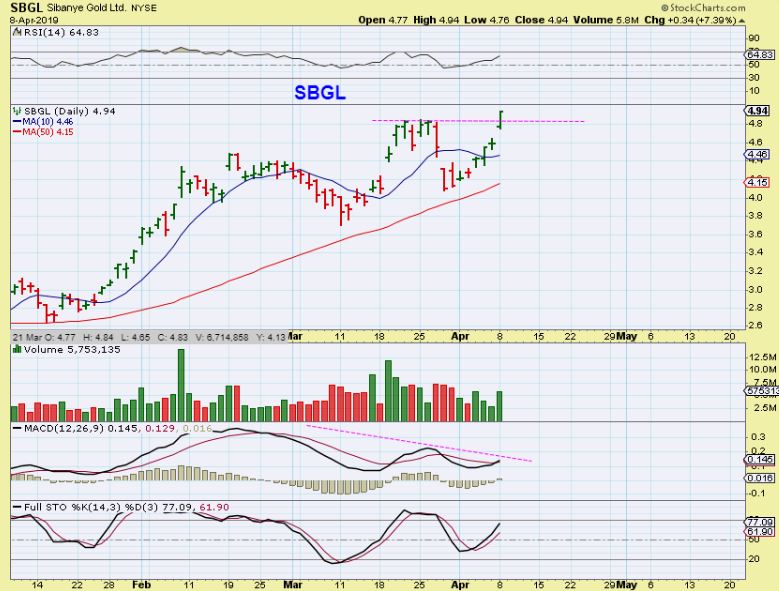
SBGL – Breaking to new highs is great, but the last time it did this in March it then dropped and filled the gap. You can see that it is strong, because it can’t quite drop to the 50sma ( If you use a 40 sma, it tagged that). There is a gap open again and divergence , so this may eventually pull back before continuing higher, so …
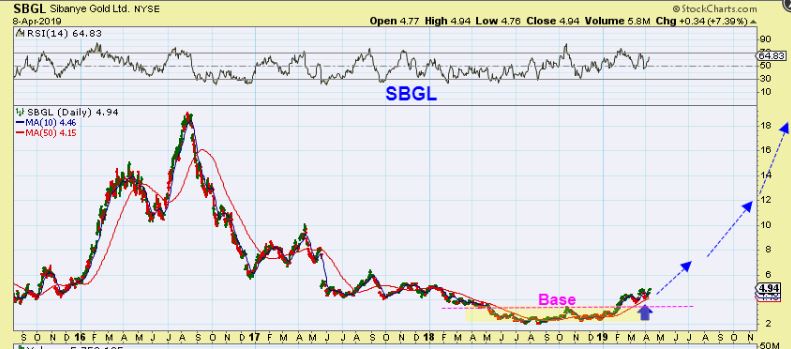
SBGL – What do you think of the Bigger Picture if SBGL pulls back? Buy the next reversal. This has broken from a base and bounced off of the 40sma area a couple of times. If you see that again on the next pull back, this is a good long term candidate.
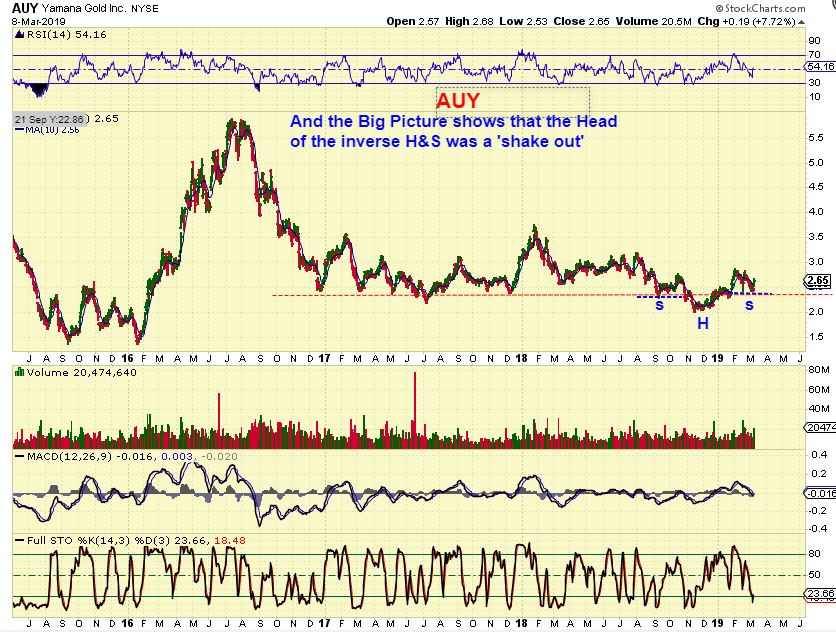
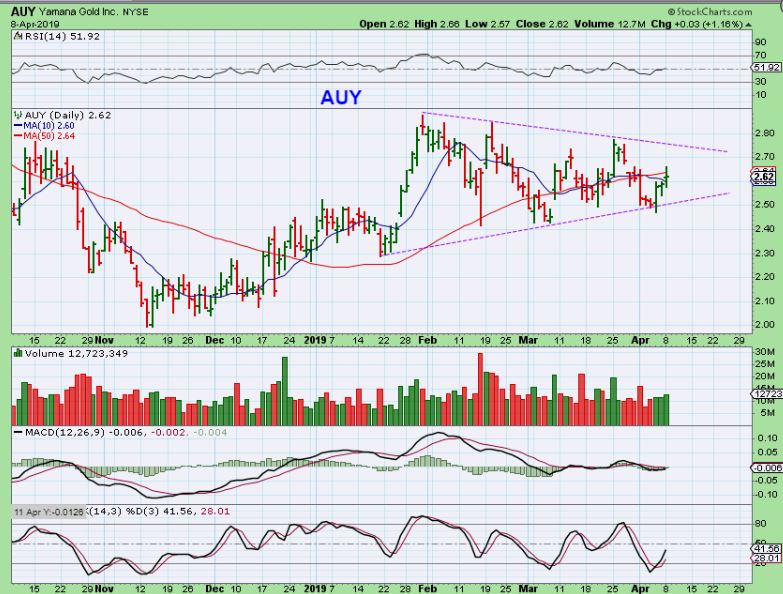
AUY – In early March I used this chart to point out AUY was a possible shake out & inverse H&S.
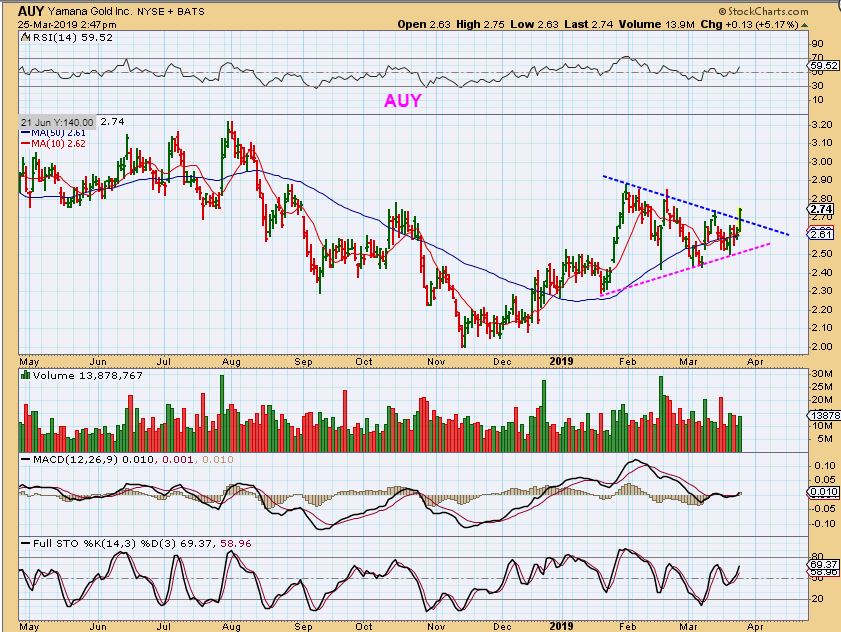
AUY – By the end of March this chart showed a triangle formed in all of that choppiness that we have seen with miners. It looked to be breaking out, I called that a buy, however…
AUY – It did not keep running away higher under the current choppy conditions. It also remained choppy, but it is still fine.
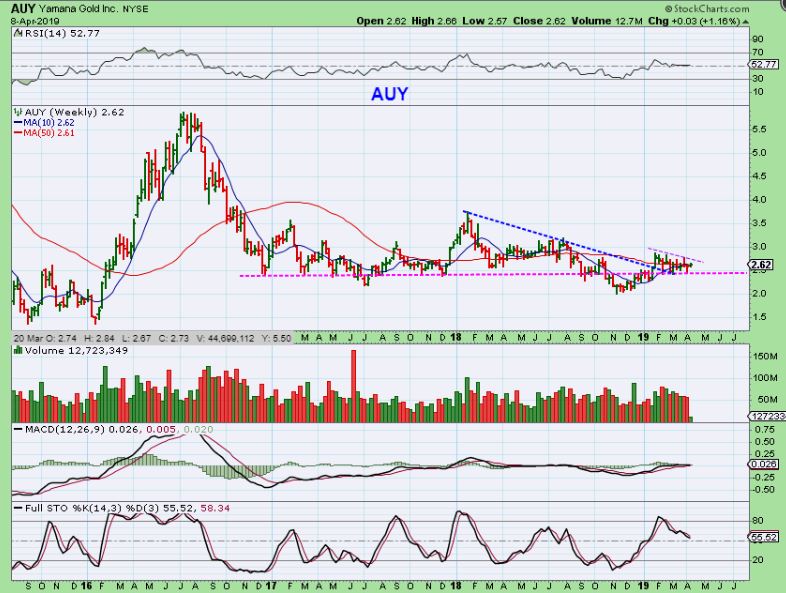
AUY BIG PICTURE – The Current Big picture is an extended period of consolidation so far. So these Miners have seen selling in GDX or GDXJ, but some are holding up well. I still own AG & LODE for example.
.
I had a discussion showing that Chinese stocks are looking good, and most of them have done excellent. I want to take this time to point out a certain pattern that has been breaking bullishly higher, and I will point out a couple that may be ready to go now.
.
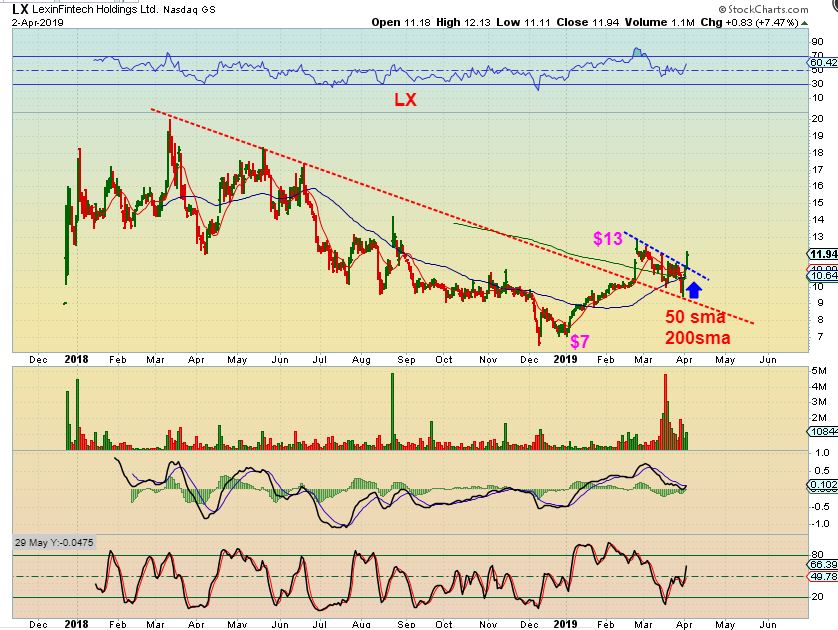
LX APRIL 3rd – After a run from $7 to $13, I pointed out the bullish set up on LX here. It actually could have been bought before the break out at the 50sma ( $10) or as it breaks out. Notice price pushing on that blue down trend line.
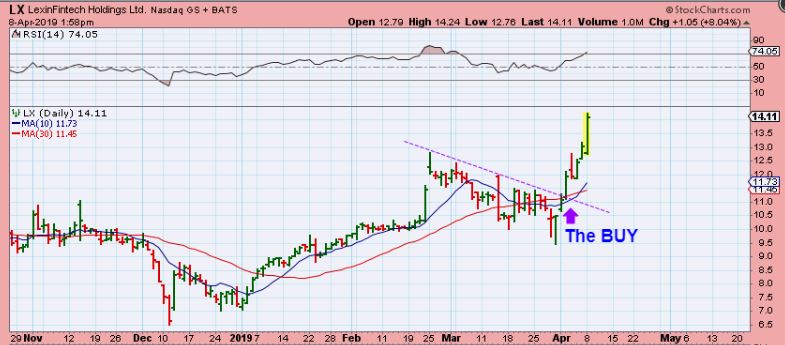
LX – It is now running away. I want you to remember that set up ( a down trend line that has price pushing on it preparing for a break out). It often results in fast gains when it breaks…
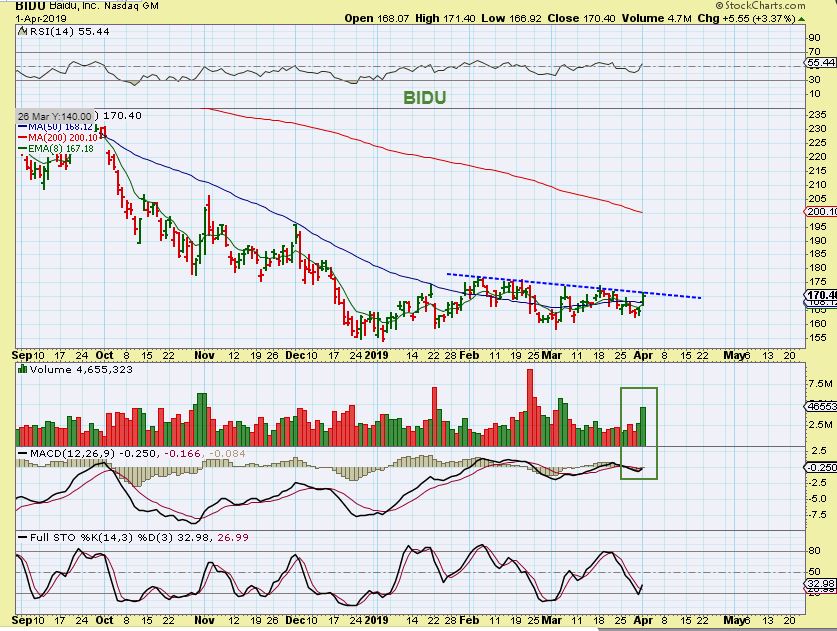
BIDU – So Bidu was recommended last week with similar set up as a base. I said that this is a buy or Buy the break out…
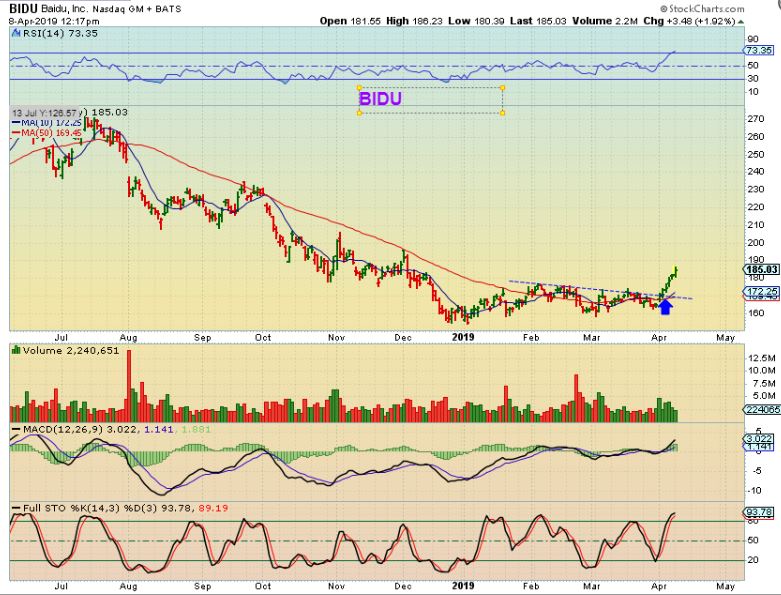
BIDU – Now it is running away each day since I posted that chart. Buy the dip if we get one.
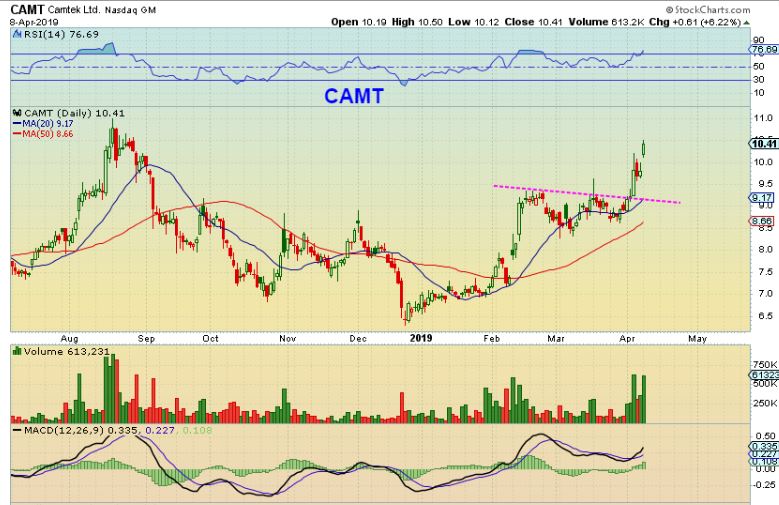
CAMT – I saw a Similar set up on CAMT and that was mentioned in the live trading area ( except that I called it as a cup & handle ). Notice how these break out and run though.
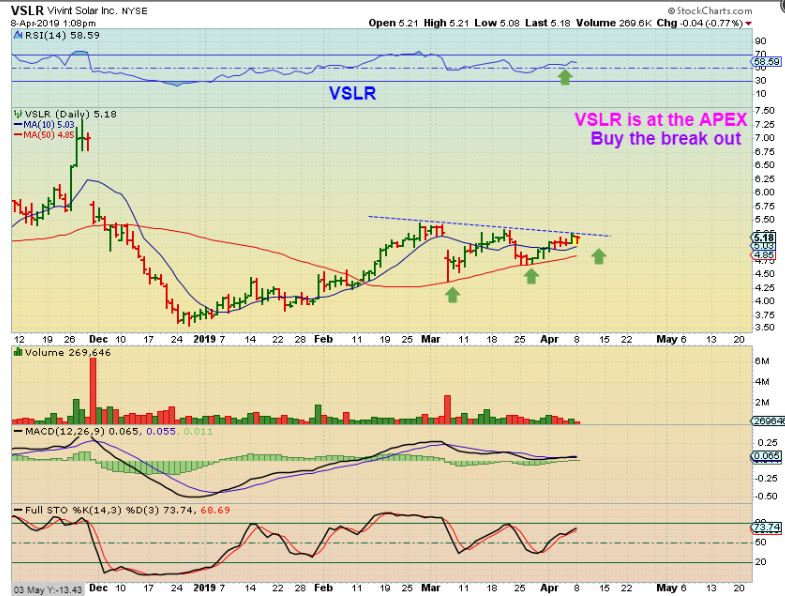
VSLR – Do you see that same set up on this solar stock? This is now a buy, and in fact I bought it at the end of yesterday. USUALLY it is bought as it breaks out, but with the 50sma under it as support, I felt pretty good about getting it early.
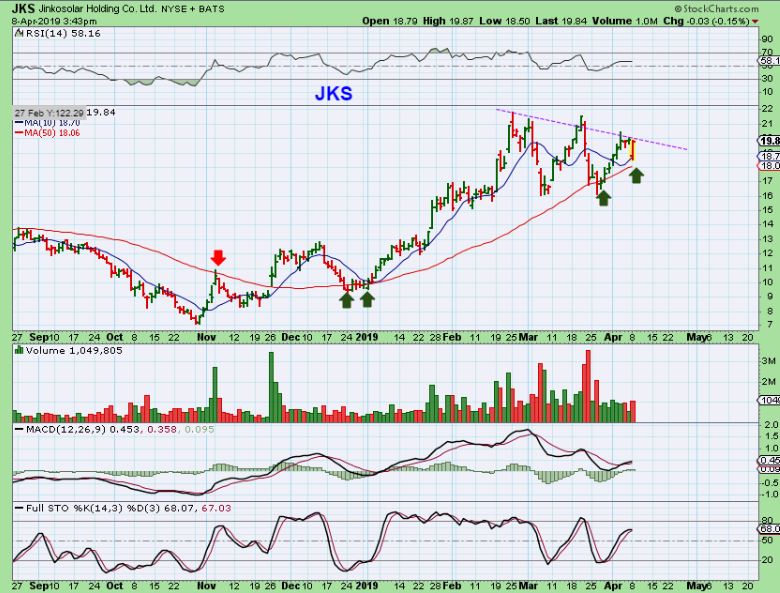
JKS – JKS is another solar stock that may be ready to go higher too. It dropped to the 50sma and reversed higher yesterday.
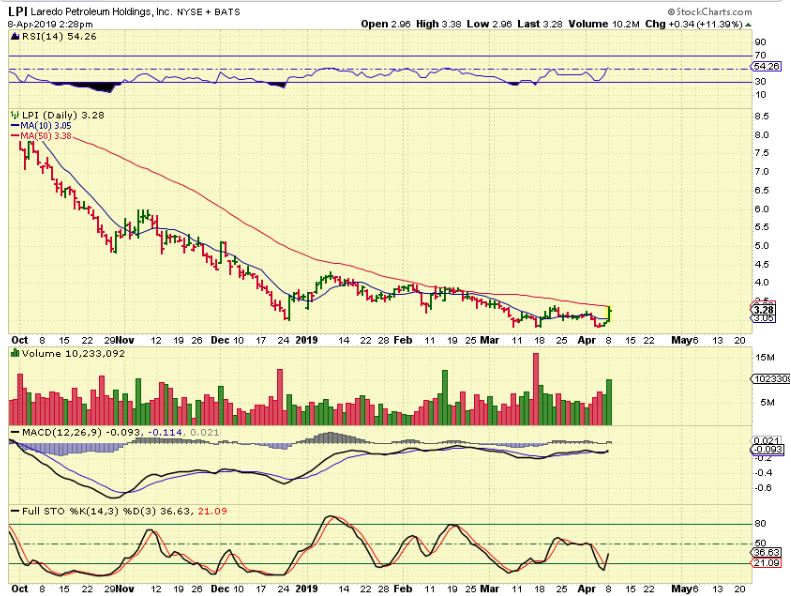
LPI – This is slightly different, but price is trying to break above that 50sma again, and it has formed a multi month base. It formed a double bottom low recently and looks ready to push higher. This is an energy stock.
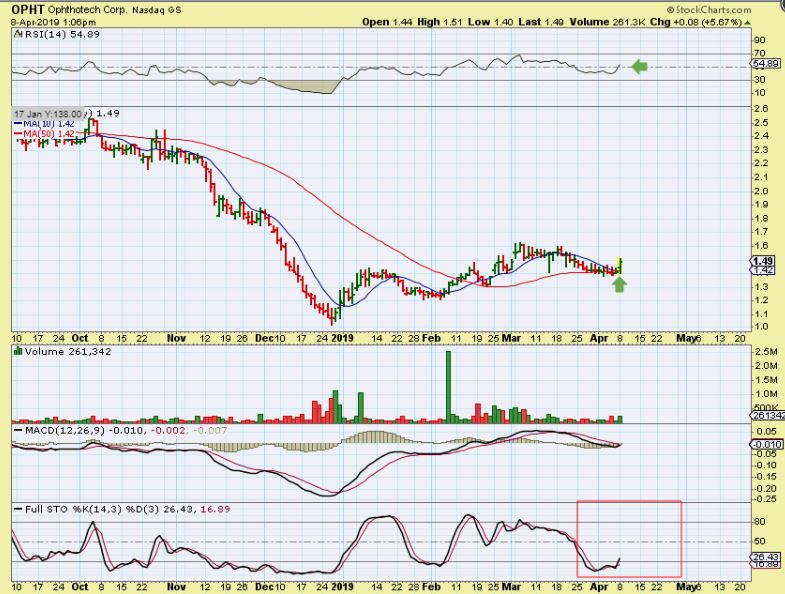
OPHT – I like this oversold set up as price reverses off of the crawl along the 50sma. You can buy it with a tight stop, and I can see this moving over $2 once it gets going. Resistance to the left is minimal up to about $2.30. NOTE: Biotech stocks have a bit of added risk if they fail a trial or FDA doesn’t approve their product, but many are breaking & running bullishly lately. We’ve traded ZIOP, TENX, TWST, GH, LJPC, MACK, LPTX, etc etc with good results. I also bought SELB last week and it pushed higher into the close yesterday ( up 11% at one point)
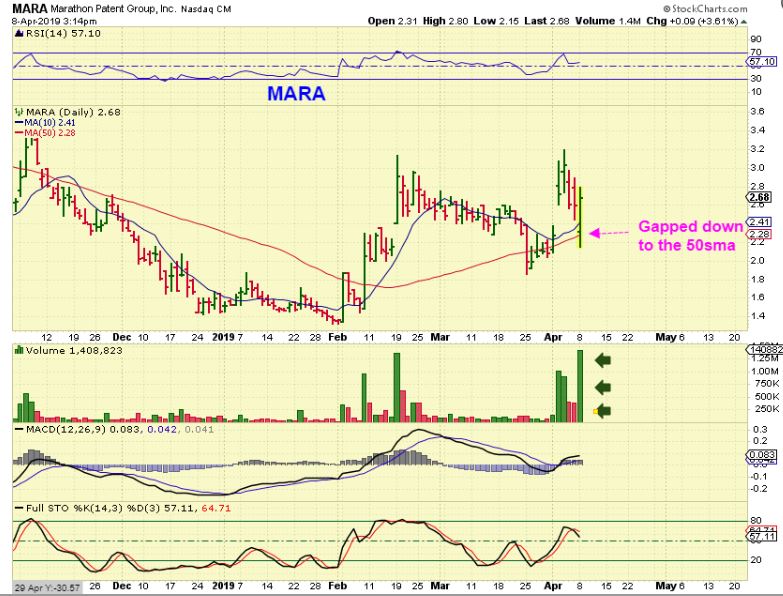
MARA – I have been trading blockchains stocks as Bitcoin rises from the base. Yesterday I saw MARA drop below the 50sma and I thought that it looked ugly by midday. As the day moved on, it reversed above the 50sma and put in a very high volume reversal, so I posted this in the comments. It actually closed up 10% with big volume. You can buy it here, since it runs like a gazelle, but it obviously has very large swings ( I own it) .
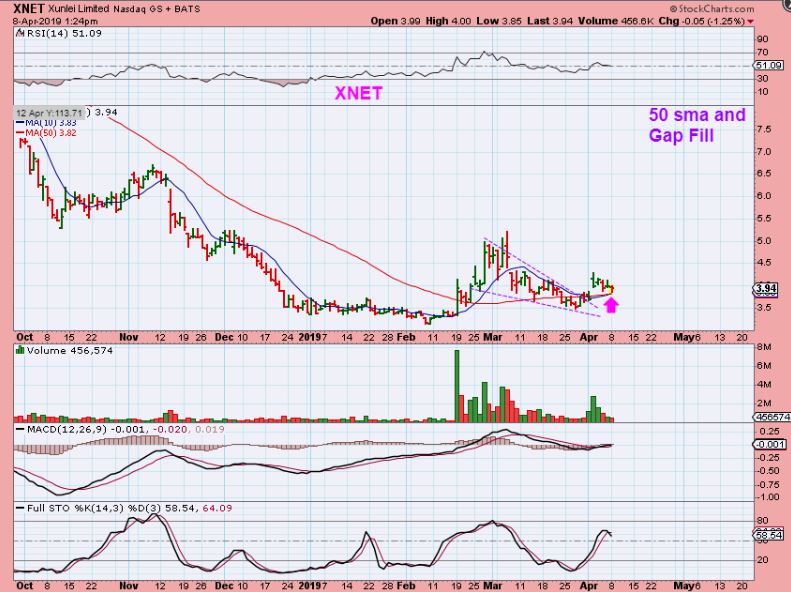
XNET – I own XNET, but it didn’t break higher like many other blockchain stocks. It actually dropped yesterday to the 50sma and finished filling a gap. I added JUST IN CASE it wants to break & run higher with the others this week.
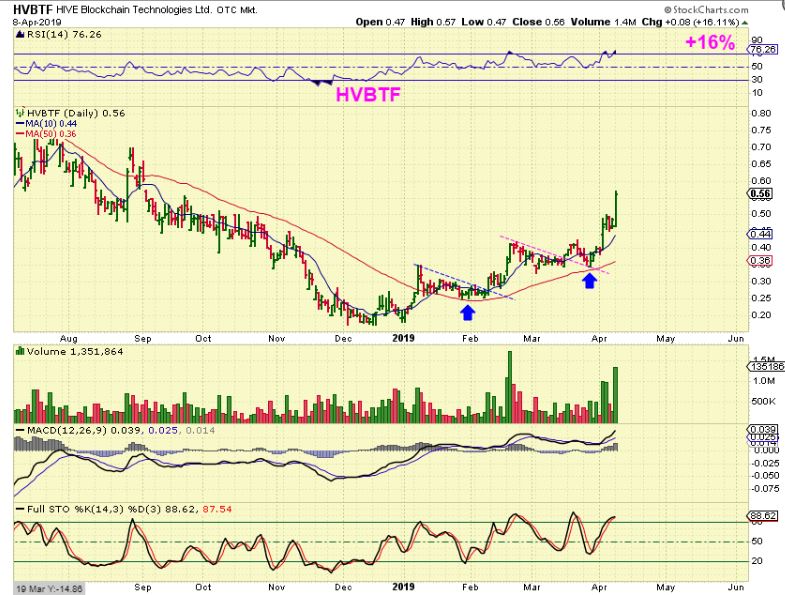
HVBTF – HVBTF was up another 16% Monday after breaking from this bull flag. I have been pushing this one as a buy lately and in the past. I have owned it for a while since it continues to act bullishly. This one can be hard to ride, since it goes sideways for weeks, but if Bitcoin gets running, This can also start a steeper incline ( Like EDXC has for example).
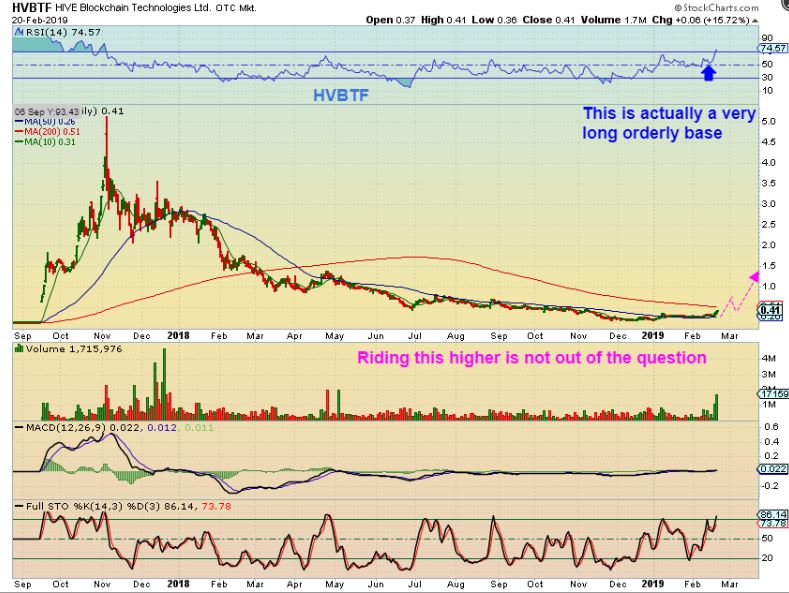
HVBTF BIG PICTURE FEB 20 – This is the long base that I really like about HVBTF. As of right now, it has even pushed above the long red 200 sma in this picture.
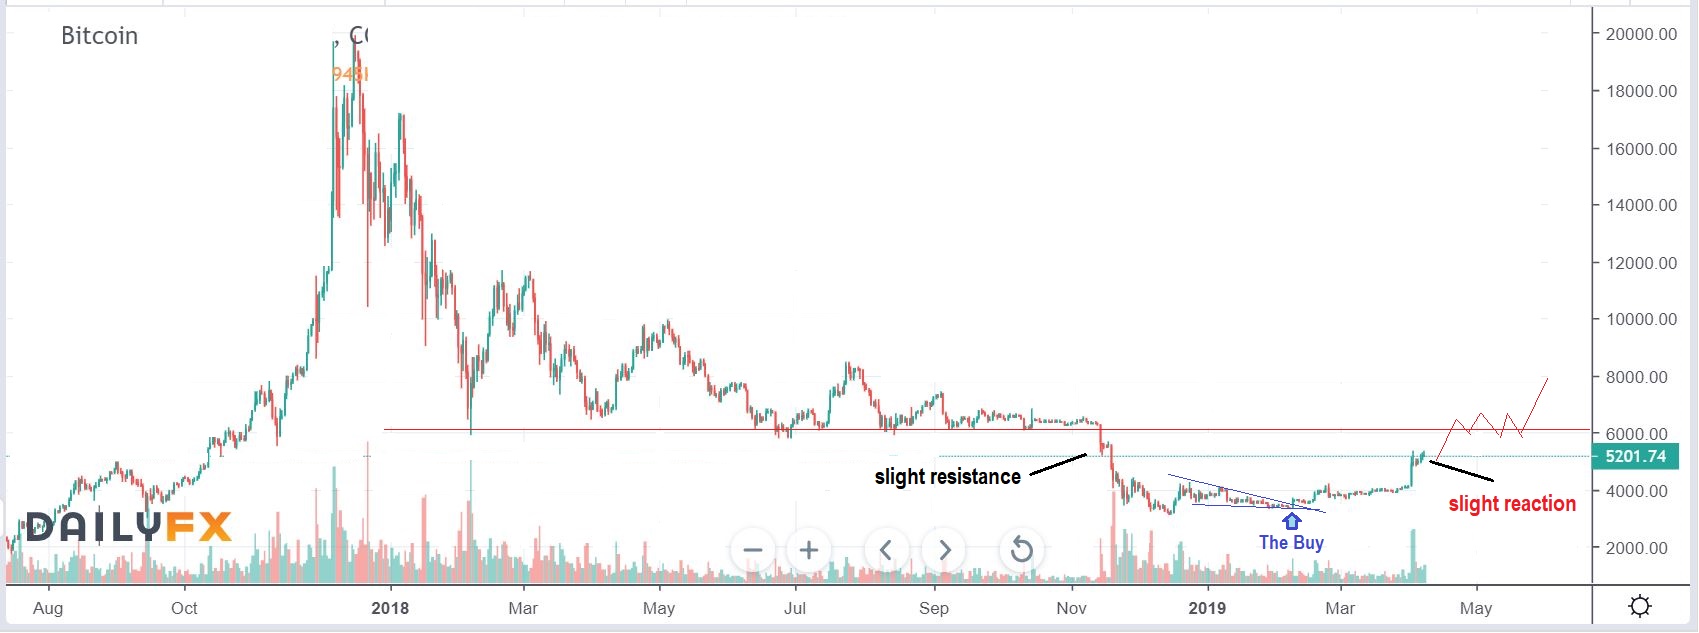
BITCOIN – I keep saying that I expect $6000 and even more eventually, and I was asked how I came up with that when Price was $3000. This is how I am viewing Bitcoin, it may be forming a bull flag like the one we just saw in HVBTF. So far it is acting correctly.