
Tuesday April 16th – Observations
The General Markets should have a little more upside, and if you are willing to ride the dips and just hold current positions, you can use a reasonable stop. If you hate losing any of your gains, it might be wise to tighten stops and keep an eye on open positions. The markets have been running strong and pull backs have been fairly shallow, but it is looking like we could be due for another pull back soon. Let’s review what we have…
.
SPX – The bearish rising wedge has been moving closer to the Apex. This is at least shorter term bearish. It doesn’t call for a crash, but it does signal a possible pull back may be coming soon, and…
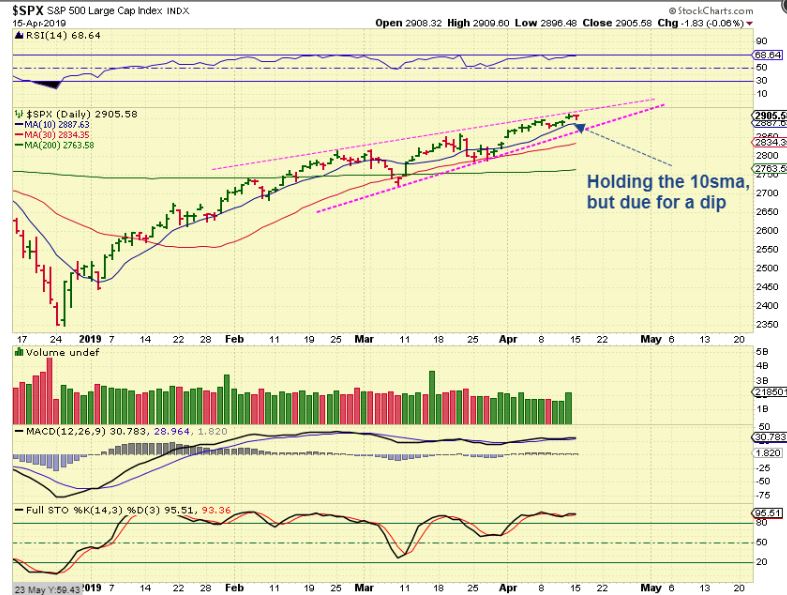
NASDAQ – And it is day 26, so this is getting late in cycle count. A normal dip to the dcl is not bad, but we don’t want the markets to start pulling back, gain momentum in the selling, and catch us off guard. If you are comfortable just riding out the dips, then a stop at the 200sma may be fine.

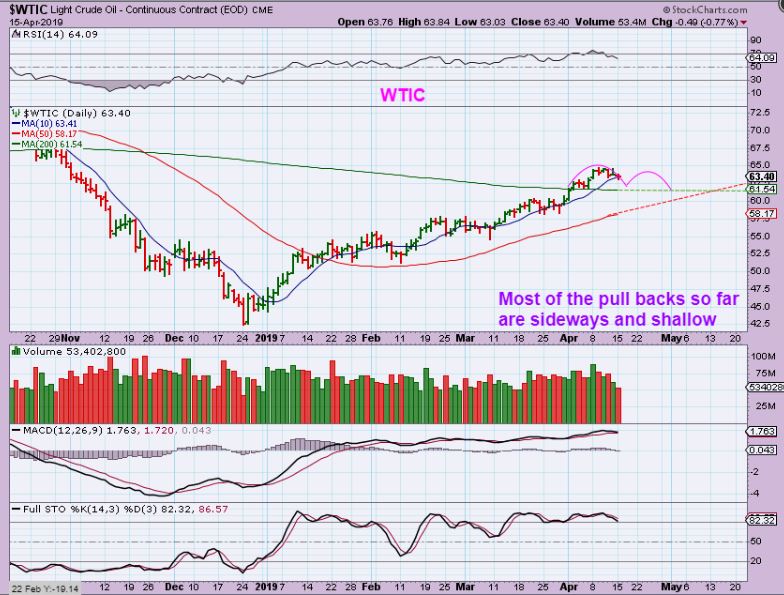
WTIC WEEKLY – The weekend report showed a possible weekly topping candle, so a pull back could start at any time.

WTIC – Oil dropped a little Monday. It is also on a steady climb where the pull backs have been rather shallow so far. This could just move sideways and tag one of the major moving averages, but I would have a stop there if I were Long Oil.
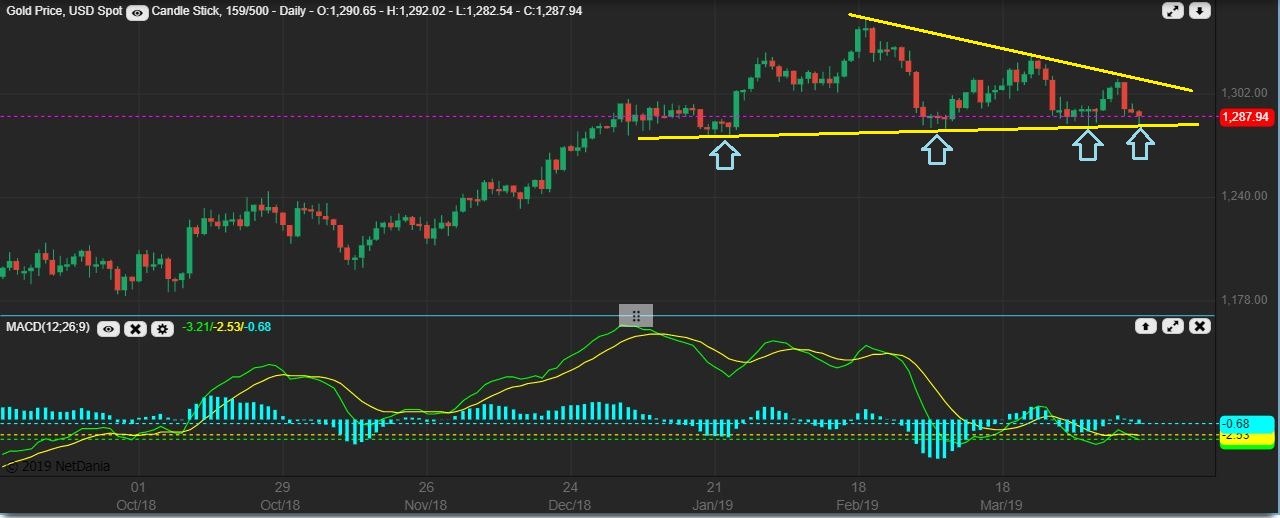
GOLD – Gold dropped at the Open, and reversed higher. It reversed right off of the lower trend line. See my weekend report and even Fridays comments if you need a reminder about this sector.
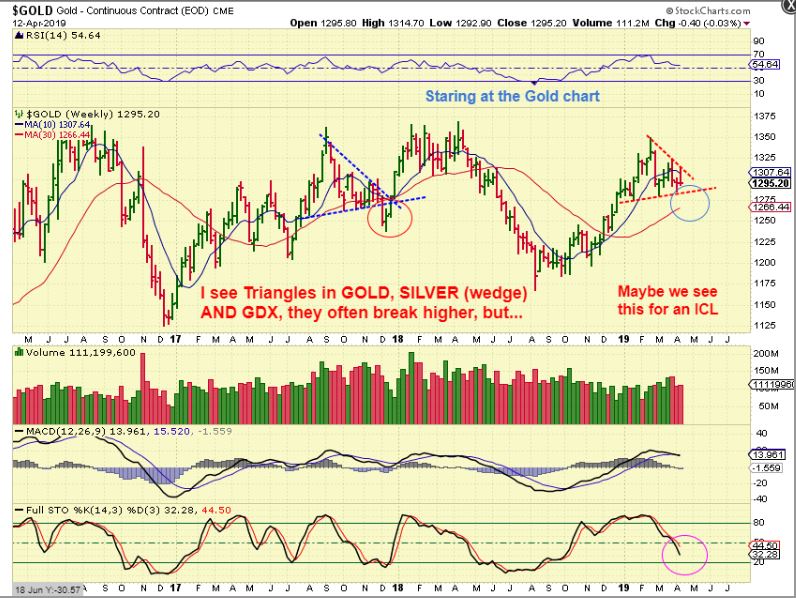
GOLD – I accidentally left this out of the weekend report, but it is an important reminder. I pointed out the idea a while ago that a triangle type formation similar to the one in 2017 might draw in the Bulls, and then suddenly collapse into an ICL. This Stops out the Bulls, and then may run away leaving Bulls behind. Because the stochastics on this weekly chart is not oversold, THIS IS A POSSIBILITY. See the chart similarities.
SILVER – Silver dropped at the open and look where it reversed. The descending Wedge remains in tact.

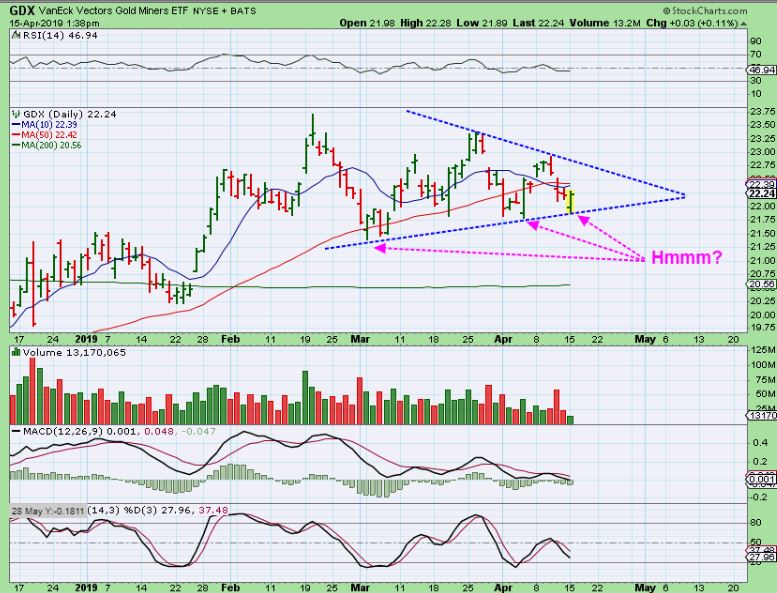
GDX – GDX dropped at the open, so where do you think it reversed? I was away from my screen all morning, and this was one of the first charts that I checked when I logged in. I captured this midday.
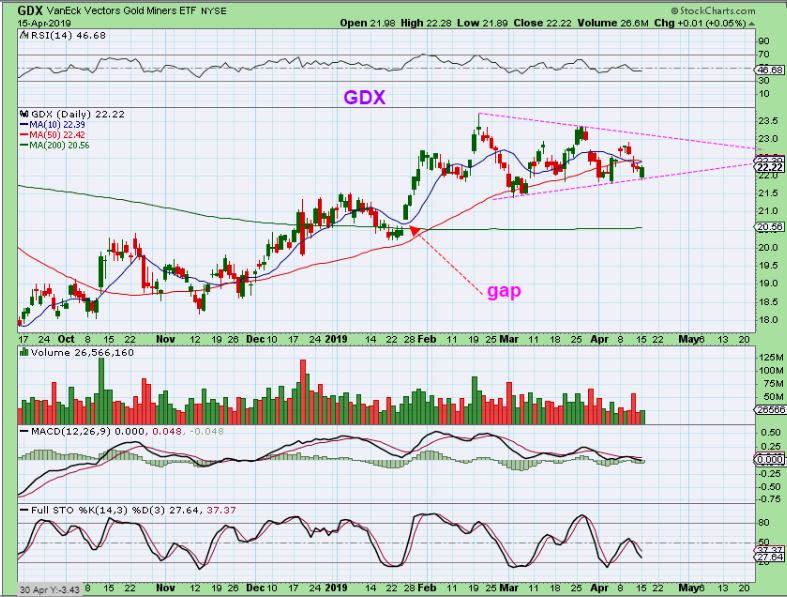
GDX – This chart just reminds us of the gap at the 200sma, in case it breaks down.
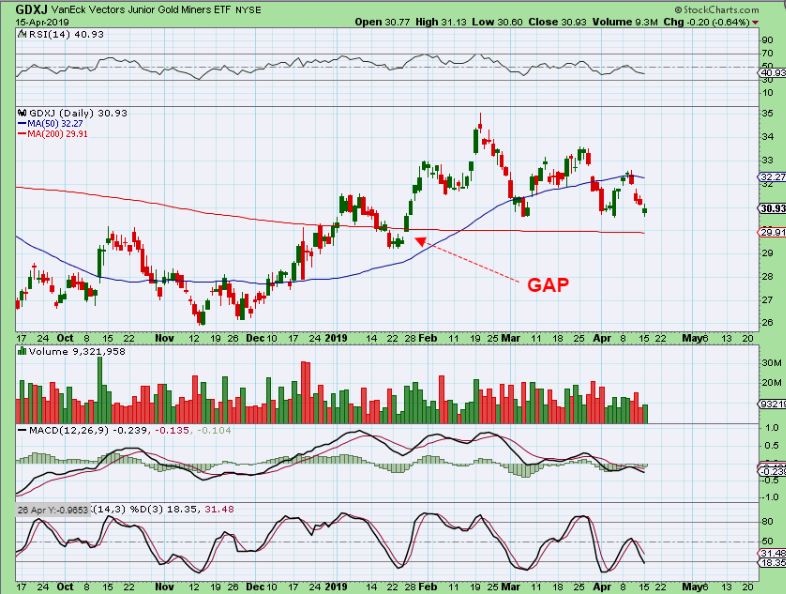
GDXJ – GDXJ was in the weekend report as the weaker looking chart . GDX closed green, GDXJ was down 20 cents ( I dont know why the candle showed up as green, it should be red). GDXJ has a gap UNDER the 200 sma.
.
I don’t think I am going to post a ton of ‘stock picks’ below in this report. Things may start to get choppy shortly.
1. At this point, the General Markets may be nearing the time that they start a Pull back. Choppiness is common.
2. Oil had a weekly topping candle, so it could be starting to dip or chop sideways.
3. The Precious Metals are in triangles and that is often choppy trading, so with this set up in the various sectors, I am not going to offer a boat load of “Buy Set Ups’.
At a DCL or after a good dip, it is a good time to start adding low risk buy set ups, but here as the daily cycles mature, a normal pull back could ruin even a good set up. It may be wise to ride the current positions that you may have taken during the last few weeks, and just watch how these sectors trade this week. If we get a dip into a dcl ( or ICL for Miners), we will then have some nice low risk set ups that are a bit more reliable. I will mention just a few ideas below though, for active traders.
Enjoy your Tuesday trading!
.
~ALEX
.
TGB – I did buy TGB, simply because I like the volume and saw it breaking from a nice tight consolidation. The one year chart looks promising.

Some of the Commodities did still look good, but many steel stocks did not. Below is what I wrote in the trading area yesterday, you can look at the charts if you have spare time.
” TGB is looking pretty healthy with that volume, CENX & FCX still holding up well.
PLG selling off fairly hard thee last few days, landing on the 200sma now. Maybe a shake out coming?
CLF holding up, did a reversal on the 200 sma, but AKS & X breaking down last week”
.
YRIV – I will also mention that I own this, but it Moves FAST, it is risky, and I find it hard to recommend under the current markets conditions ( possible pull back due). Why do I find this hard to recommend? You can see from this chart that a quick drop could take this from $1.50 to $1 in a heart beat. Price also could jump and take it to $2 Quickly. THIS IS DEFINITELY NOT FOR EVERYONE.

.
Let me show you something that really caught my eye
.
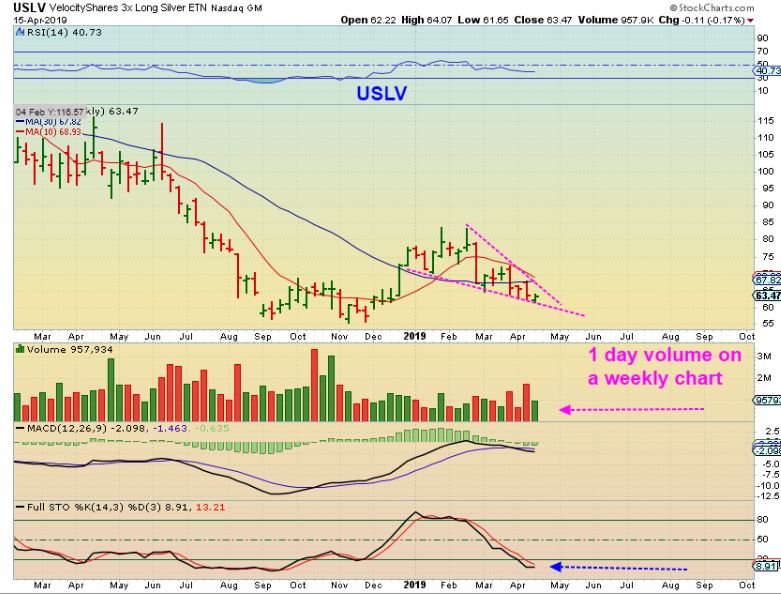
USLV 3x ETN for Silver – I just thought that the Midday volume in USLV was interesting, as it reversed off of its lower trend line. It had 1/2 million here, and then ended the day with almost 1 million in volume. Now look at this…

USLV WEEKLY – A reversal in a bullish wedge, and volume is very big for 1 day of a weekly chart. 1 million Volume each day this week could become 5 million by the end of the week. The highest volume on this chart is roughly 3 million. KEEP YOUR EYES ON SILVER, Silver looks Bullish in many ways.
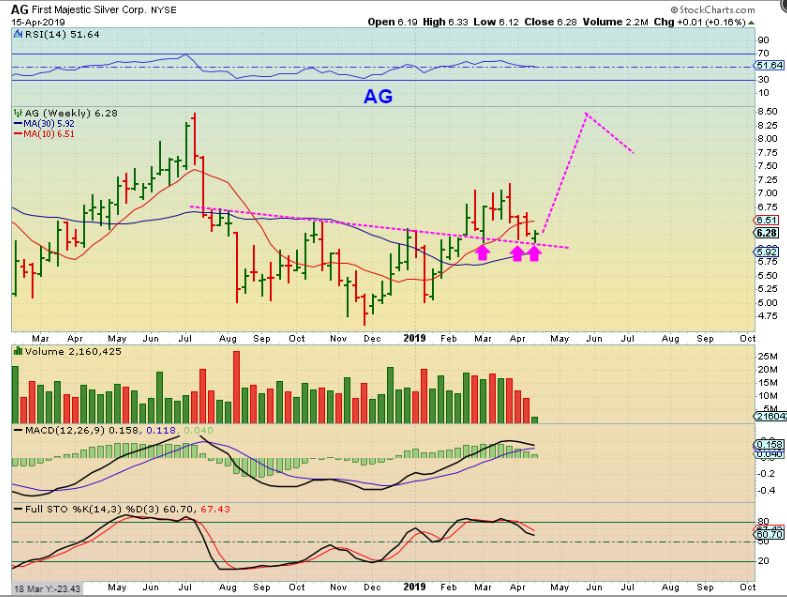
AG WEEKLY – I’m sure that you remember AG on this support area. It held again , so far. Many Silver stocks looked pretty good Mondy , after selling down and reversing into the end of the day.
.
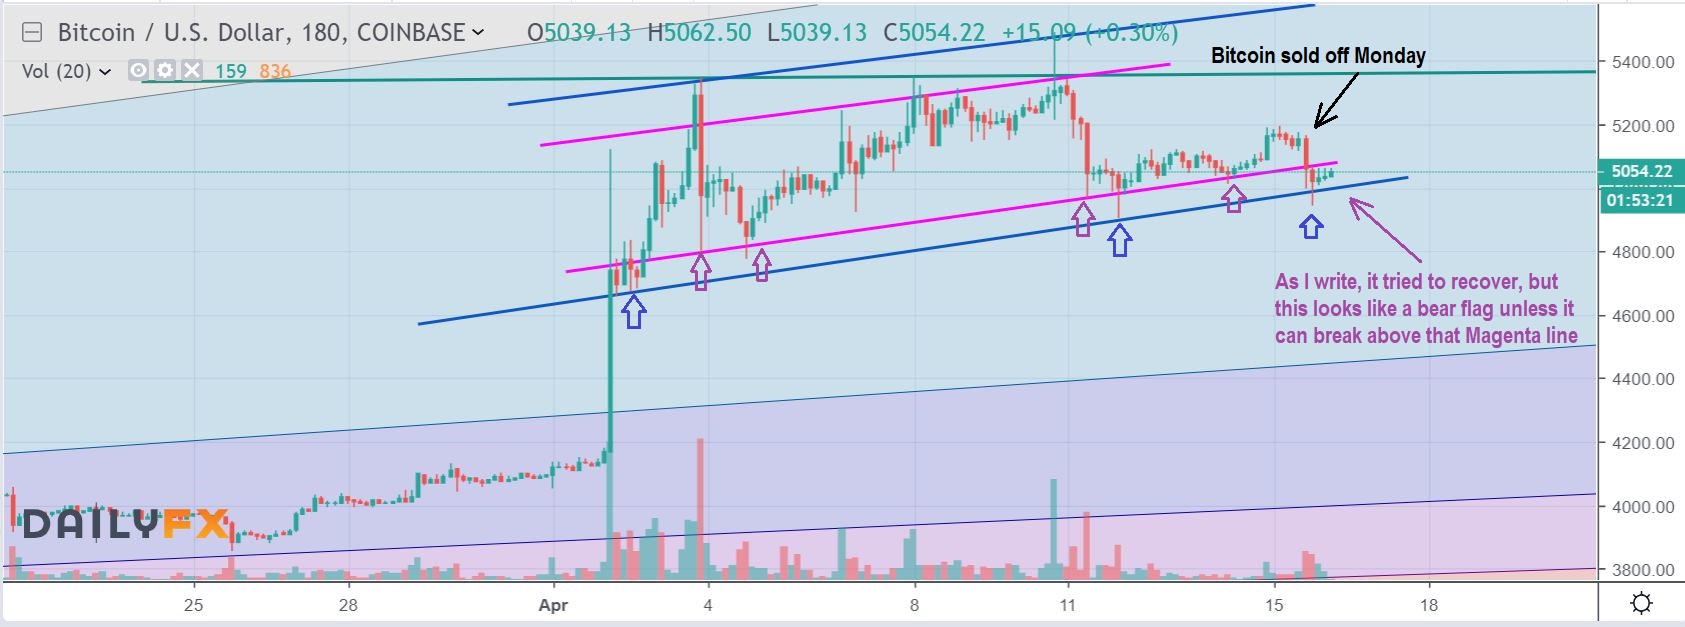
BITCOIN may have done a shake down type move, and Blockchain reacted , as they do.
,
BITCOIN MONDAY NIGHT – After selling off Monday, it tried to recover, but is only forming a bear flag as I write. If this breaks down, Blockchain stocks can drop further. Let me give you examples…
HVBTF DAILY – I own HVBTF, and I am looking at it this way. It broke higher from a channel, and then rested on top of it. Is that it or not? We’ll see, but if it breaks down, it may do this drop to the 50sma / 200 sma . This has been a bit of a choppy ride day after day, but it is climbing bullishly and …

HVBTF WEEKLY – The weekly chart has been a much steadier looking bull move. You can see on the weekly chart that this can drop further too, but it remains bullish in the bigger picture.

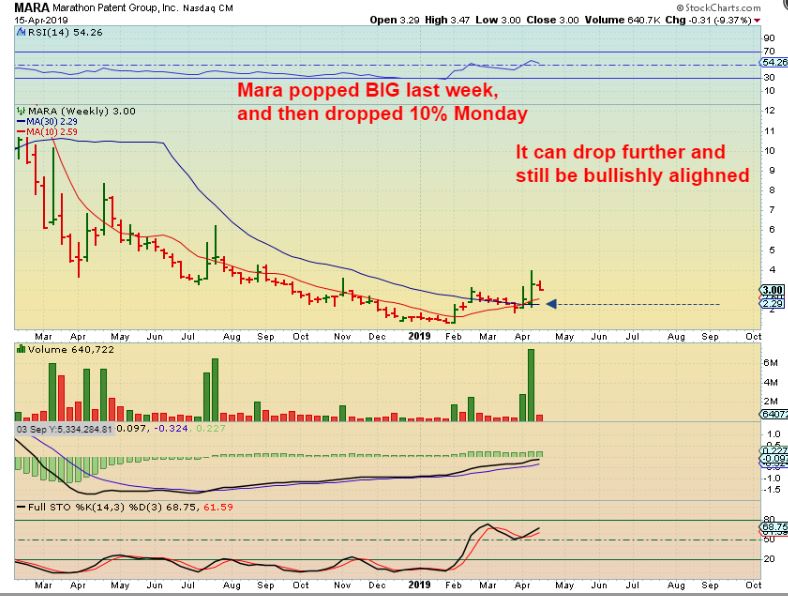
MARA WEEKLY – This is why these Blockchain stocks may not be for everyone. This dropped 9.37%, and could drop a lot more. It popped 50% one day, so a pull back is normal. I bought this much lower and may ride it down, but the long term chart looks fine, and it probably depends on whether or now Bitcoin holds up.
XNET – This one broke below the 50sma Thursday, and should have stopped anyone out Friday or maybe Monday. Can it double bottom? Yes. Can it just shake out? Yes, but I have been away from my computer in the mornongs, and I knew that I’d be away Monday, Tuesday, and Friday morning this week, so I had to just sell when it closed below that 50sma.

RIOT – For some reason, RIOT does not sell off to the 50sma, and has not filled the gaps that it leaves behind. It has held up well ( I do not own this) .

NOTE: Tuesday & Friday morning I will be away from my computer during trading hours, Wednesday & Thursday are undecided.


