
Friday April 12th
When I look at the general Markets, I really do see a difference between the various sectors. We have already discussed the TRAN & RUT as breaking down and recovering recently, while the SPX & SOX ran straight up. The DOW looks different from all the others too. I will briefly cover 2 areas and again you’ll see that they vary. so far we see is a solid run out of the ICL, with a mild dip into a dcl for some sectors, and a deeper dip for RUT & TRAN. Just continue to use stops at support levels when a pull back comes due.
.
QQQ – For example, I see a rising wedge here, and they are usually bearish. Is it concerning right now? Instead of selling, I would use the lower trend line as a stop, here’s why…
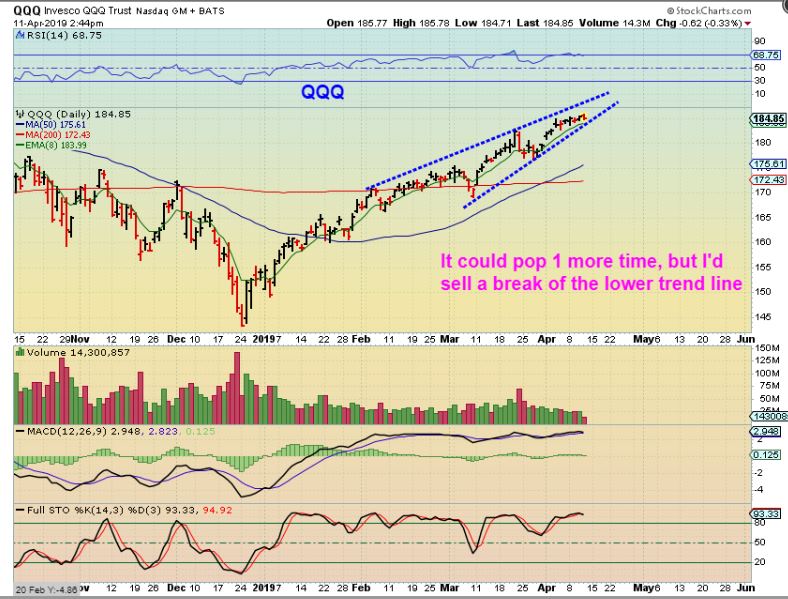
QQQ CYCLE COUNT – There could be a little more time left on the upside as shown. Remember that the TRAN & RUT are not overextended. Also…
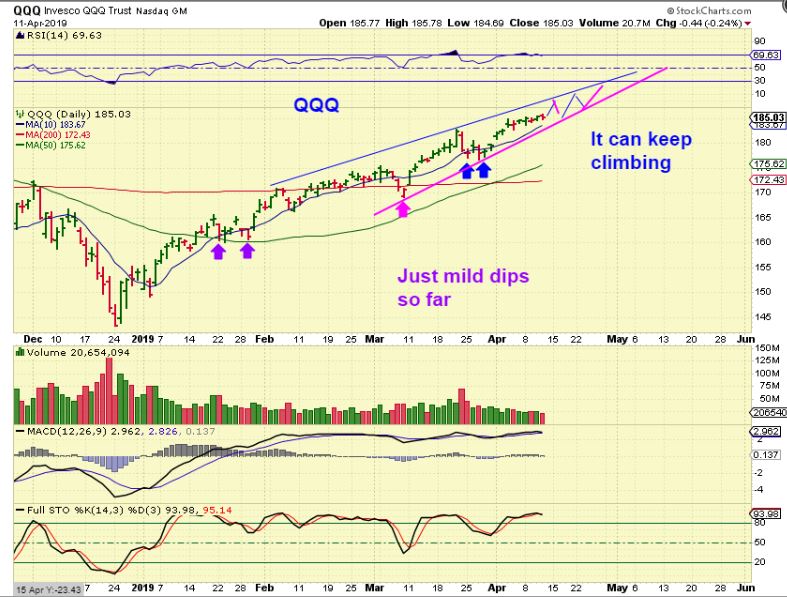
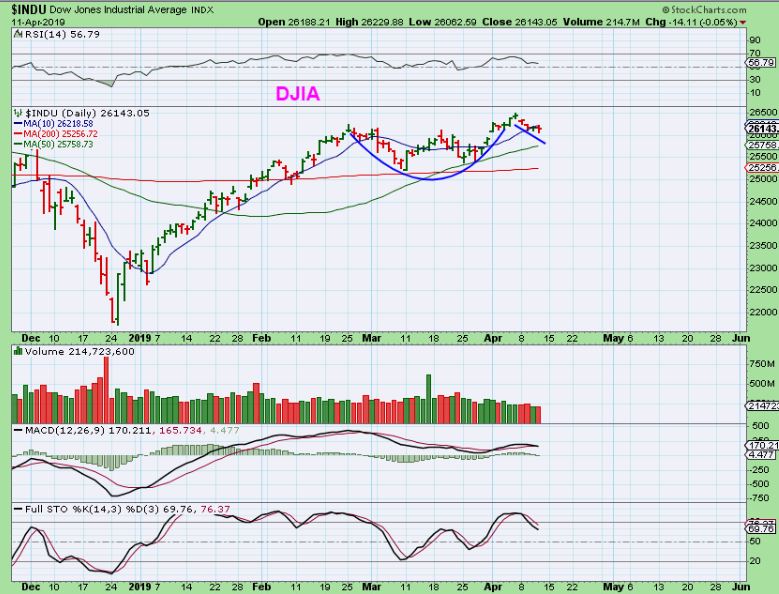
DJIA – Boeing held the DOW down for a bit, and now it actually looks like a bullish cup & handle with a ‘W’ bottom. If the DOW, RUT, and TRANSPORTS move higher, then it’s possible that the NASDAQ can push a bit higher too, chopping around in that wedge too. Just use a stop at the lower trend line.
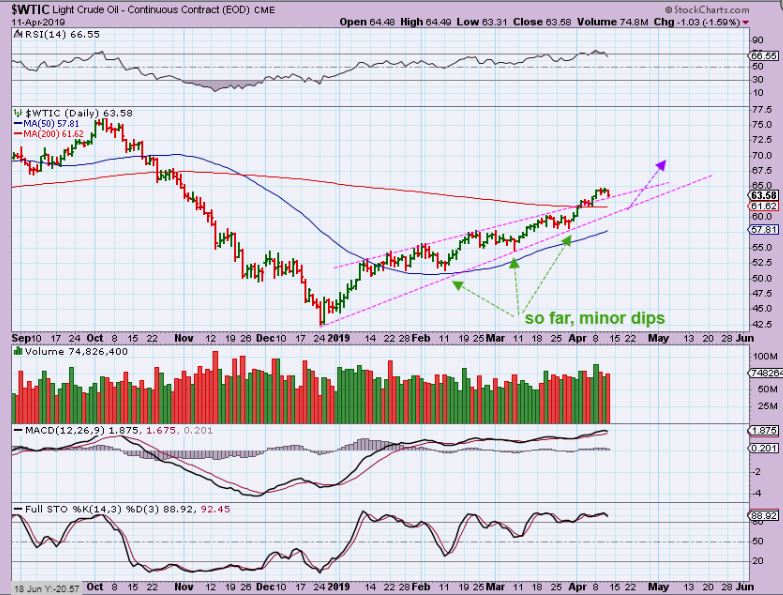
WTIC – Oil has bullishly moved above the 200 sma and pull backs ( even the dcl) have been rather mild so far.
.
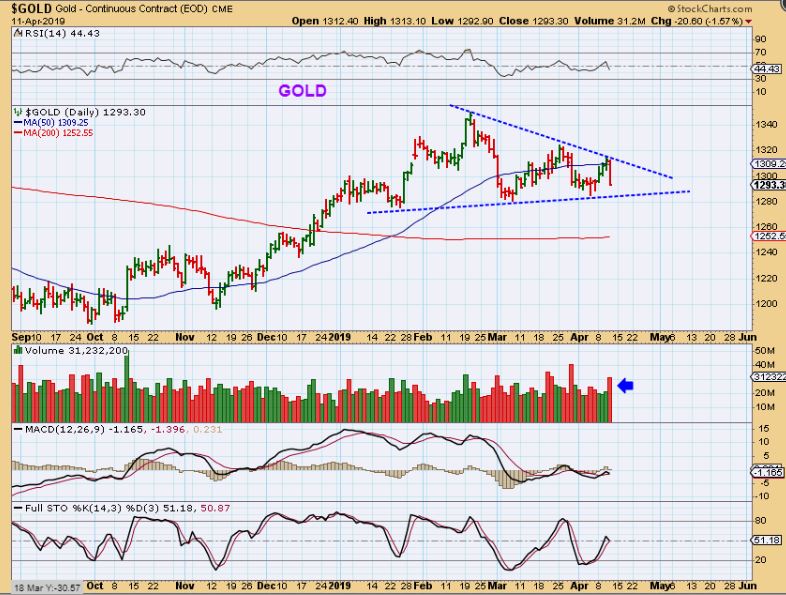
WATCH THE TRIANGLES FOR CLUES
.
GOLD – Gold did drop after hitting the upper trend line & 50sma. Volume increased on the drop. I have been expecting a deeper drop (ICL), but so far it has just been choppy & sideways. This MIGHT be the drop into the ICL that I have been expecting, but watch the lower trend line Friday.
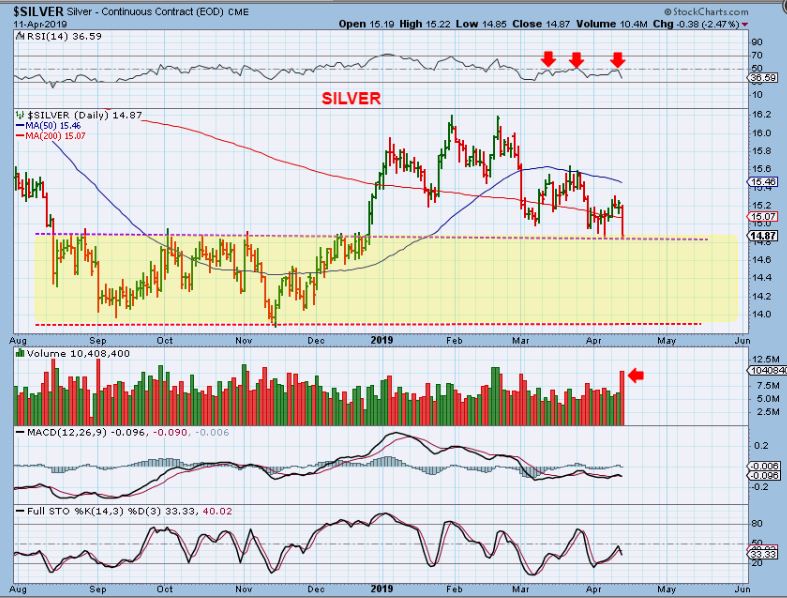
SILVER – Silver is right at support, and volume increased on the selling. We’ll see what Friday gives us, further support or break down?
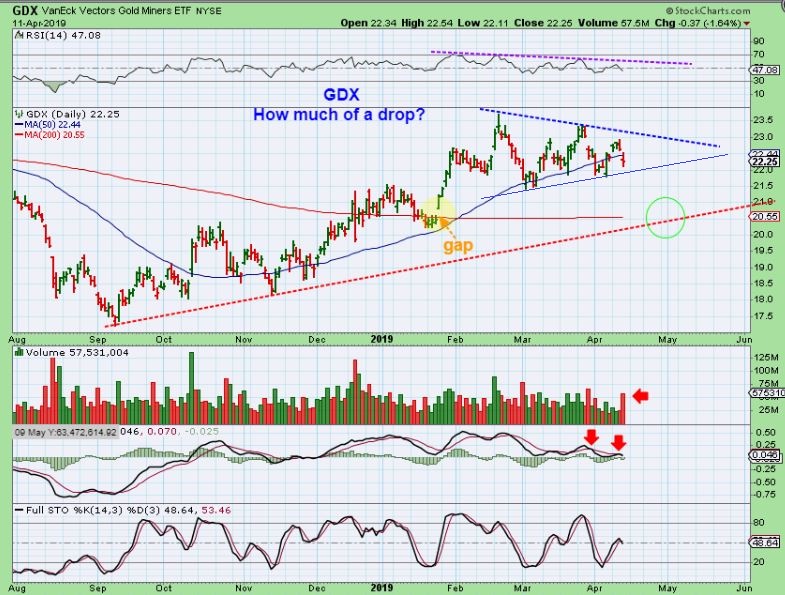
GDX – GDX lost the 50sma again and volume also increased here in this sell down. Is this triangle going to hold up, or do we drop to the 200sma & fill that gap? If you are holding Miners, buying DUST or JDST as a hedge may ease the pain of a drop, just in case it drops to the 200sma.
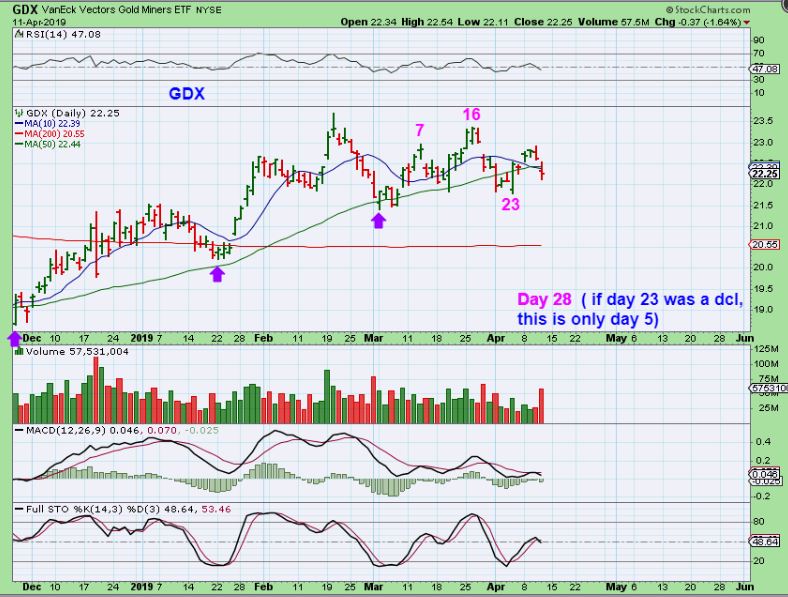
GDX – Cycle count would have us on day 28 most likely. Daily cycles are often 30+ days long. See the chart.
.
As the Precious Metals appear to be rolling over, I found it a little odd that the stronger Miners that I have been watching did not continue selling down on Thursday. They didn’t accelerate as I would have expected. I look forward to seeing what they do Friday & next week. Let me show you what I mean…
.
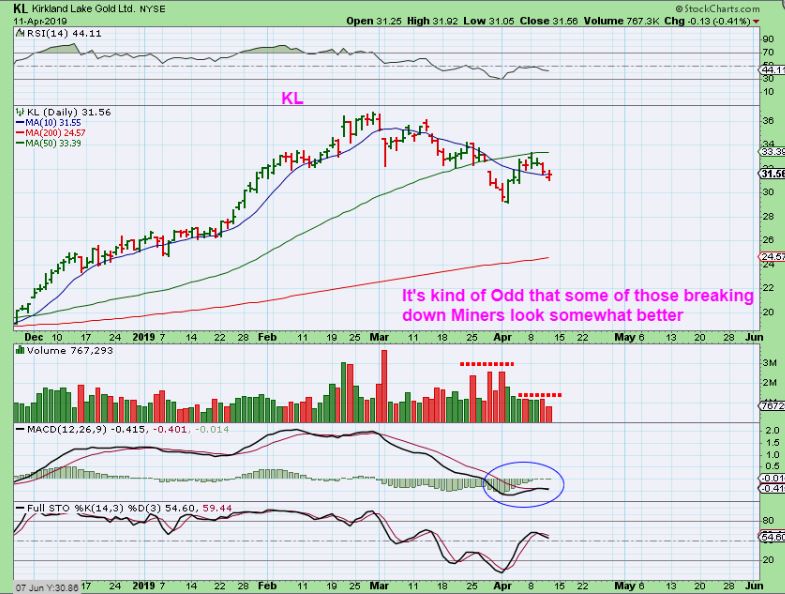
KL – KL broke the 50sma in March, back tested it Monday and reversed lower. Thursday when Gold , Silver, and GDX finally rolled over with heavier volume, KL dipped under the 10sma and then recovered. Volume got really light and the MACD has divergence. Hmmm.
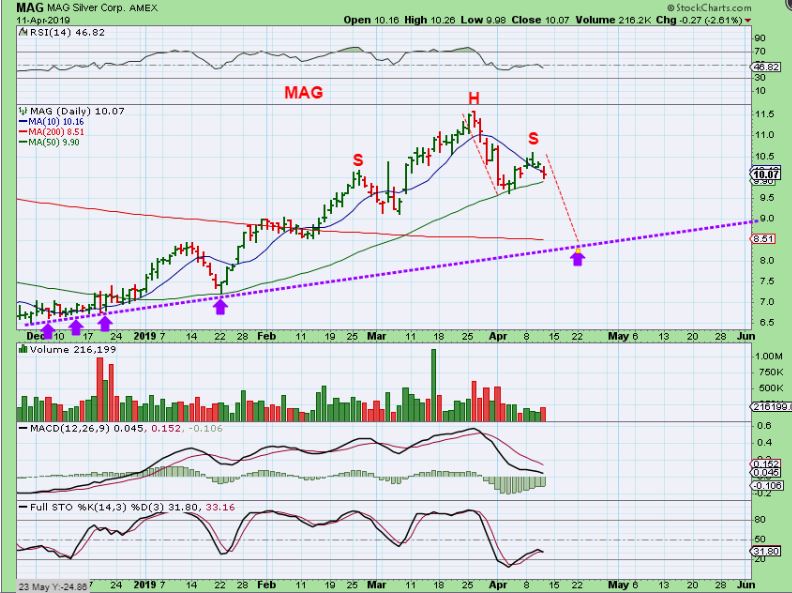
MAG – Silver dropped on heavy volume to that support area and threatens to break down, yet MAG bounced off of the 50sma on lighter volume? That was half the volume that it sold off with last time it tagged the 50sma. That is often more bullish than bearish, so these sort of things need watching. MACD here remains ugly though, and this could be a H&S.
.
So we appear to be starting the drop into the next dcl / Icl for precious metals, but as I have pointed out, there are a few things that stand out to me as odd. Will the selling accelerate or are these Miners indicating that the Triangles will hold up? I will be watching a few different things as this selling continues, but this is 1 reason that I have not gone heavily short.
.
Enjoy your Friday trading!
.
~ALEX
.
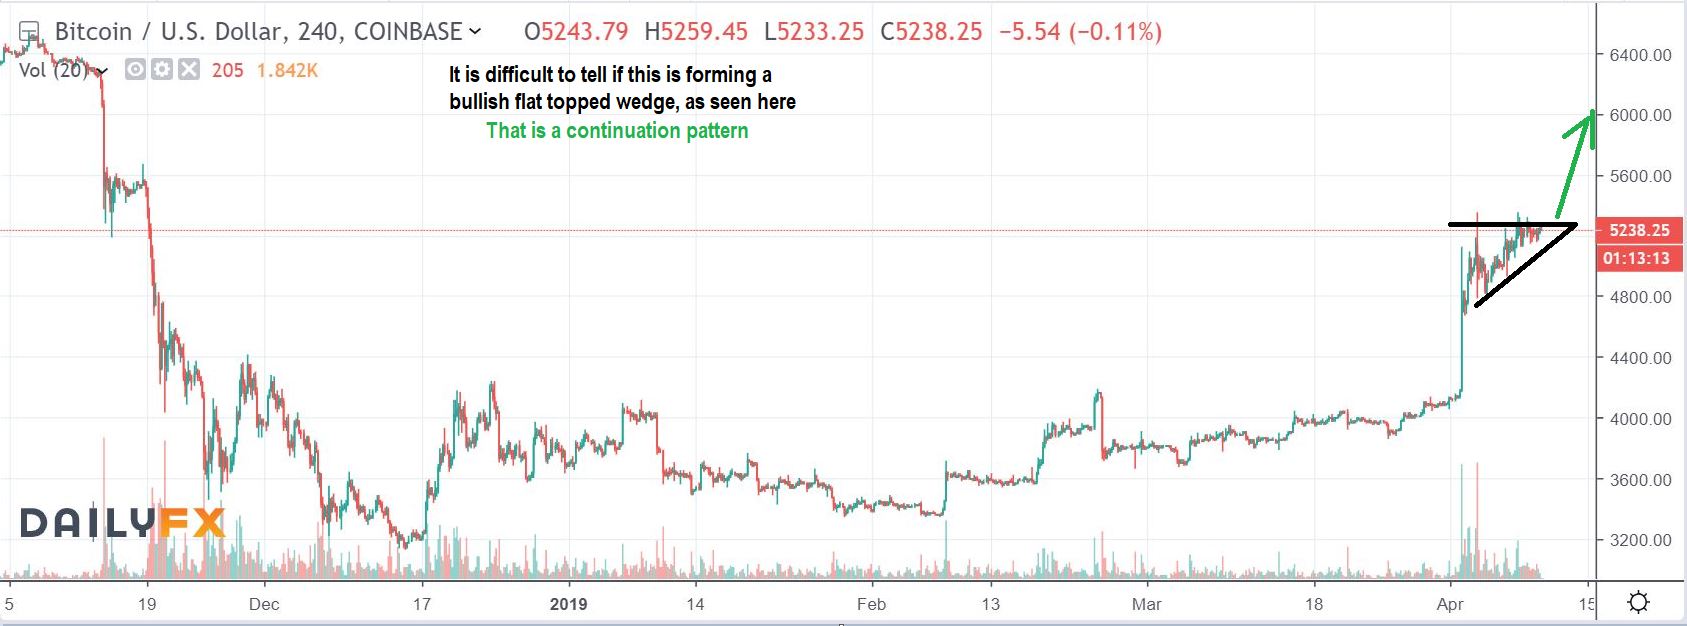
BITCOIN From 2 Days Ago – I was hoping that we were seeing a Bull Flag or flat topped wedge in Bitcoin. The Blockchain stocks do seem to really react to the direction that Bitcoin moves in. We had a very nice pop as this broke higher later in the day…
.
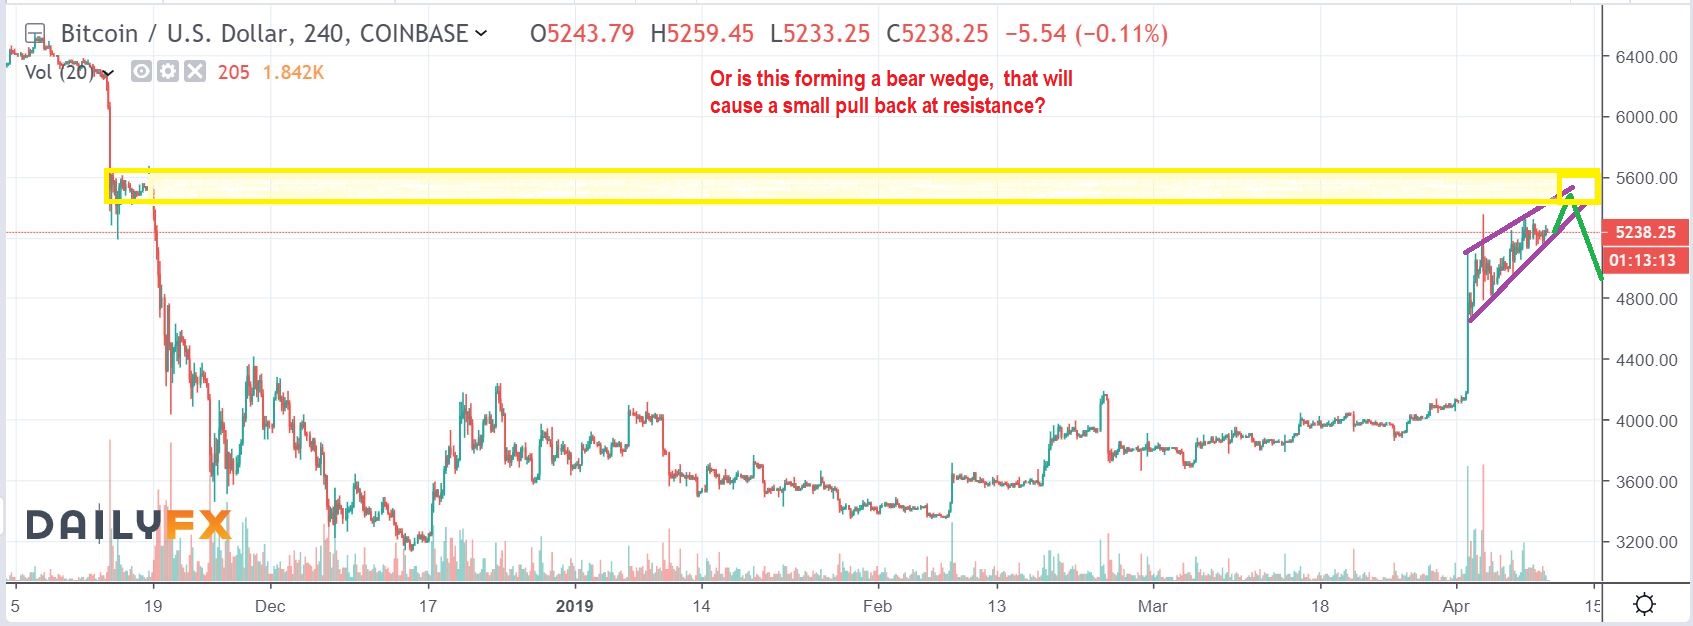
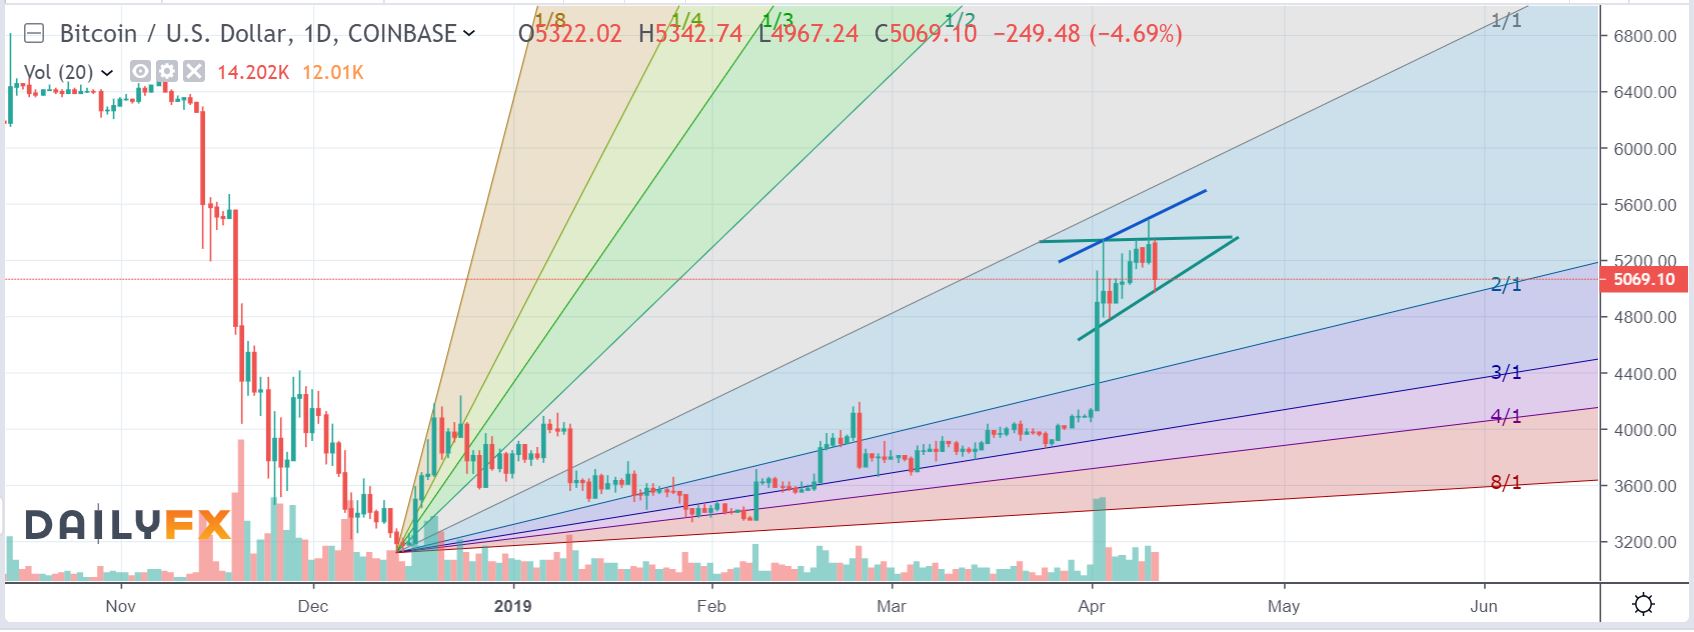
BITCOIN – I also pointed out that if this pops and becomes a bearish rising wedge, we would see Bitcoin fall after hitting the upper resistance. It is not Long Term bearish, just more consolidation as Bitcoin tags resistance. See the Chart.
.
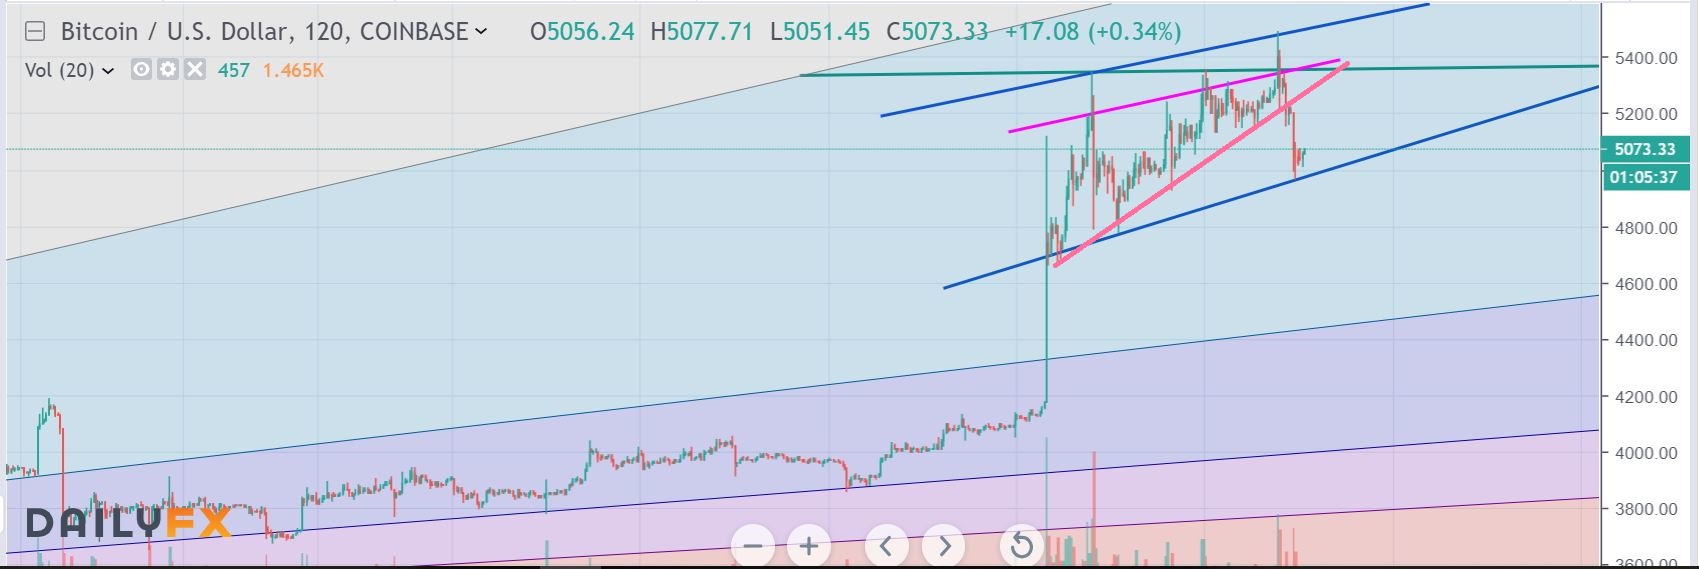
BITCOIN April 11 – We got the pop higher and the Pullback after tagging resistance. Our Blockchain stocks rocketed higher, some up 20-50% Wednesday alone! The Bitcoin drop happened overnight, and those blockchain stocks pulled back Thursday with it. Here I have drawn a Blue channel around that old Bull Flag, however…
,
BITCOIN April 11 – With that channel in blue, I also could see a larger Bull Flag form, drawn in Green. I still own my Blockchain positions such as HVBTF, MARA, MGTI, etc,. I even wanted to add, but those move so much I thought it best to just watch this Bitcoin flag or channel unfold a bit more Friday.
.
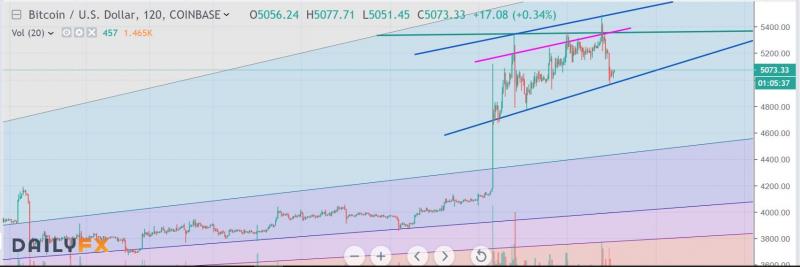
BITCOIN April 11 – I posted this chart in the live trading area below the report Thursday, to show the possible channel forming. It would be good to watch this often going forward and make sure that the lower line holds as support.
.
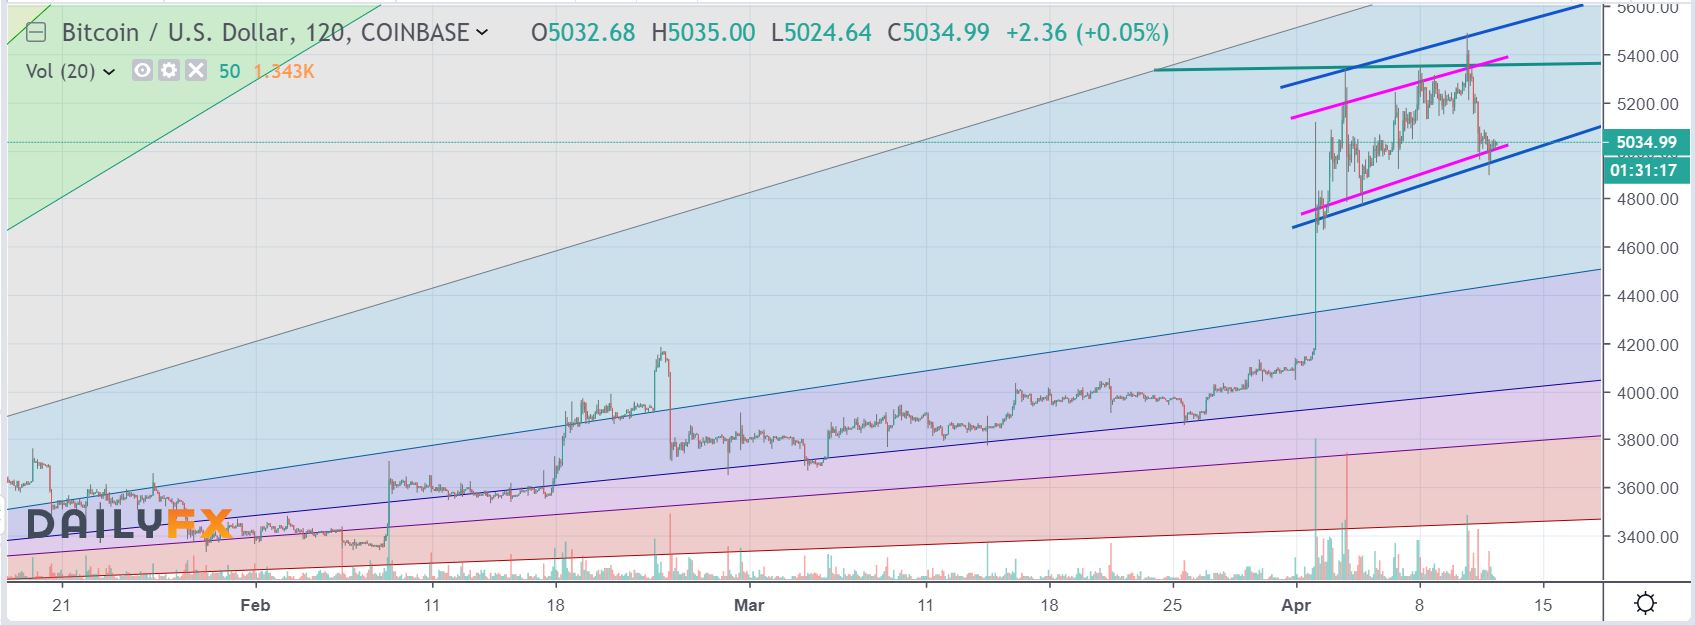
EDIT : BITCOIN April 12 – 6 a.m. Eastern time – Live as I proof read, so this includes the overnight action. It actually broke down last night to $4900 & bounced . I’d love to see it rise higher on Friday and drag those Blochchain stock higher too.
.
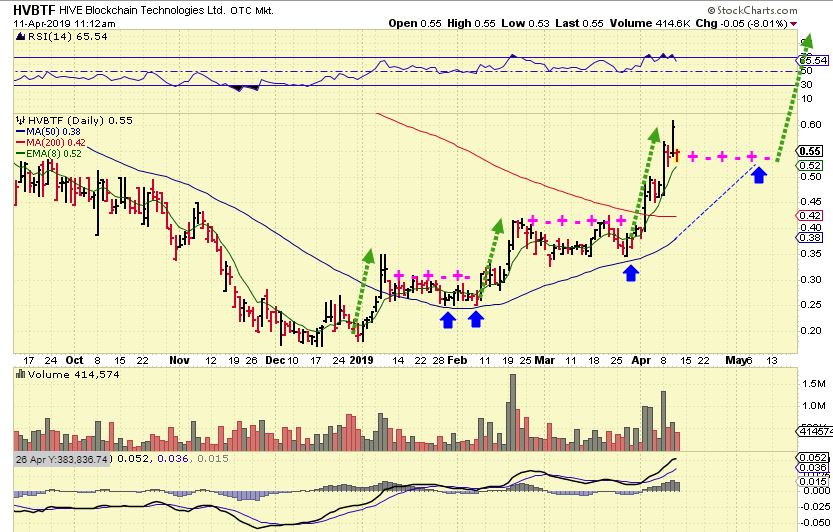
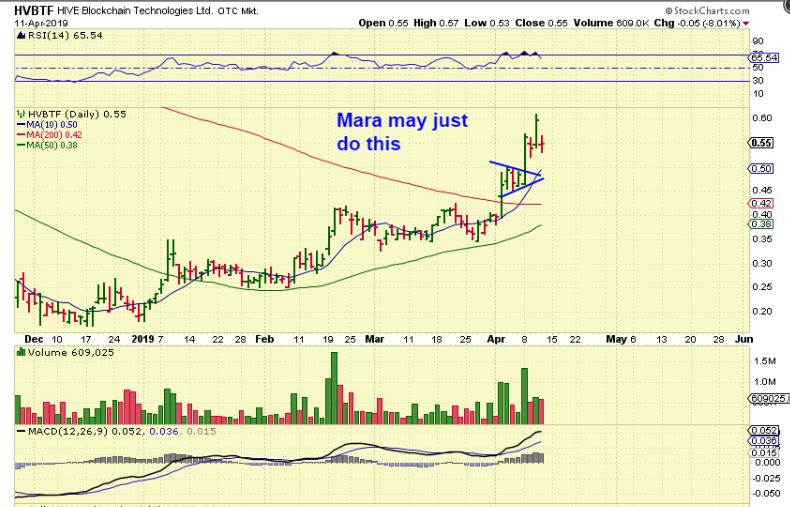
HVBTF – After a big move by HVBTF , we usually have seen sideways consolidations. That could happen here, since it ran from 35 cents to 50cents. That is a big move, but I think what happens from here depends on what Bitcoin does. If Bitcoin runs to $6000 soon, I think that HVBTF will just continue higher too. My point? If this sideways consolidation happens, the BUY is near the 50 sma for HVBTF.
MARA #1 – MARA jumped 50% when Bitcoin broke above that bull flag. It dropped 17% Thursday on the Bitcoin drop, but it dropped with 1/2 the volume. That is good so far…
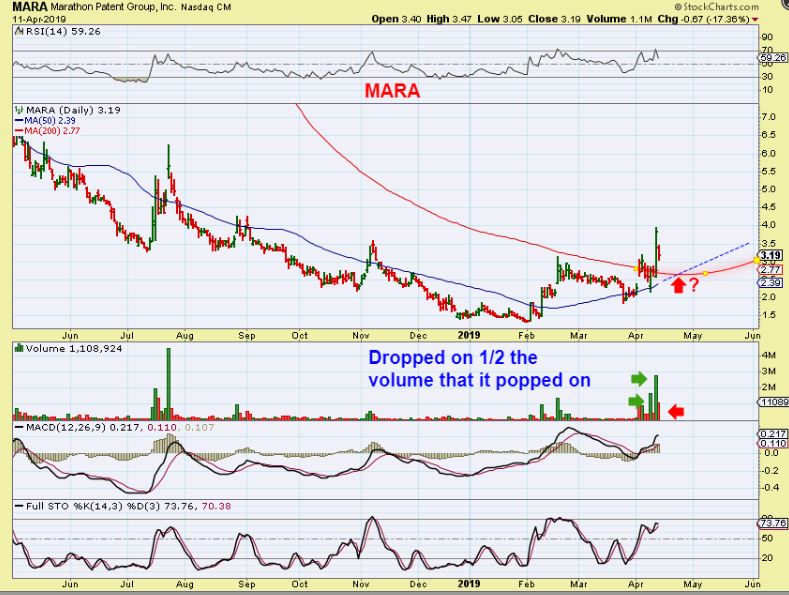
MARA #2 – So it could back test the 200sma / 50sma intersect. That is another good size drop, but it may be a place for me to add if I want (and if you want to).
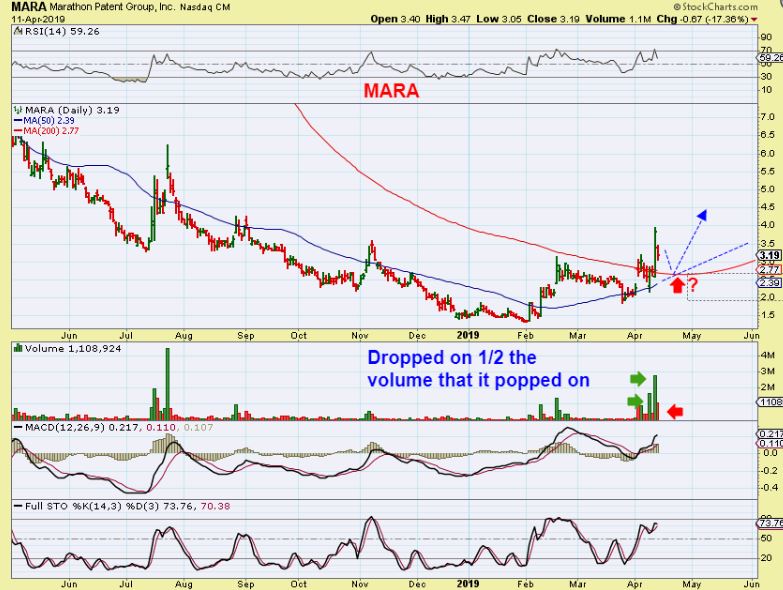
MARA #3 – Or it may just bull flag and continue higher.
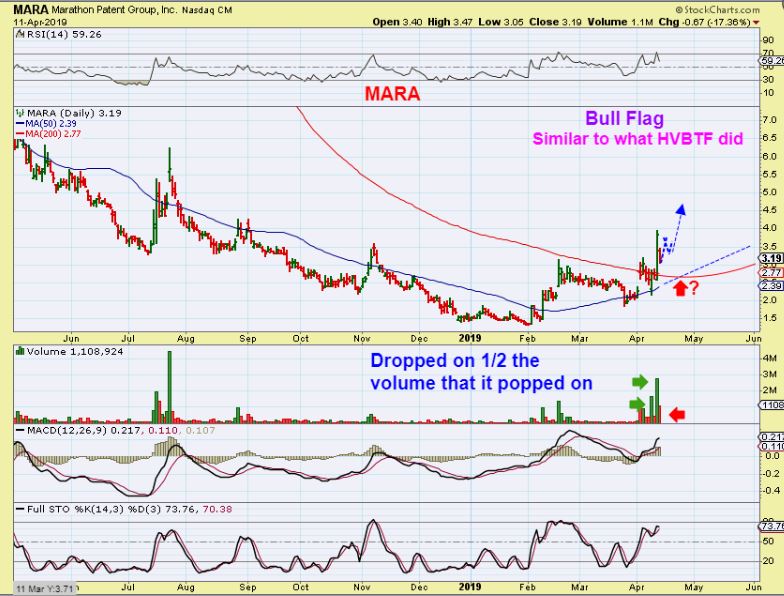
Look at HVBTF- It bull flagged to the 10sma before the last run and MARA may just do this too.
.
CGC – CGC doubled since Jan, running $25 to over $50. 2 analysts wrote a negative story about it, saying that sales seem ‘tepid’ since legalization. Hmmm. Maybe these guys just missed a great 100% move and pretty much gave it a downgrade hoping to buy the pull back. 🙂 Let’s briefly discuss this…
CGC – CGC has been running strong since 2017 when it was only$5. It has experienced intermittent strong ramps higher before MJ was legal in many places for Medical and Recreational use, right? If CGC had this growth before legalization, I’m quite sure that it will be fine with more and more legalization coming into the picture. We look to be a lot closer to a buy here as price nears support than a sell. Watch for support, this selling was lighter than the buying.

.
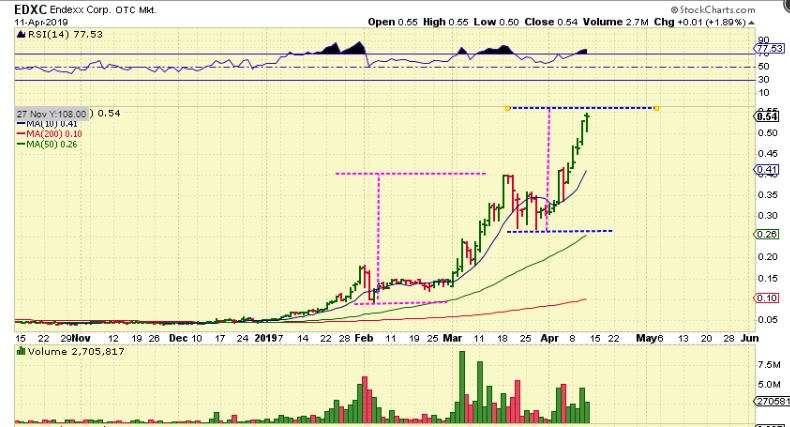
I was asked about EDXC. What a beautiful ramp up, I can’t believe I bought this one at 2 cents, and it is 52 cents!! I sold mine, but some are still holding, so what now? Below is what I wrote when asked by someone in EDXC now. It is a tough call…
.
EDXC – EDXC is currently showing some real buying interest, and pull backs have been rather quick. That said, it is getting extended and it can pull back quite a bit & consolidate and still be very healthy chart ( Like a pull back to the 50sma, as drawn here) .
So if you just want to ride this for years, price could honestly be a lot higher later this year or next year. If you are trying to avoid giving back your gains? That may require selling at least a portion and then try to buy it back later. Maybe a tag of the 50sma is the next buy.
Depending on your goal, it may be best to sell some, yet hold on to a portion, just in case it gets even more parabola. Also if I draw a lower trend line, a dip won’t reach the 50sma.
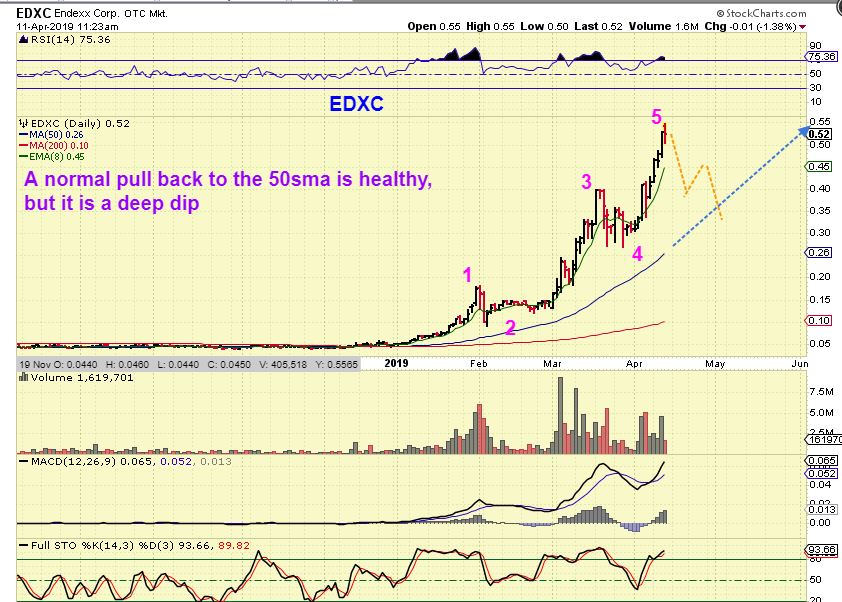
* Let me add: I don’t know exactly where ‘5’ will top, but we are close to a run equal to the wave 3 run.
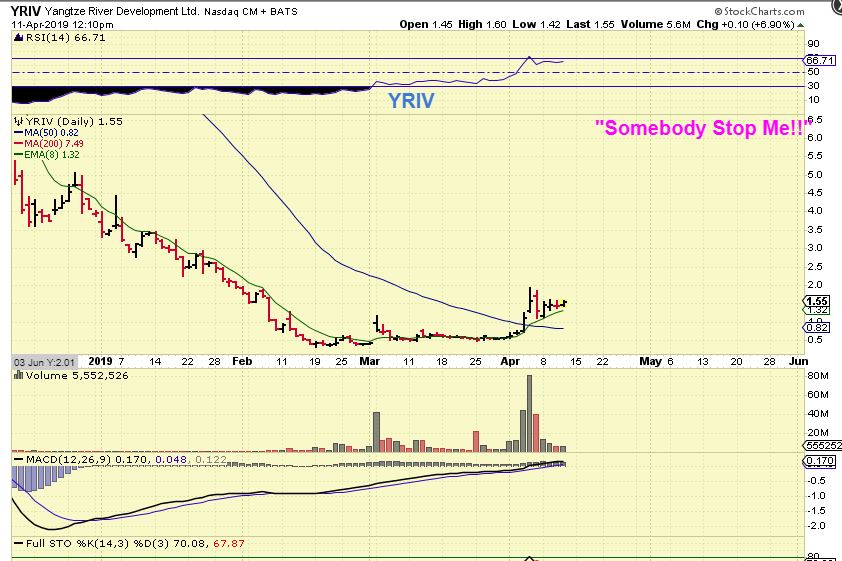
YRIV – HIGH RISK because a stock that drops from $12 to $0.50 like this one did obviously had troubles, but this short term set up is bullish again. This ran from 40 cents to $2 and now seems to be bull flagging at the 8 ema.
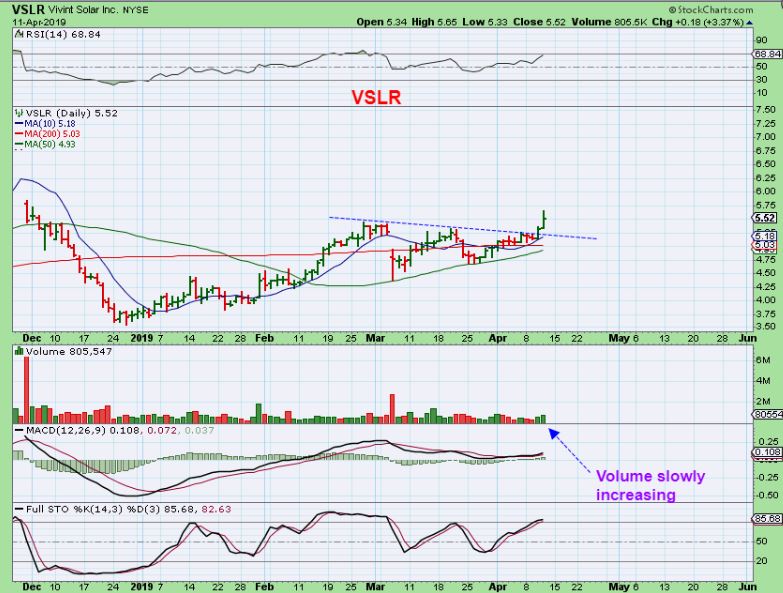
VSLR – VSLR continues to act correctly.
I will be away this morning after 9 a.m. eastern time, I should be back in the live trading area below the report after lunch , maybe 1 p.m. Eastern time.
.
Bitcoin 6:45 a.m. Eastern : We are bouncing back over $5000, so it is hopeful that Bitcoin holds that support area. This could be a mini inverse H&S .


