April 4th – Straight up
The markets continue to run straight up. Well, maybe not straight up, but like the Theme picture shows, they have been working their way higher and some sectors are at new recent highs. I want to point out a few things on this run higher, so lets get right into it. We’ll start with the Sox…
.
SOX – Take a look at the purple line and that represents a break out after the SOX briefly lost & regained the 200sma. From there it popped higher and chopped lower, back under the 10sma. Now it has popped to new recent highs again.
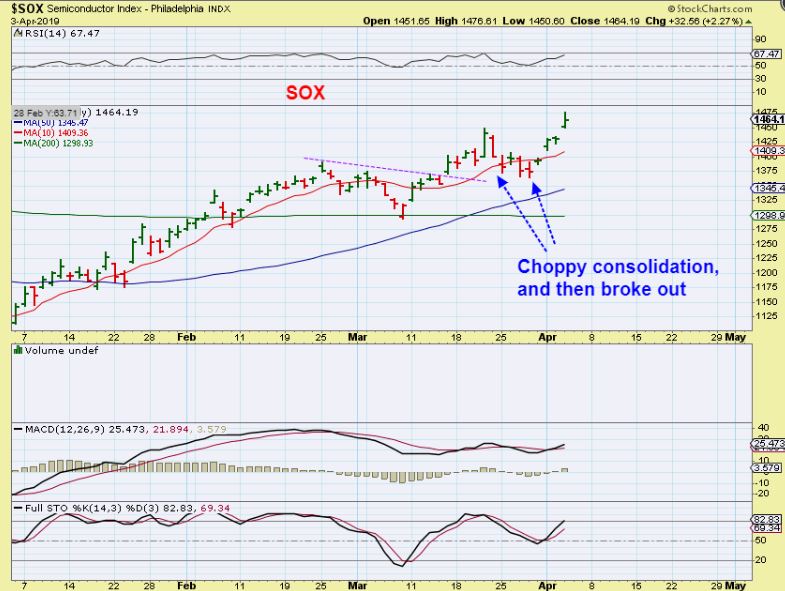
That shows that a bullish run is not always an easy one to ride. Now let’s take a look at the SPX…
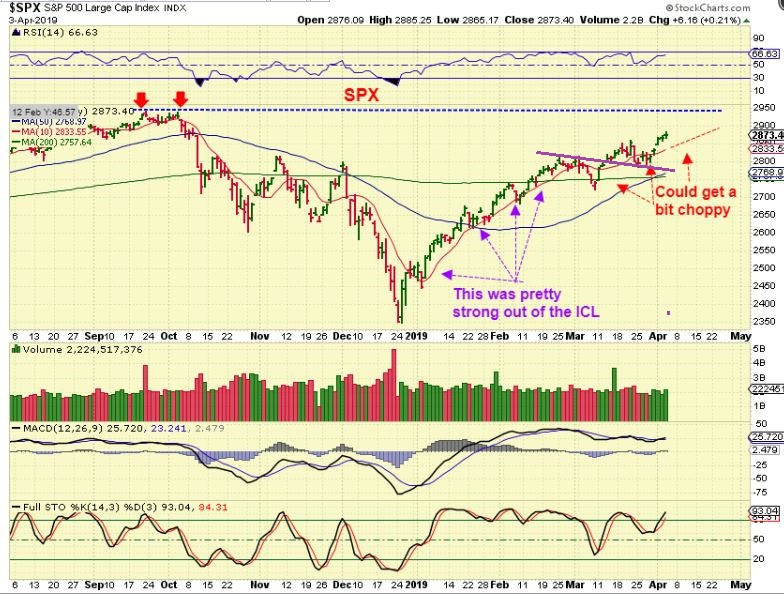
I AM POINTING OUT THE CURRENT CHOPPINESS EVEN THOUGH WE ARE MOVING HIGHER
.
SPX – Do you see the similarity? Purple line is the break out after losing the 200sma. It then got choppy with a retest of that purple line, and moved to new recent highs. MY BLUE LINE shows Sept 2018 highs, and price could be heading there, but it may be choppy.
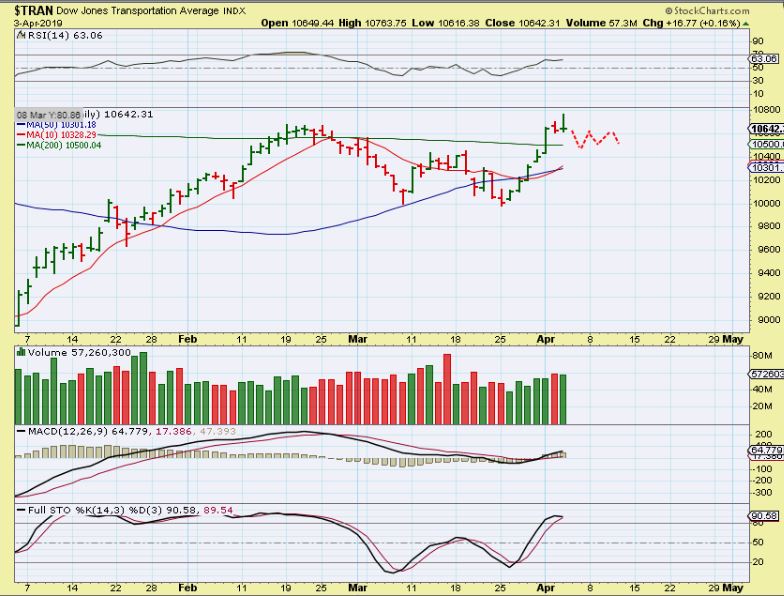
TRAN – Here we have our lagger struggling at the 50 & 200 sma. The Transports did Pop above both moving averages, but it may now get choppy, if it acts the way the SOX & SPX did after moving above the 200 sma.
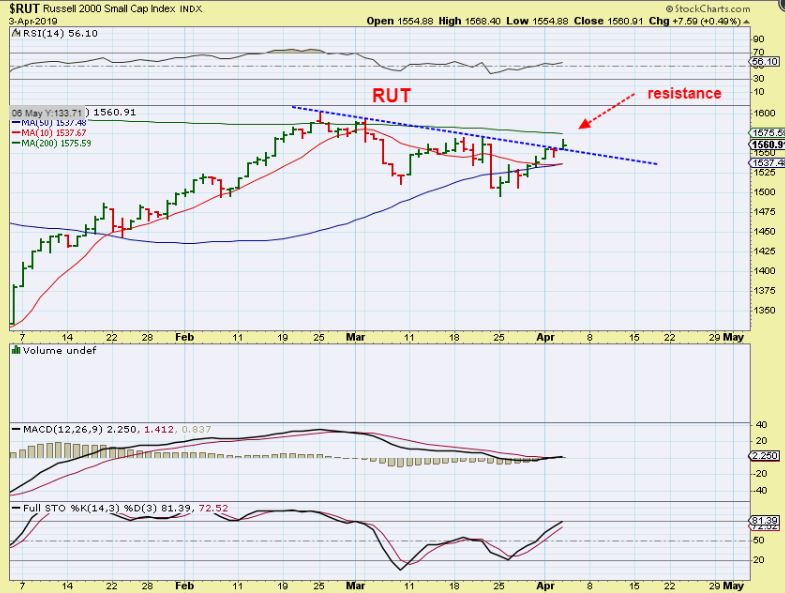
RUT – The Rut has been our real lagger, in fact it broke prior lows and looked quite bearish. It regained the 50sma, we’ll see what it does at the 200sma.
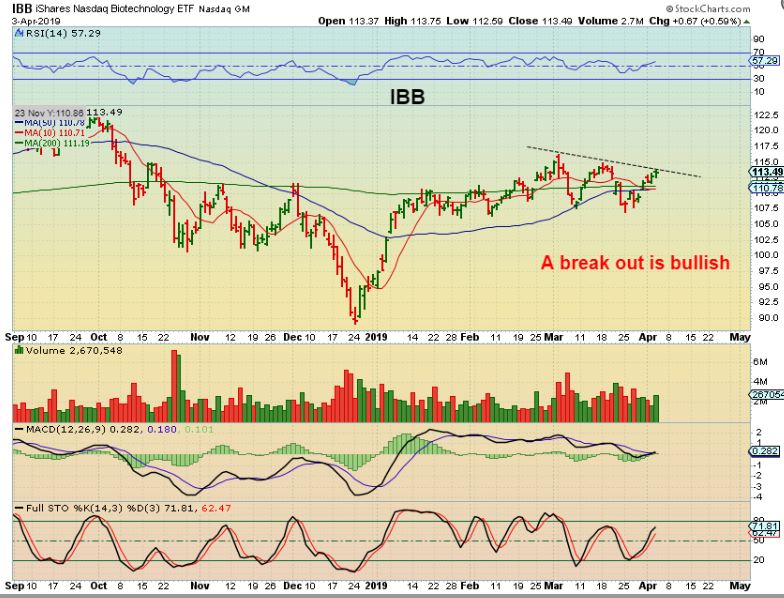
IBB – The Biotech sector has actually been offering some nice set ups and break outs, by building bases after the sell off. As for the IBB, it actually looks different from the other sectors. It has moved sideways Since early January, coiling around the 200 sma & 50 sma and this is actually a bullish formation if it breaks out.
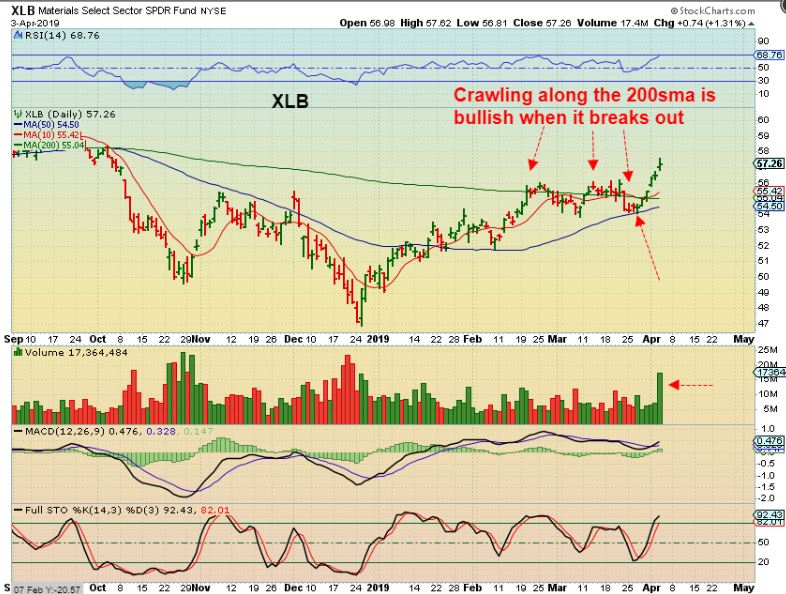
XLB– Look at how long the IBB has been running along the 200sma above, and compare it to the XLB here below. The XLB broke out and a break out from that sideways chop can be very nice. IBB looks set to break out, and LABU…
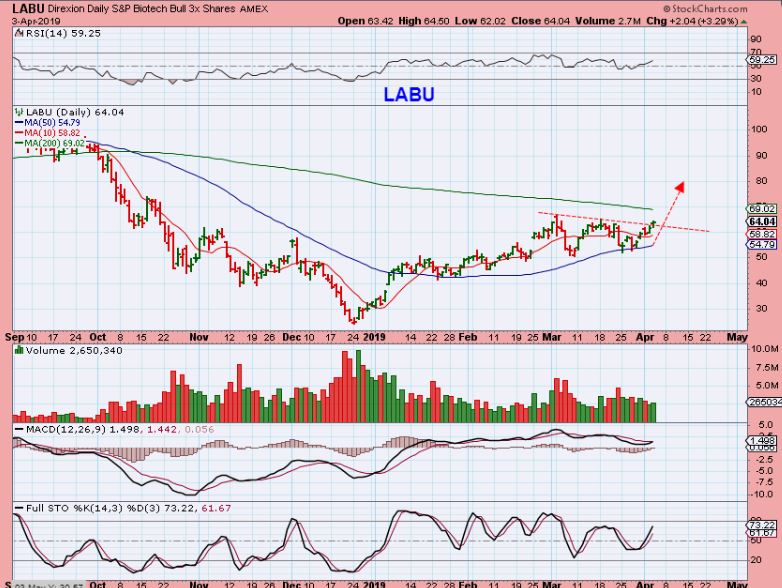
LABU – This looks a lot like the XLB set up above, and may be ready to break higher and run too.
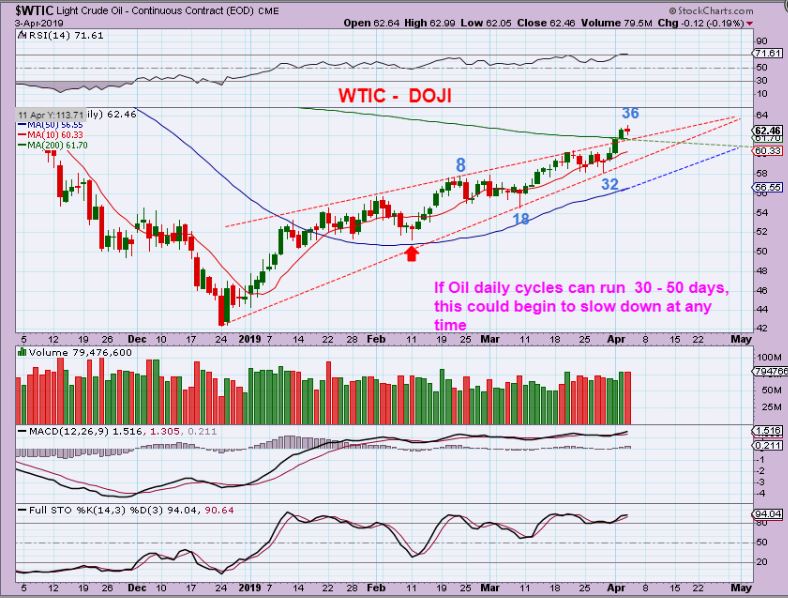
WTIC – Oil has a doji candle after the inventory report, so it could pause here, go sideways, or even begin to dip into a dcl. On day 36, we could be close to a peak, but this would be very right translated and should move higher after a pull back.
USD – The current daily cycle for the USD peaked on day 9 so far. A swing high ‘unconfirmed’ has formed, but the 10sma also held price. The USD can bounce off of the 10sma and negate that swing high, so we’ll see what the USD wants to do Thursday & Friday. 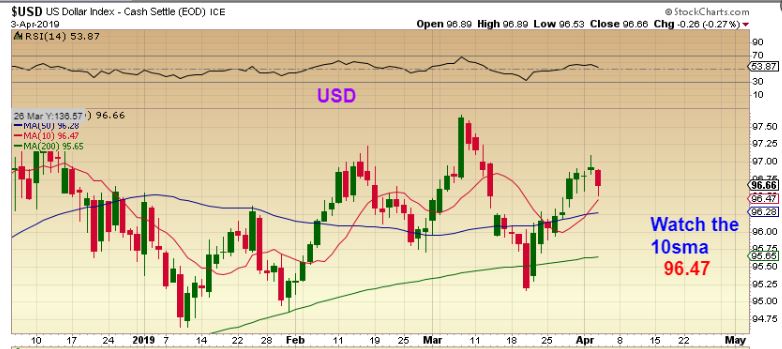
NOTE: If we believe that GOLD & The USD are correlated, ( they are at times, but lately they have been a bit less tied together), then a drop in the USD would Pop Gold, and another small move higher off of the 10sma would drop Gold down a bit further. We will address this further as things play out.
.
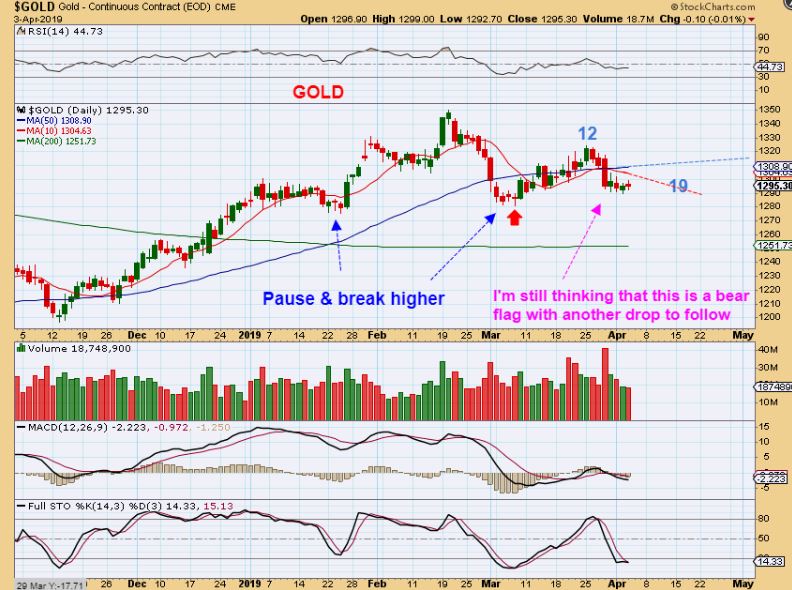
GOLD – Gold on day 19 has been going sideways. I expect a drop lower from here . A break higher is Less Likely.
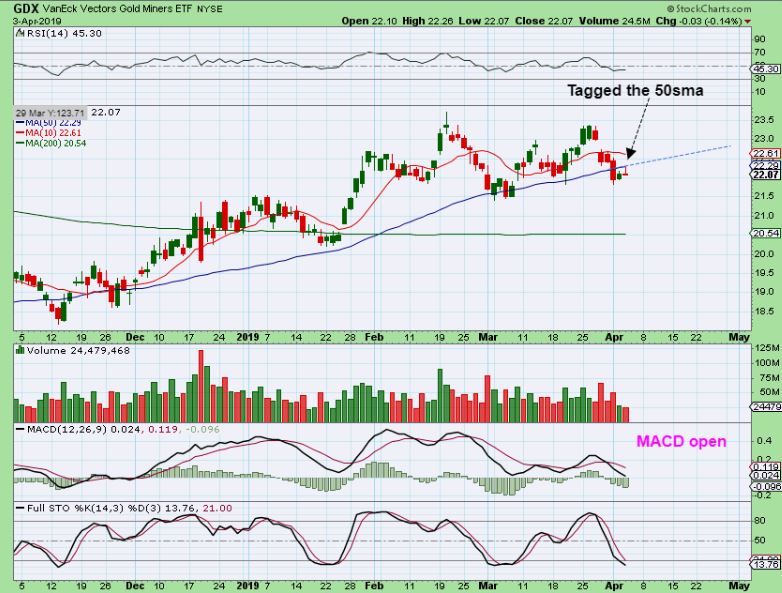
GDX – GDX tagged the 50sma , but it sold off after doing so. It is oversold, but it can remain oversold for a while.
.
We have had many trade set ups in the past few weeks, but some of these sectors do look like they may get a little choppy. That doesn’t mean that stocks there won’t be follow through. We have seen follow through on a many set ups, even if the markets are down that day or choppy. That is why I just admonish entries at low risk points, and the use of ‘stops’. Enjoy your Thursday trading.
.
~ALEX
.
REMEMBER, a good set up in the Precious Metals sector seems to be setting up for the patient ones that want to Buy Miners, so CASH on hand is a good thing to have at that time. For traders: I actually have about 20 stocks that look like possible good buy set ups, but I only want to give a few additional set ups here. We still have some other set ups from past reports that are still in play in the Biotech, MJ, Blockchain, Energy, and tech sector.
.
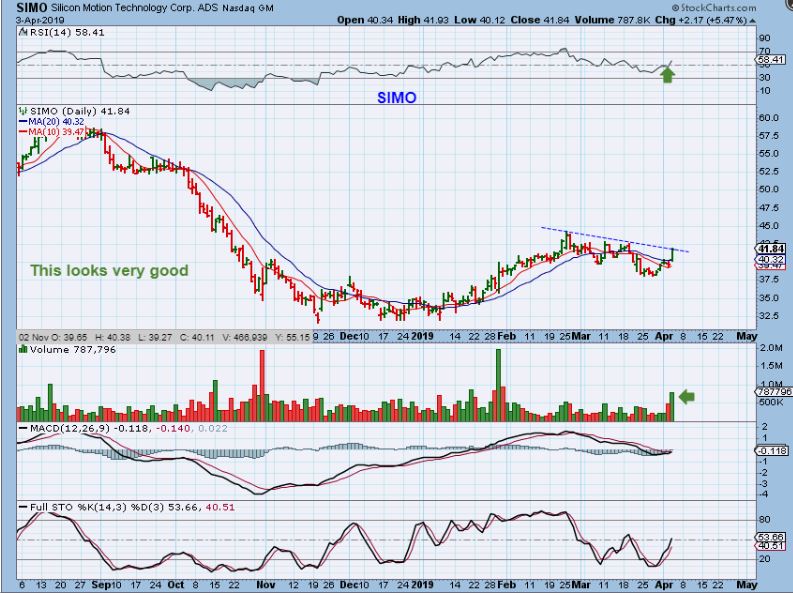
SIMO – This is actually a very bullish looking set up. It is low risk if you buy the break out and use a stop.
.
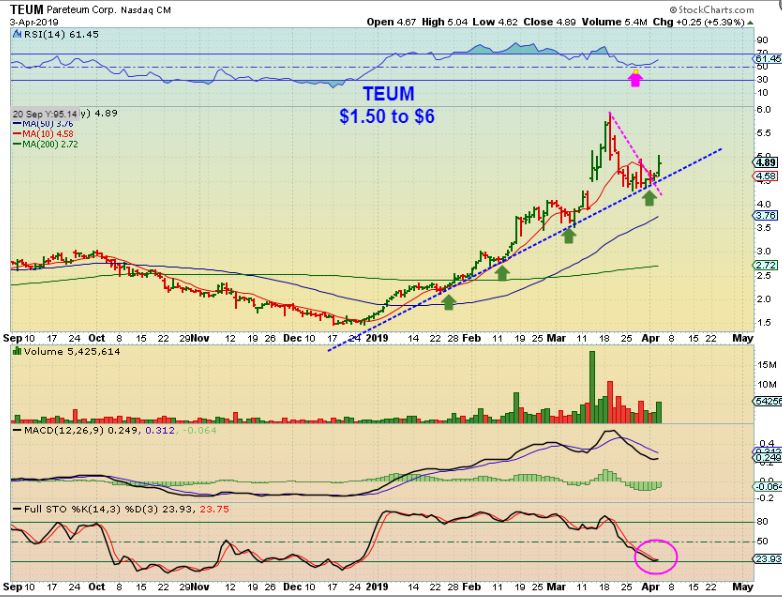
TEUM has been very bullish, and after this recent consolidation, it became oversold. It reversed higher yesterday and is a buy if it doesn’t gap open higher than $5.
.
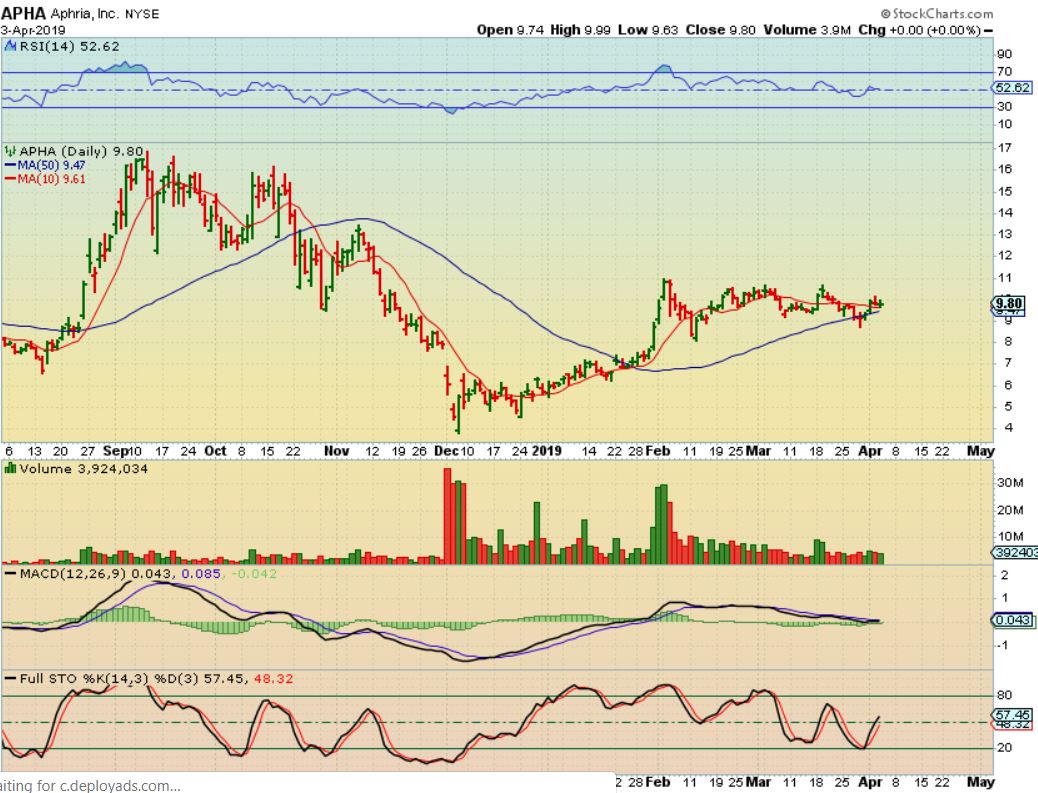
APHA remains the same, low risk as long as it doesn’t break down below that 50sma. ( MJ STOCK)
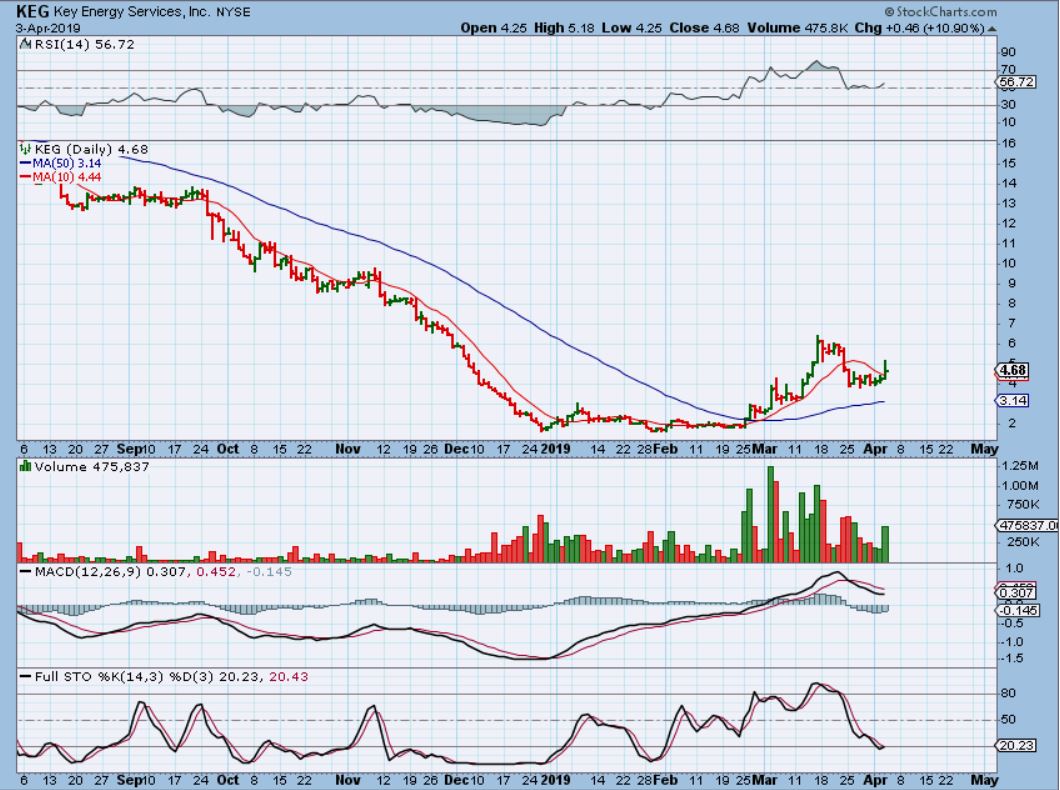
KEG- Ready to go again? I should have used the 20 or 34 sma, it is actually reversing above those.
Yesterday the SOX (Semiconductors) Popped from a choppy consolidation ( See the first chart in this report). It also has gaps below it, so it may remain choppy, but many semi stocks have been quite Bullish. They were low risk buys in past reports or mentioned as doing well, but may be a bit extended now ( AMD, MU, CY, CREE, TSEM, LSCC) and many more. So a few were ‘Buys’ in prior reports, but currently …
.
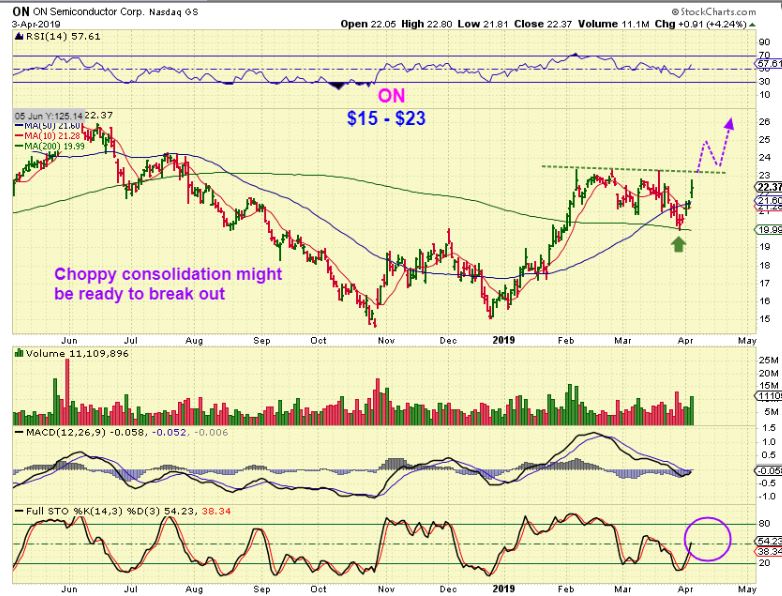
ON- After a strong run from $15 to $23, price has been consolidation. The best low risk buy was the reversal at the 50sma, but another ‘buy’ is a break out from a consolidation. It is also a buy now since it regained the 50sma ( this may stay choppy if it isn’t ready to go though).
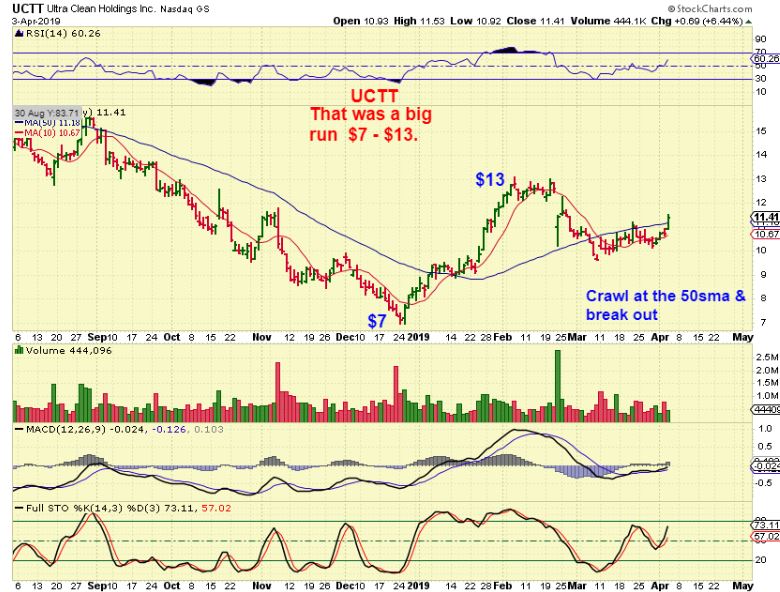
UCTT – This was a good run that entered consolidation. As it crawled along the underside of the 50sma, it broke higher yesterday. I would have liked more volume, but this is bullish action.
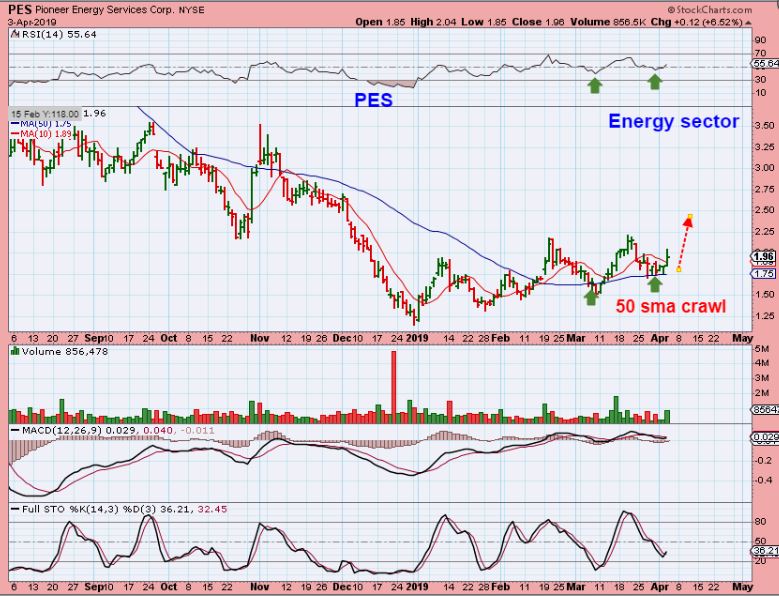
PES – So this has been choppy base building in the Energy Sector. Volume started to increase yesterday, so it caught my eye above the 50sma.
INSG #1 – This is yesterdays pop above the 10sma and you can see the volume increase. I’m pointing out this Tech company because it has other longer term bullish features too. See the next chart…
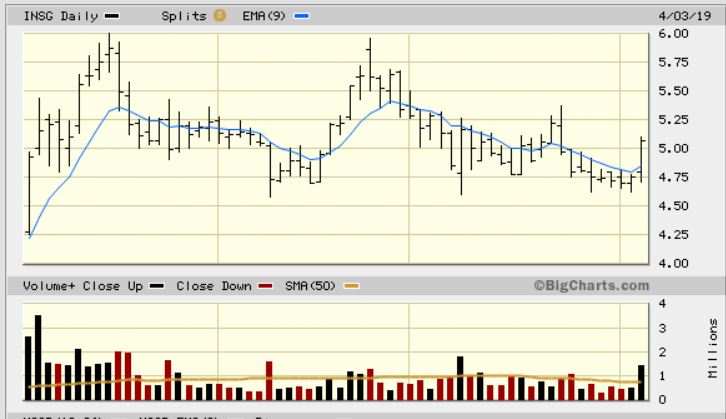
INSG #2 – It is noteworthy that during the market sell off in Nov & December, this one didn’t really sell off. It seems to RUN STRONG, and then consolidate. It is currently in the ‘consolidate’ phase, but yesterday was a strong push toward the 50sma with increasing volume , so it may be ready to run ( or a watch list). 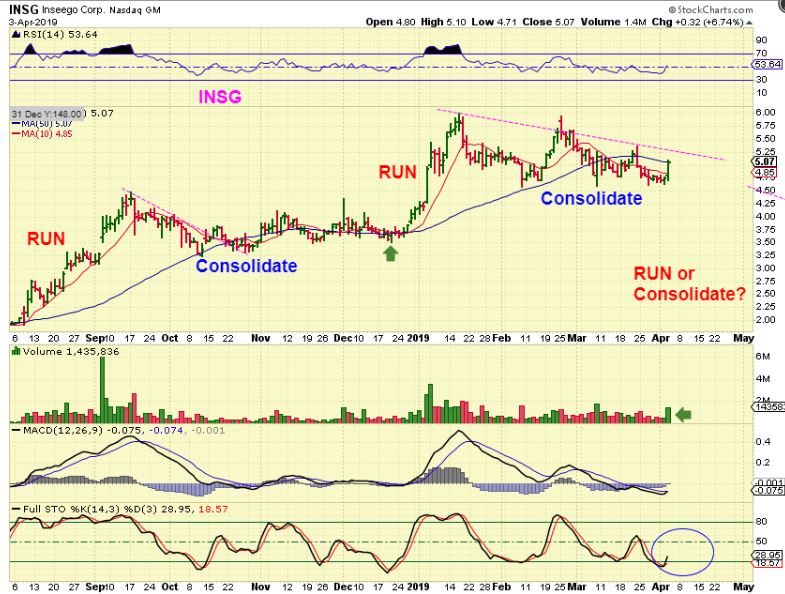
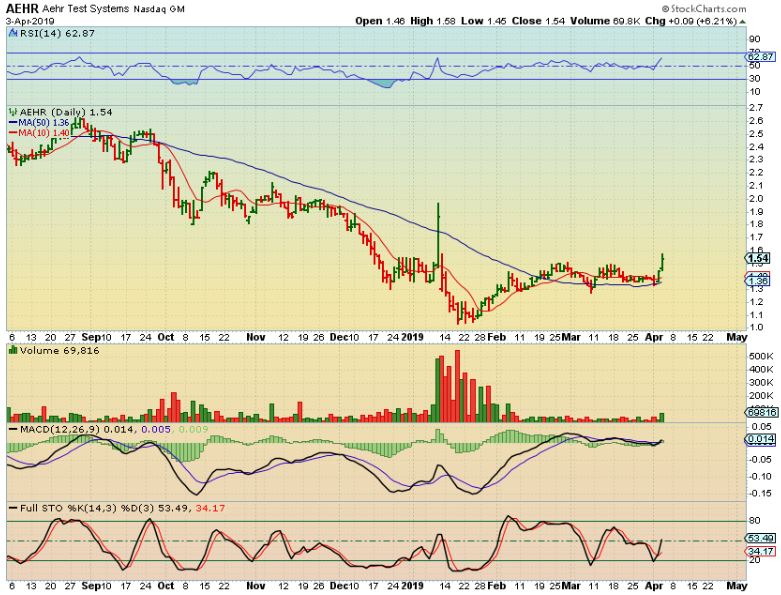
AEHR – I wasn’t going to show this one, because volume is light ( 70.000), however this is a very bullish stock price-wise, so I will just leave it up to you. It has not been able to break down as it consolidated & Rode the 50sma bullishly. Yesterday it Popped and looks like it may be ready to run. Hate the volume / Love the set up.