April 20 Weekend Report
To the joy of many readers here, we are finally getting some of the sale prices on Miners that we have been expecting for a while now. Let’s take a look at our weekend review and see how things stand after this 4 day trading week…
.
SPX WEEKLY – We are coming due for a pull back cycle-wise. In the past, we have seen pull backs drop to the 50 week ma, as shown here.
1. It could happen at the next drop to a dcl, or
2. It may happen after a small drop to a dcl and then a break to news highs that rolls over, as shown here.
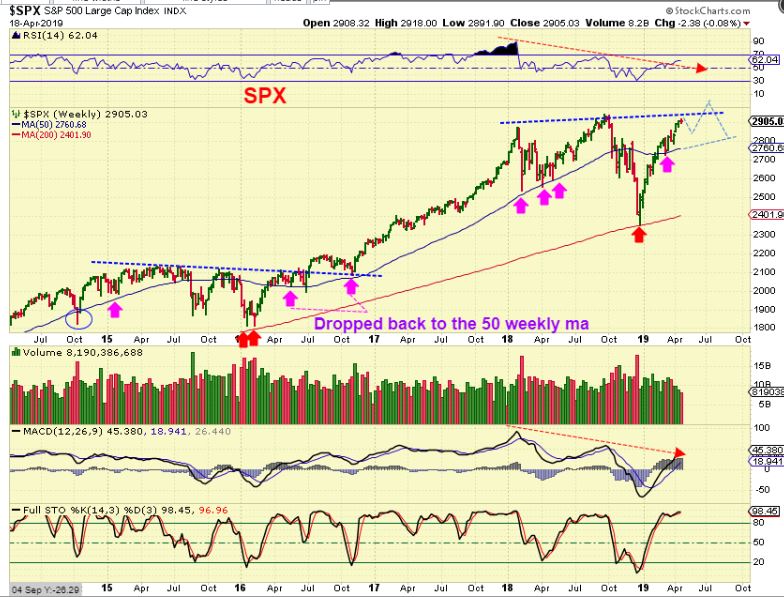
Let’s discuss this a bit further…
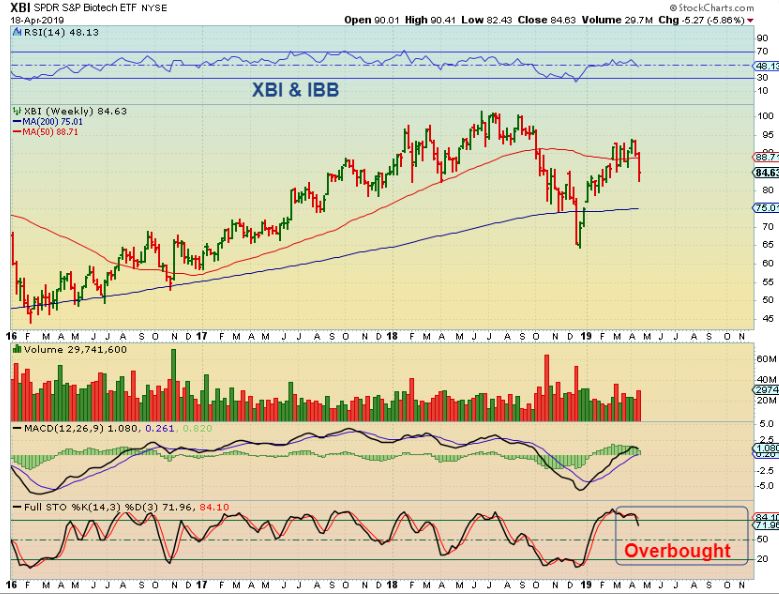
XBI WEEKLY – Last week we saw a sudden plunge in the IBB, XBI, and Real Estate. It came out of no where, and just crashed down through ‘support’ areas. When I see that, the hairs on the back of my neck stand up on end and I have to sound a warning. I do see an open gap at the 200 weekly ma.
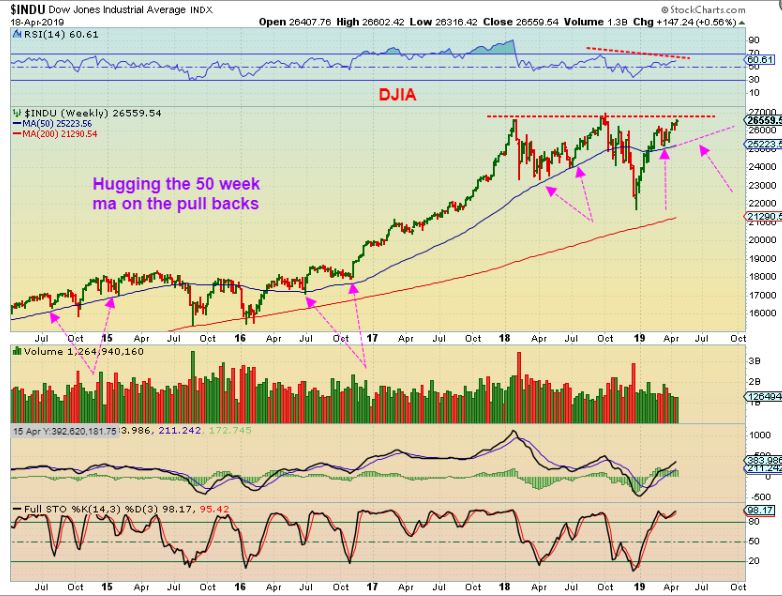
DJIA WEEKLY – After the 2015/2016 sell off, it rallied strongly to prior highs and then dropped to the 50 week ma. As the DJIA hits prior highs, we do see divergence, so be aware of that.
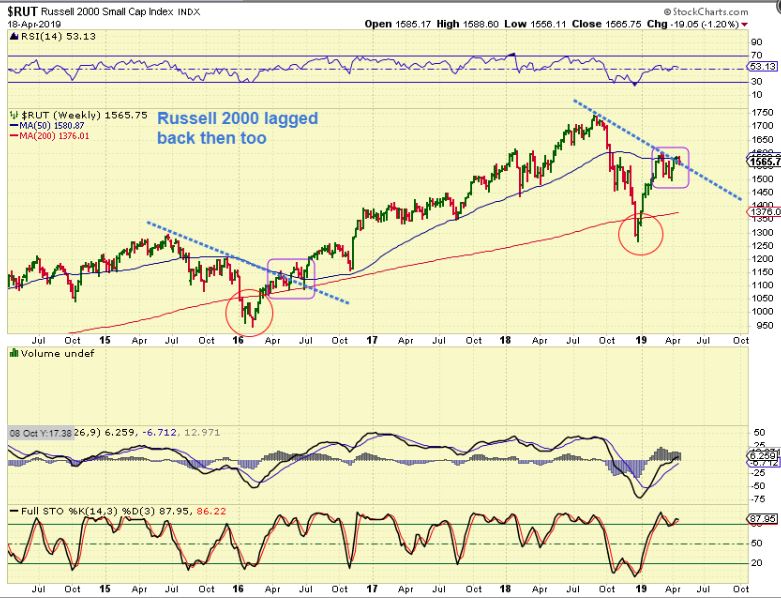
RUT WEEKLY – This also looks similar to the choppy slow progress made after the 2016 sell off broke below the 200sma. That happened in 2018 too. It actually bounced & chopped around sideways for that whole year. It made higher lows and higher highs, but the pull backs were deep.
So the General Markets: Can the General Markets Big Picture have a blow off top into the end of 2019? It can, but let me just say summarize things like this….
1. I expected a drop heading into the end of last year to an ICL, and we got it.
2. Honestly I thought that we would see 2 daily cycles rise out of that ICL (and the first part of the 3rd Daily cycle) and then we’d be able to see better if we get a blow off top continuation higher, or possibly return to a dropping topping market.
3. I expected a topping market and the end of this long bull run, while precious metals begin their bull run. The FED was talking about maybe 4 more interest rate hikes in 2019, I thought that the markets would feel the pressure, similar to the move at the end of 2018. THAT IS WHAT I EXPECTED, and it still may happen that the markets are topping.
4. Right now, The FED completely changed their approach and discussed NO rate hikes in 2019, some even think they may cut, and that could prop the markets for another year.
5. On a daily chart, the SPX is coming due for a dip to a dcl, and the way Biotech dropped has raised concerns. With all of this happening, MY advice has to be to be alert. Stay Frosty if you are still long the general markets. My recommendation was to play it safe, the best way you see fit. You may choose to Tighten stops, sell some positions, sell and wait for a dip, etc, as we eventually begin to dip into the next dcl.
.
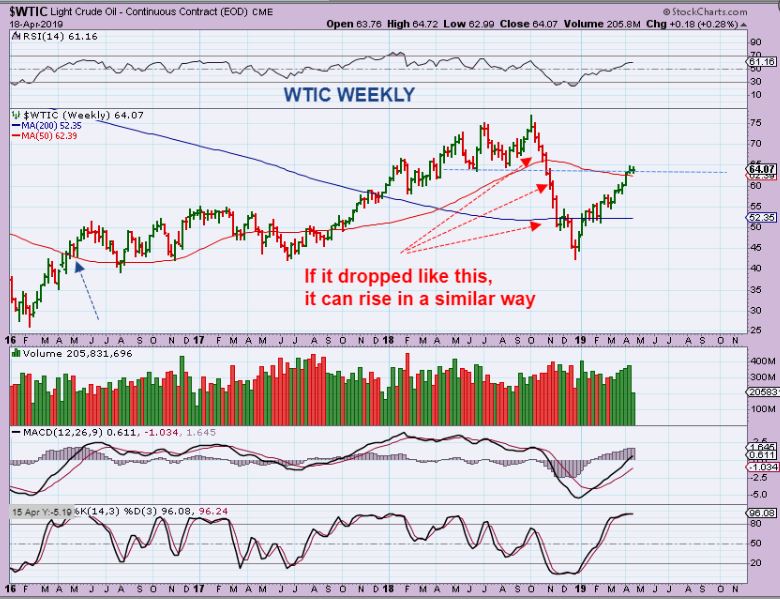
WTIC WEEKLY – Oil looks to be rising out of the lows in a similar manner that it dropped down there. It fell week after week after week, and now it has been rising week after week after week. We chopped at the 200 week ma, broke through the 50 week ma, and we Oil now finds itself at another resistance area (Blue line). It still looks Bullish and has worked through all resistance.
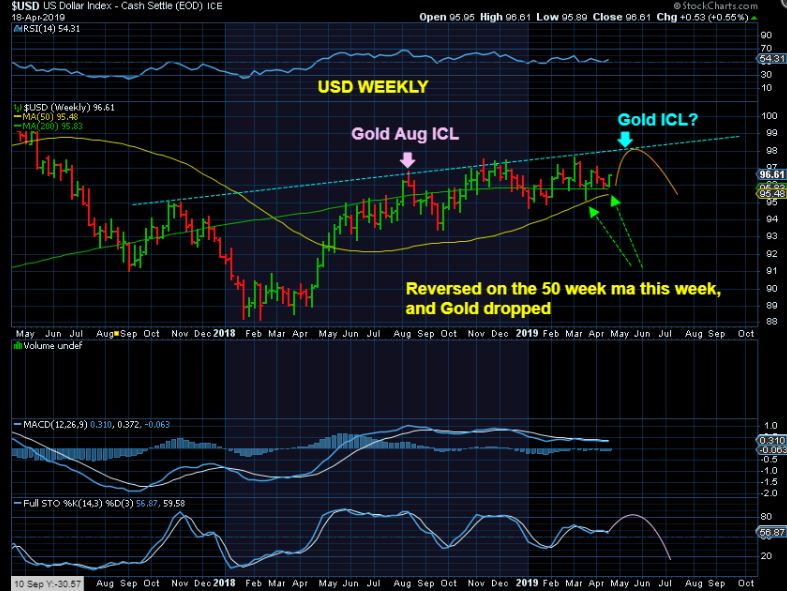
USD WEEKLY – The USD put in a weekly reversal on the 200 week ma and simply remains bullish. As it ran higher Gold, Silver, and The Miners dropped. This COULD continue higher as shown, and actually I would expect it to. The question is: Will Gold sell off further as the USD rises, or will it begin to resist the move? Let’s look at the Precious Metals.
.
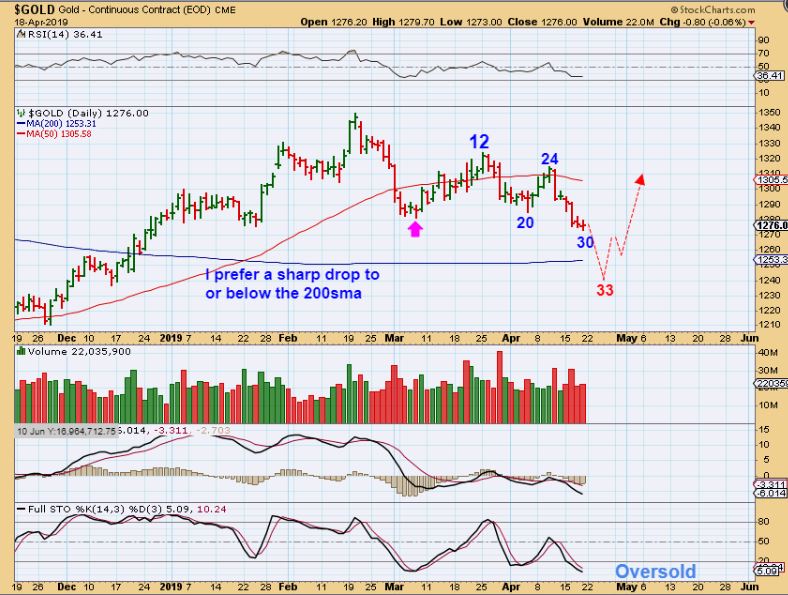
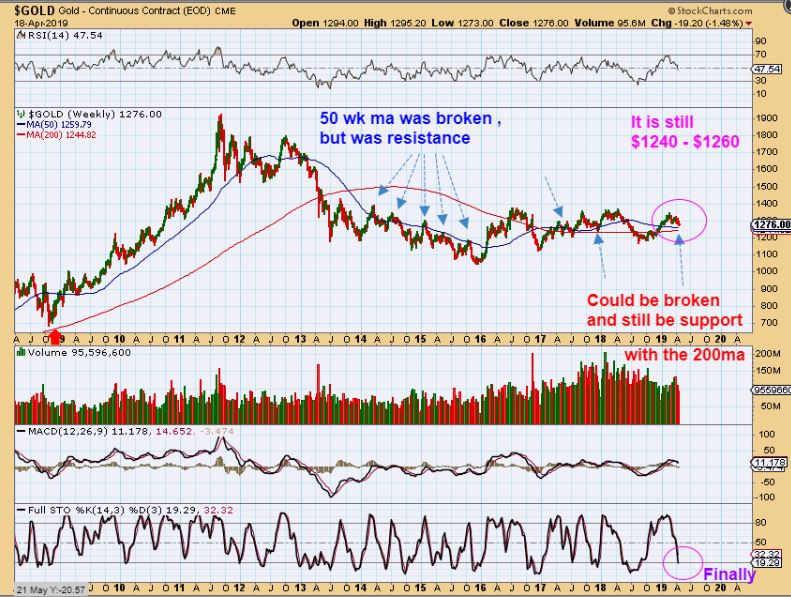
Golds daily chart shows that we are in a left translated daily cycle. It could get a quick slam down next week if this is a small bear flag on day 30. That may actually be all the selling we get to an ICL, since my targets have been $1240-$1260. That is a small doji and really makes it easy to put in a swing low, but an unconfirmed swing low could still break down. I actually prefer a real drop as shown, and I’ll show you why…
GOLD WEEKLY – For starters, take a look at how Gold has acted at the red 200 week ma and the blue 50 week ma in the past. They are again pinched close to each other, and that gives us the $1240 to $1260 Price range, which was the area that we have been looking at for weeks. So again, on day 30, Golds daily chart shows that we could get a quick slam down next week too, and that may be all the selling we get. It seems too easy, but that is the way this looks at this point. And Silver?…
Silver Looks good in many ways …
.
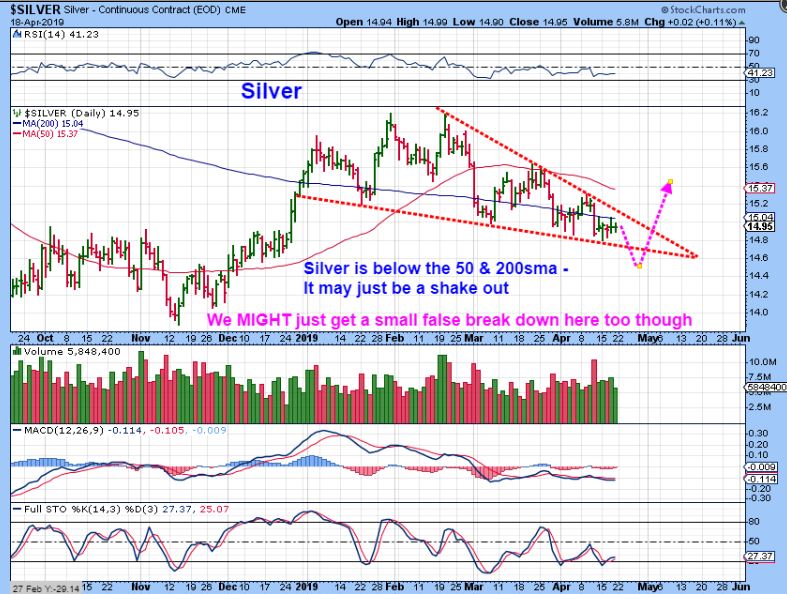
Silver Daily – I have been pointing out a bullish descending wedge. This CAN just break out from here, but a false break down would shake out some bulls, so that may happen too.
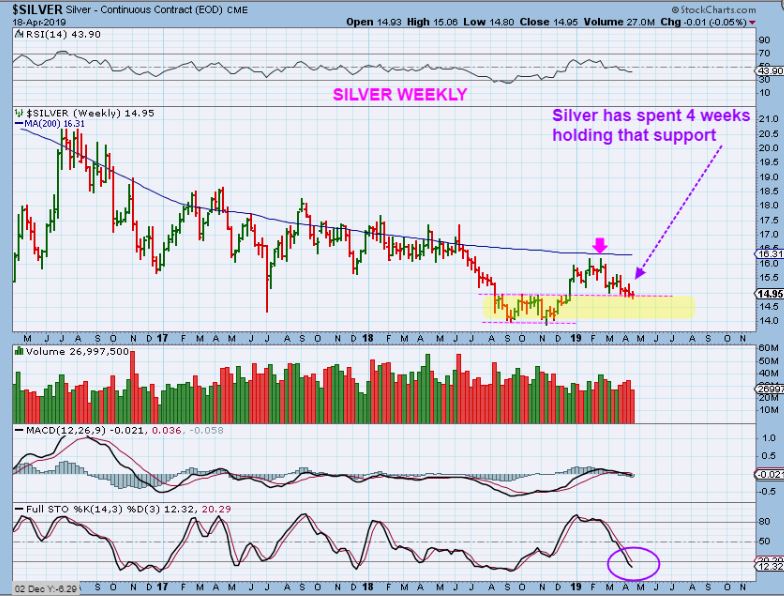
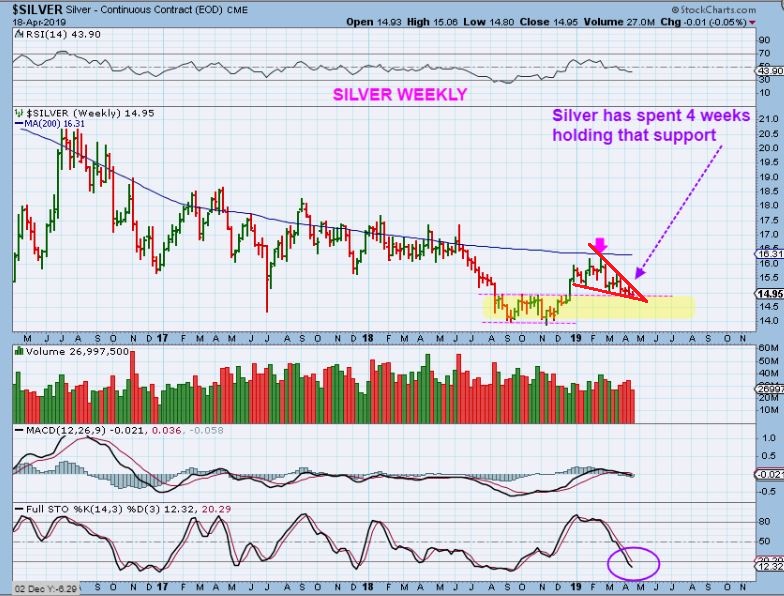
SILVER WEEKLY #1 – Silver has been holding support for many weeks. Silver has a bullish descending wedge that is at support. I think Silver may actually be done selling off, but I’m waiting for some type of reversal to prove it.
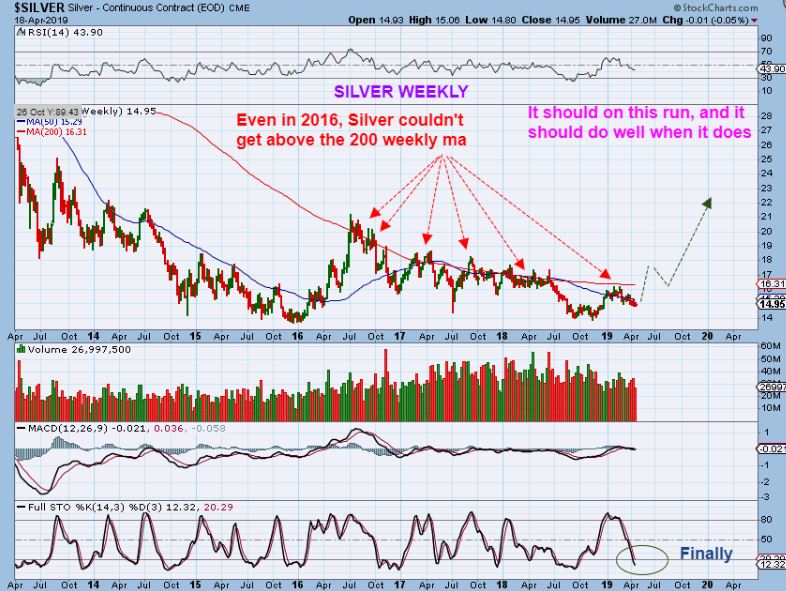
SILVER WEEKLY #2– Do you see how Silver has been capped by that 200 week ma? When it gets above that, it could really take off. I have been saying that you want to own some Silver stocks when Silver breaks higher.
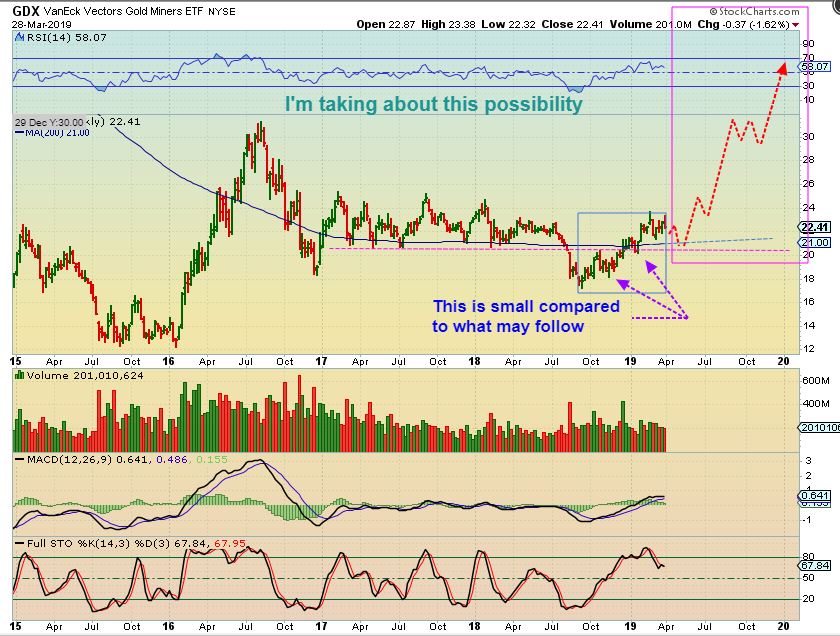
GDX WEEKLY MARCH 28 – No doubt you remember these 2 charts, since I have included them in a few of the past reports. It is hoping that we get that drop to support and look for a reversal to go long.
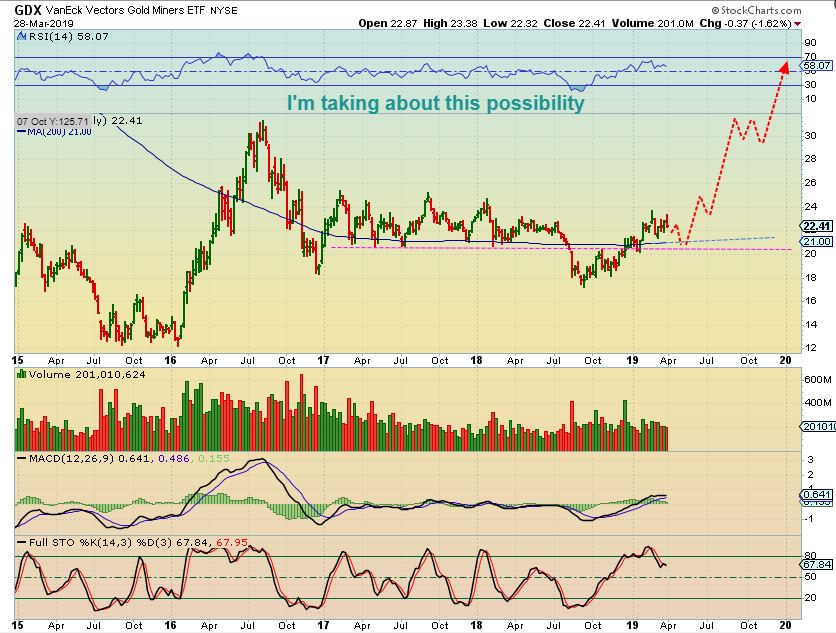
GDX WEEKLY MARCH 28– GDX just kept churning sideways for several weeks and wouldn’t drop though. You can see 9 or 10 weeks at this price range, and then finally last week …
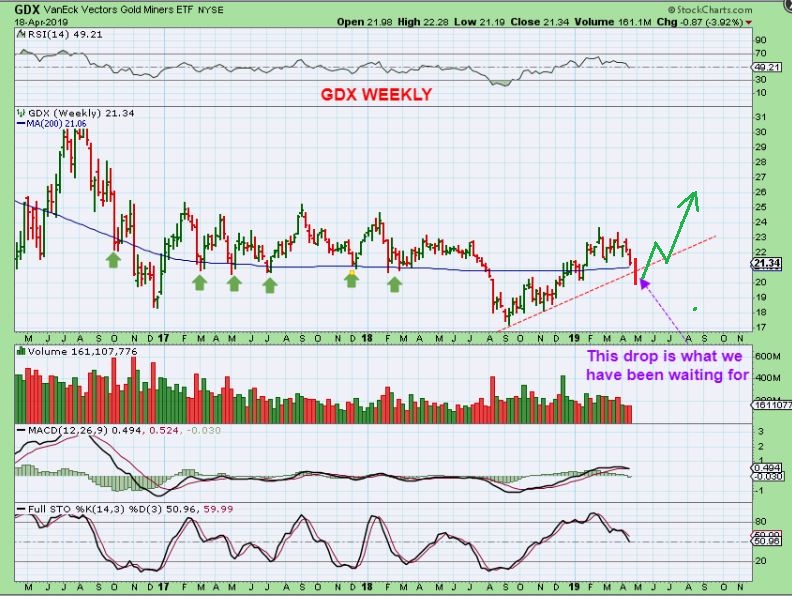
GDX WEEKLY #1 – We got our drop! Very nice. Now we can start looking for a reversal in the near future. Just like Gold & Silver, a quick drop next week would be perfect. I do want to point out on this chart ( Green arrows) that we have seen an undercut SEVERAL times in the past, so we should keep that in mind. It could happen again, it shakes out the bulls by running their stops.
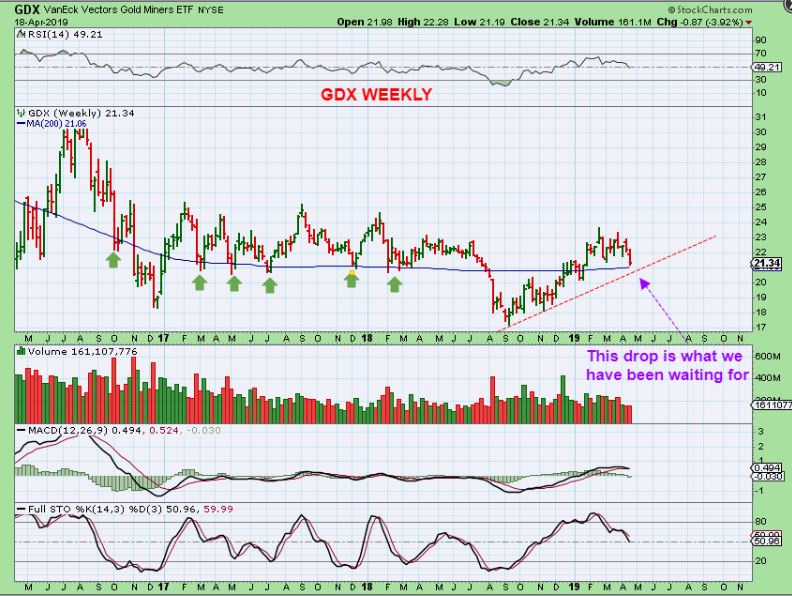
GDX WEEKLY #1 – A drop also breaks the trend line, which is what we usually see at an ICL. We should prepare ourselves for something like this, to match what we saw at the Green Arrows.
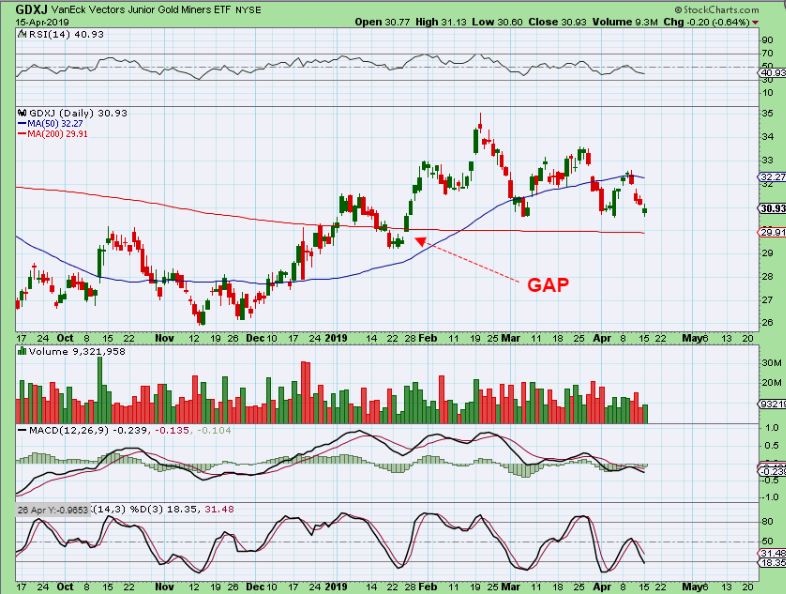
GDXJ DAILY APRIL 15 – GDXJ was expected to break below the 200sma, and fill that gap, so I pointed out that gap here. That would be near $29.50.
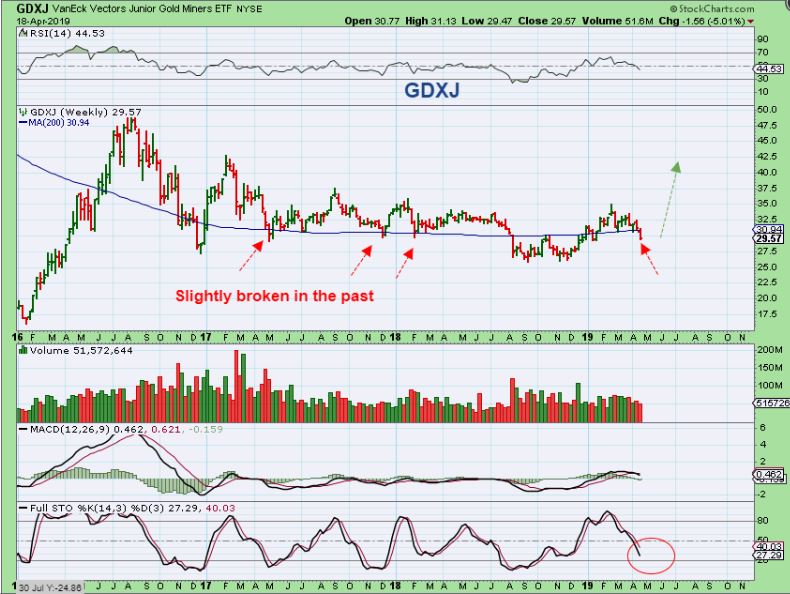
GDXJ WEEKLY – The weekly chart shows that we have reached that price point, so the gap on the daily has filled. Can it drop deeper? Yes, but this already looks similar to the prior breaks below the 200sma, so we’ll keep an eye on it.
.
The set up in Precious Metals almost looks too good to be true, right? It actually looks like another down week in Gold, Silver, and GDX would make perfect charts for a final drop and a reversal. It is set up in a way that this would be the perfect place for a move higher to start. I hate it when they look that good, because the markets are devious more often than not. USUALLY the markets will draw in the bulls and suddenly slam down and shake them out ( or stop them out) before the real run starts. Next week could really reveal a lot here!
That said, I am just going to do a quick review using the charts that I already had in this report, because it has become a very pretty picture. Using this review I would say that we are close to a reversal and what should be the start of a nice trending longer term move higher.
.
QUICK REVIEW –
.
Gold could drop for a shake out below the 200sma, and the timing is right for that drop.
The weekly chart for GOLD has price near long term support & Finally oversold.
Silver has formed a Bull Wedge that has been sitting on support for weeks .
Using GDX, We’ve been hoping for a final drop to support for the Miners, before a nice run higher…
We got that drop last week…
Yet another dip would be perfect to break that trend line too, and shake out more bulls.
.
It now appears that GOLD, SILVER, and The MINERS are in sync to put in a low together, and you may recall that that did not happen at all at the ICL in mid to late 2018. Gold had an ICL in August, Miners in November, and Silver broke to new lows in November. Next week may reveal a lot to us. I will continue to watch this area closely, since the time is right for a bull run to start here.
.
Enjoy your Weekend!
.
~ALEX
.
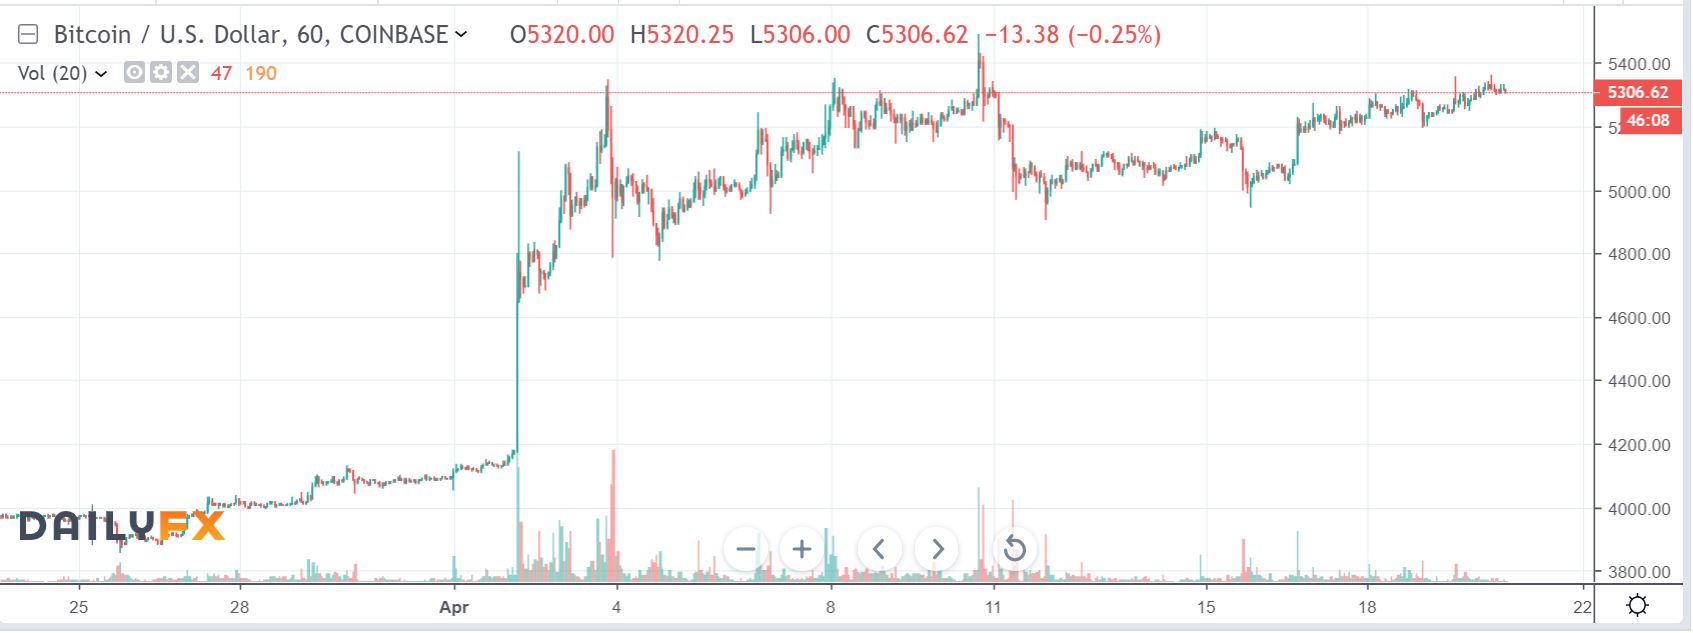
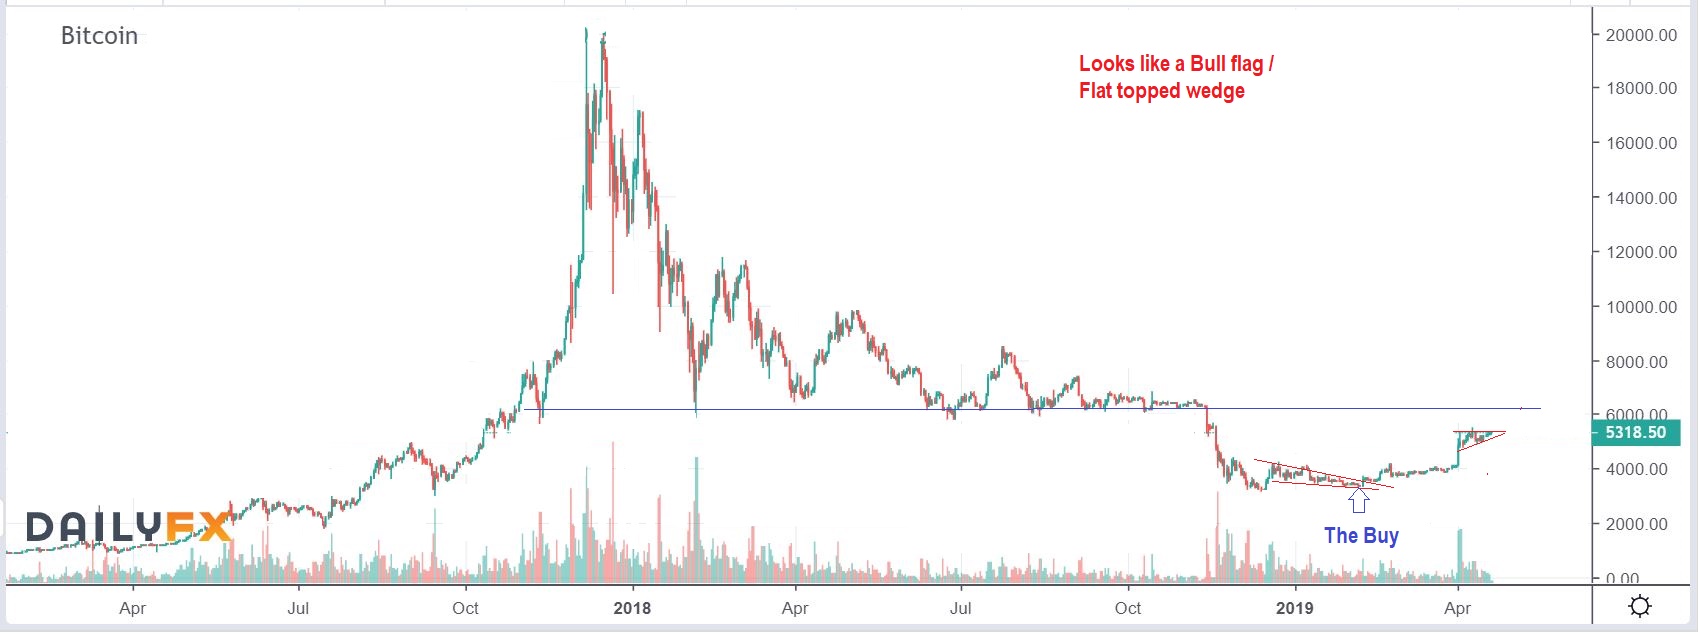
BITCOIN- Look how choppy this has been in the day to day action. Not an easy ride, but I have been saying that it remains bullish. Why? …
.
Despite some very choppy moves on a daily basis, this chart from Saturday remains Bullishly set up as a bull flag . I still own MARA, MGTI, HVBTC, and DIGAF. I sold my GBTC too early due to a gap (that never filled).
.
A BITCOIN MINERS STORY:
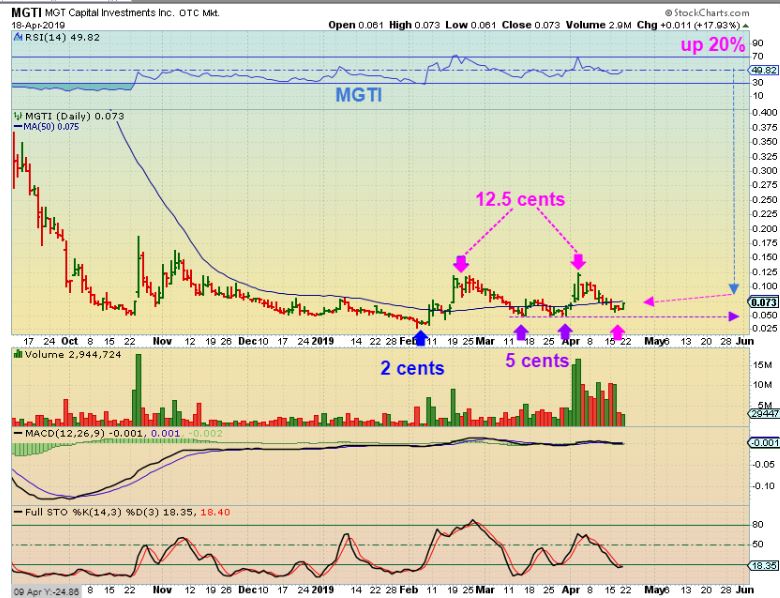
The story behind MGTI is very bullish if Bitcoin continues to rise. I read about them in 2017 & they had a very good set up at that time. It was a bullish story on Bitcoin, and back then I made good money on this company. It then dropped from $8 to $0.02. Wow! So MGTI was a very bullish story when Bitcoin was soaring, and they provided an update on March 20th. I still like what I read a lot, you may want to look it up. They still can make money with Bitcoin around $2000, and they actually Mine Bitcoin. When Bitcoin sold off, they put some Bitcoin Mining operations on hold, until it becomes more profitable to plug them in again, presumably somewhere above $3000. That update article that I read was written when Bitcoin was at my ‘Buy’ of just above $3000. Bitcoin is now holding at $5000 and I still expect $6000. I’m looking forward to the next MGTI update and see if they have taken advantage of the price of Bitcoin almost doubling since the Dec Lows.
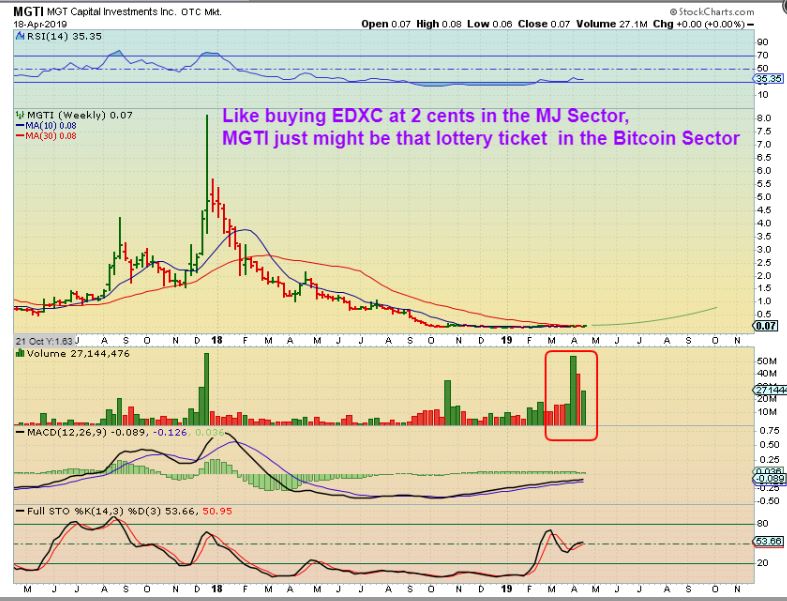
Just a side note or maybe a WARNING FOR MGTI: THIS IS NOT AN EASY RIDE. In 2019 alone, MGTI recently ran from 3 cents to 12 cents, then dropped back to 5 cents, and ran back to 12 cents. It just dropped to 6 cents again. THAT IS NOT AN EASY RIDE. That said, I Remember when I first bought EDXC 2 years ago at 2 cents. It went sideways in a base forever, running up and back down to 2 cents too. It was also bouncing around offering gains and taking them back. I got many complaints that EDXC wasn’t going anywhere, and why am I still holding it? My answer was that it was a longer term buy & hold & forget about it until later . I held it because of the story of their Phyto-Bytes- a CBD infused treat with benefits for Dogs that have pain from hip displacement or anxiety, etc. Dog owners in test trials reported that their dogs used to chew on the couch and knocks things over when they leave them alone due to separation anxiety, but Phytobytes helped keep the dogs relaxed and less anxious. I Bought EDXC because people will do anything to help their pets. I felt that it was just a matter of time before they benefit. It took a while, but that stock is running vertically.
Again, MGTI mines for Bitcoin successfully, and have been improving operations as they wait for Bitcoin to rise again. This looks like an easy base to ride, similar to what EDXC looked like, but it is not. Let me zoom in and show you what I mean.
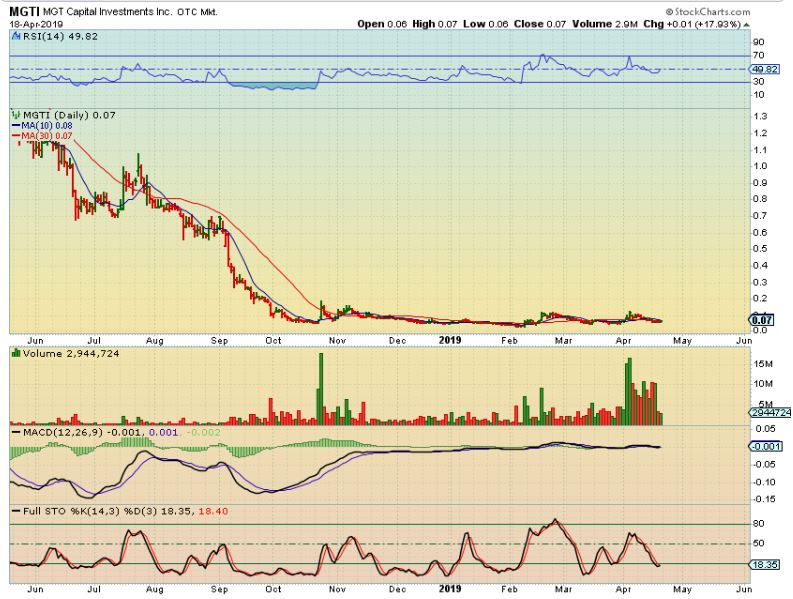
MGTI popped almost 20% at the close Thursday, but notice that this just dropped from 12 cents to 6 cents. NOT AN EASY RIDE, but as a long term buy & hold, I am going to see what happens to Bitcoin.