The Markets Building Blocks
Today is the FOMC Meeting , and even when the markets get a feel for what is going to take place, we often see periods of high volatility around the time of that decision, into the close, and possibly even into the next day. Let’s just discuss the current market set ups…
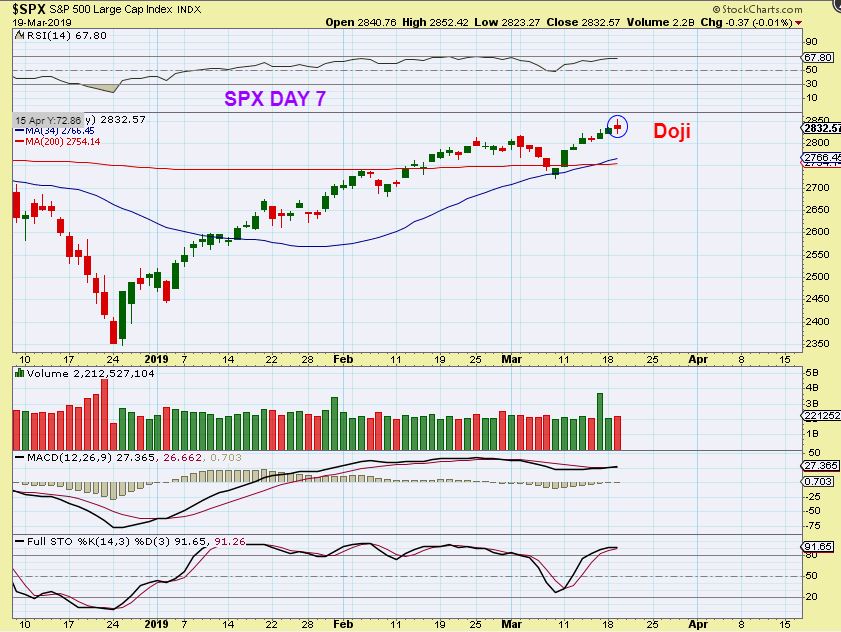
SPX – So the markets went higher and sold off again, closing Red on Tuesday with a DOJI candle ( indecision). As day 7, this would still be quite early in the daily cycle, since they can last 30-40+ days.
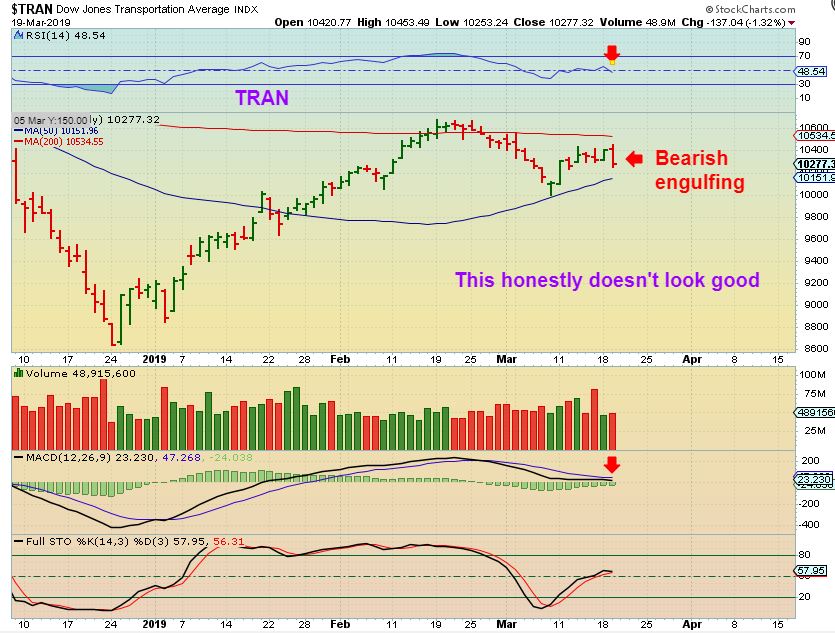
TRAN – This actually looks rather concerning now ( TNA is not much better), so let’s see what the FOMC does to these markets. This may just tag that 50sma again and flip higher after the FED MTG, but right now this is an ugly engulfing candle, and it could be forming a H&S. Todays movement after the mtg should help us out a lot. ‘Stops’ might too.
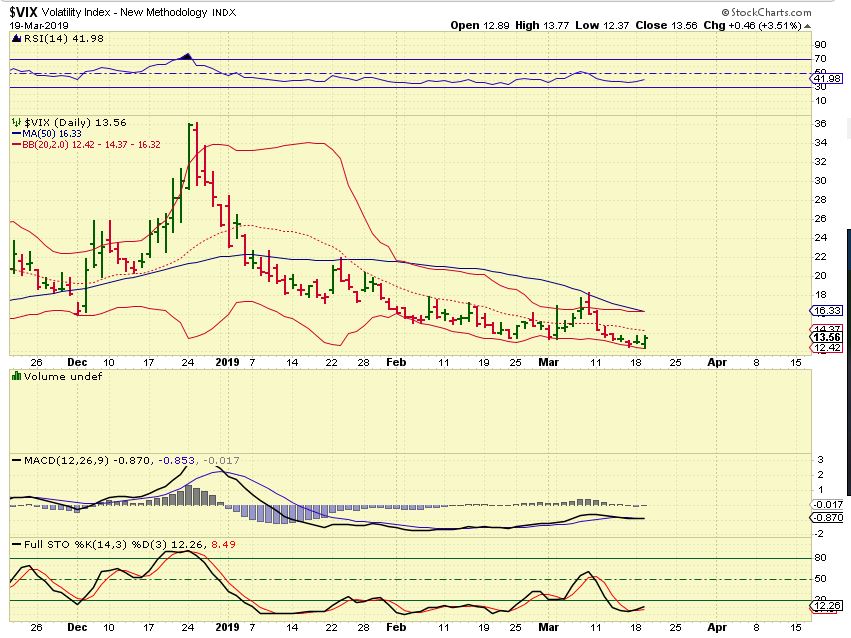
VIX – I pointed out that the VIX looked rather bullish, riding he lower B.B. and oversold. A POP in the vix usually drops the Markets, and the Vix does look like it at least wants to bounce.
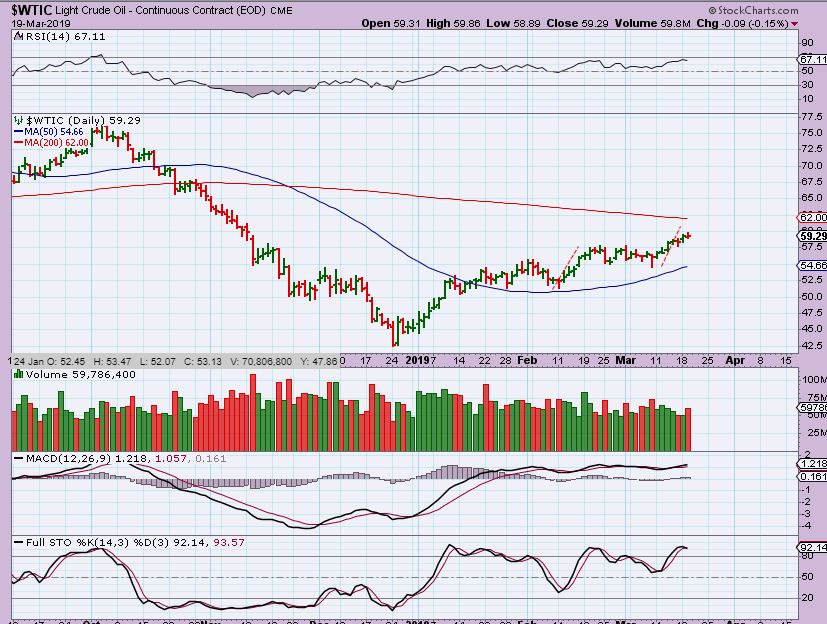
WTIC – Oil is getting overbought, but I really thought that it would tag that 200 sma, before pulling back. It still should, but no guarantees.
.
Precious Metals usually DO react to the FOMC Decision in one way or another. At times the initial reaction is not the real one, so it can take a day or so to see the real move take hold after the knee jerk reaction. That is why I am not long or short. We all know that I am expecting a drop into an ICL. All we can do is wait and see how the FED Decision affects this sector.
.
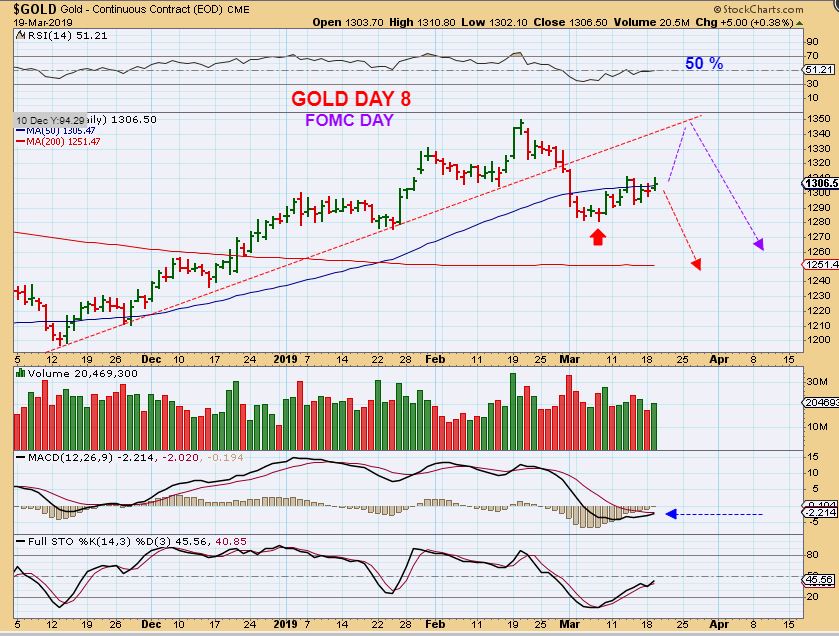
GOLD – A burst higher back testing the trend line isn’t out of the question, and it could still become left translated, even if it peaked on day 12 or so, but a sudden drop and start of the sell off would be easier to deal with. We would look for that buying opportunity.
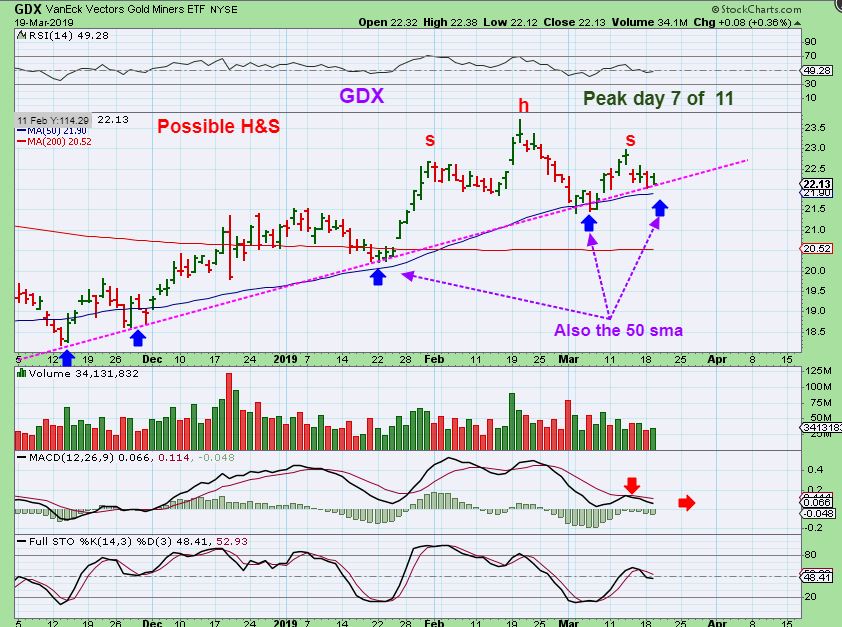
GDX – GDX is actually still above the 50sma and holding that trend line. It has a day 7 peak out of 11 days, but it has been unable to gain traction & move higher. The MACD has been weak. I am not long or short this sector. I have to expect a drop with this set up & Cycle timing.
I remain long several positions, but they are mainly Biotech and MJ stocks ( I do still own DQ also). I plan on being in front of my screen for most of the day, so I am using mental stops and physical stops. Let’s see what the day brings our way, and if possible, tune in to your trades at 2 p,m. Eastern Time for the Rate Hike decision. I have just a couple of things to discuss at the bottom of this report.
.
Happy Trading!
.
~ALEX
.
The Unexplainable Drop- CLF
.
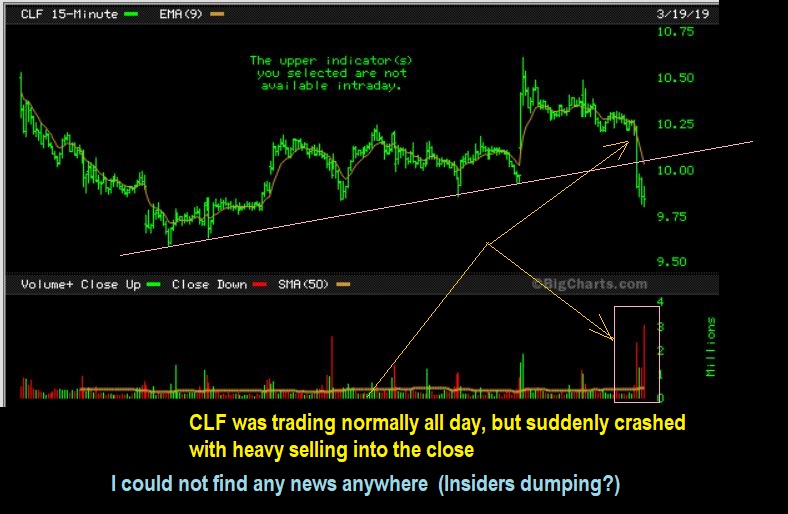
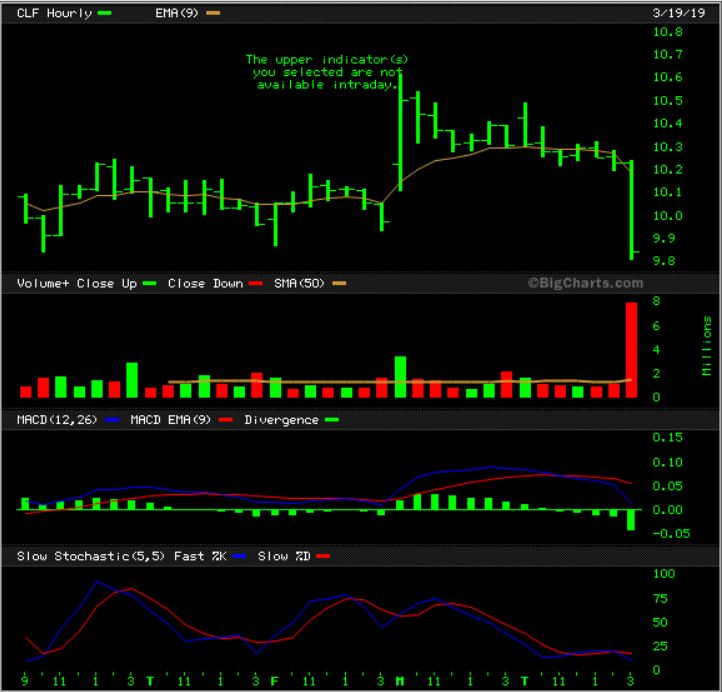
CLF – 10 DAY / 15 MINUTE CHART – Clf was trading all day Tuesday without any signs of distress, then suddenly it just spiked down in the last hour with volume. It sure does look like someone was unloading loads of stock. We discussed it in the live trading area (below each report) and I searched for ‘News’ or something to explain the sudden sell off. THERE WAS NOTHING public to explain it on any website that I looked at…
CLF DAILY – This is how the daily chart closed. All of that selling happened came in the final hour. I was asked , ” Would you have stopped out of CLF if you owned it”. My answer is “Not if I was away from my screen”. Having a loose stop under the 50sma and being away unable to see that move would not have stopped me out, but …
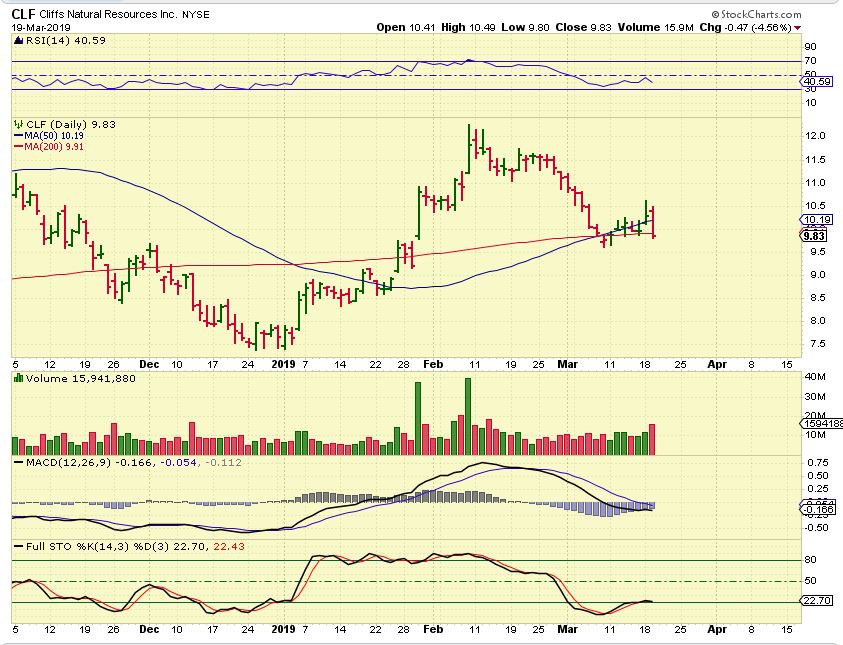
…if I WAS in front of the screen, I probably would have voluntarily sold it simply because I do not understand the selling. I don’t like odd surprises. This 5 day hourly chart shows me that 8 million shares got dumped in that final hour? I always think to myself, ” Does SOMEONE know something?” This makes no sense, and is not normal selling. They say that there is no ‘insider selling’ allowed, but if news comes out in a day or two, we’ll know that SOMEONE knew something before the public. We;ll see what happens Wednesday.
EDIT WEDNESDAY MORNING– I did not buy CLF, but that was a good set up above the 50sma. I hate those kind of surprises, and I still don’t see any news explaining that selling. Hopefully for any still in the stock, it reverses and continues higher.
.
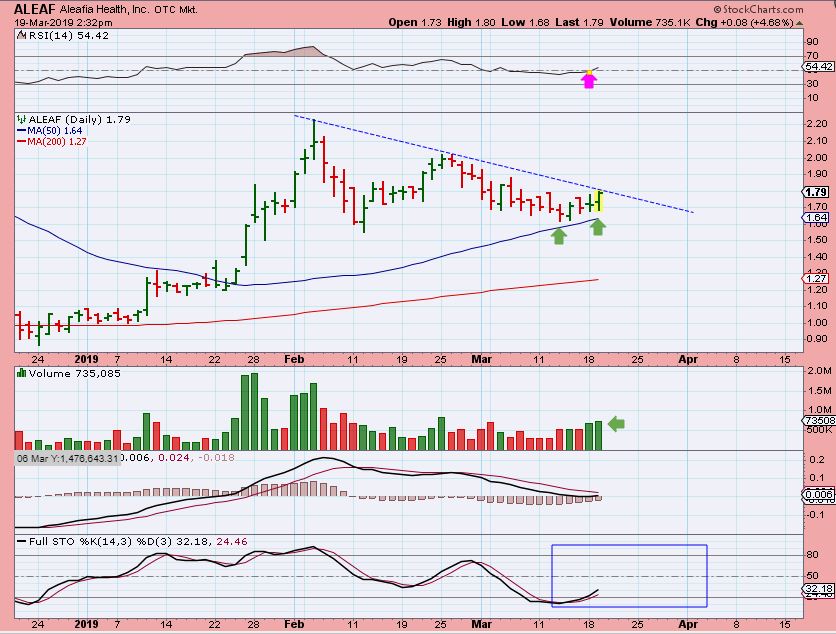
ALEAF – We traded ALEAF here at Chartfreak from the 200 sma at $1.00 to over $2 and after a nice sideways consolidation to the 50sma, it looks set to break out & run again. ED mentioned the volume building in the comments early Tuesday ( Thanks ED!), so I bought it and I do recommend it. A break above this blue down trend line is Bullish.
.
I’m going to discuss this trade that I took ‘spur of the moment’ for the purpose of a possible watch list entry for those interested. You will see why as this explanation continues…
.
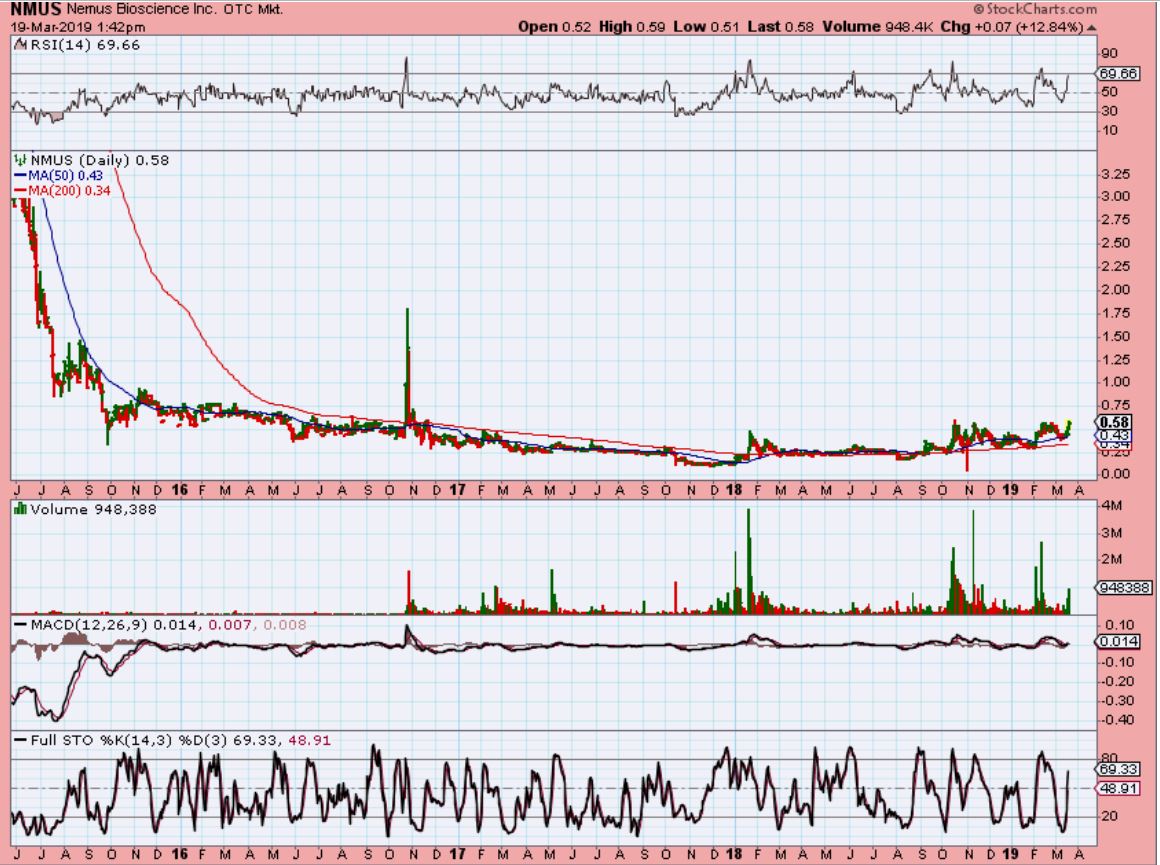
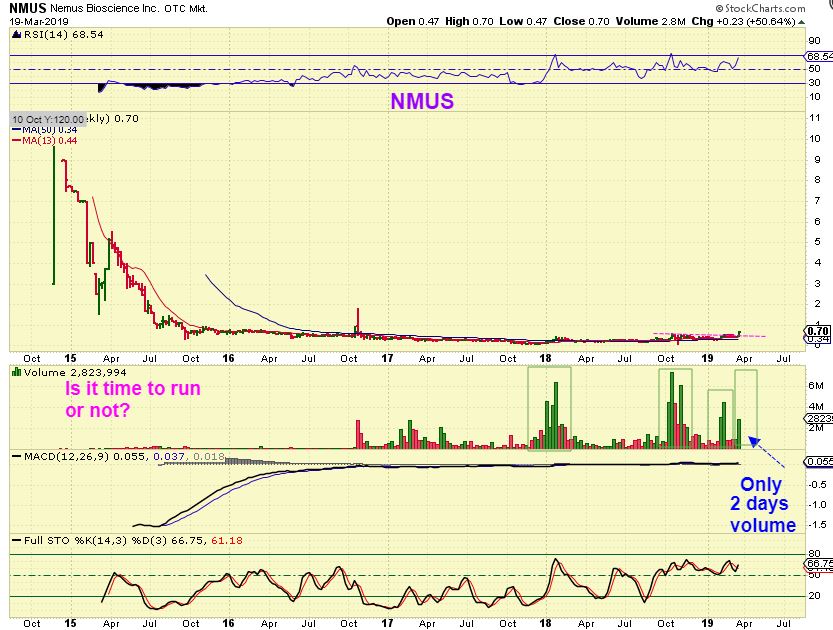
NMUS DAILY – I’m always watching various stocks and yesterday I was watching this MJ Stock – NMUS. It was slowly climbing Monday & POPPED Tuesday at 55 cents. Then it went sideways and suddenly it popped again with solid volume at 55 cents. I already looked at the Big picture and short term charts and just jumped in, because this is one of those BIG LONG FLAT BASES that I love to see popping with volume. I mentioned it in the comments, but couldn’t comfortably recommend it , since it was up 10% at that time already. I grabbed this chart. Also…
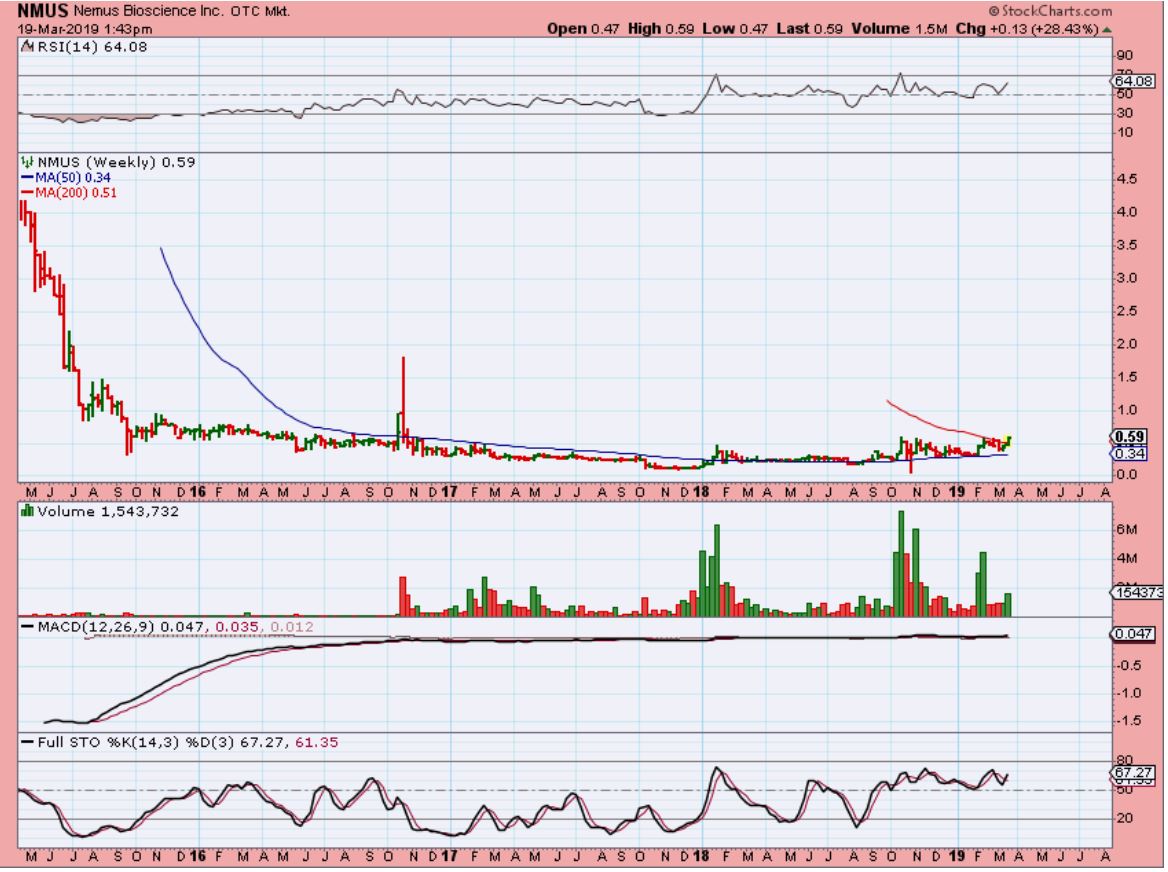
NMUS WEEKLY – I checked the weekly and it is breaking the weekly 200 ma and riding along the 50sma. So I grabbed these charts too, to point it out in case it pulls back later, you can put this on your watch list if you are interested. Let me remind you why I LOVE these LONG FLAT BASES with Volume spikes …
EDXC & THE LONG BASE – If you have been here for a while, then you know that I rode this for 2 years, and it paid off in spades. This long flat base is in the same sector (MJ), and though it had many false starts along the way, the high volume spikes are often a sign of whats to come. So…
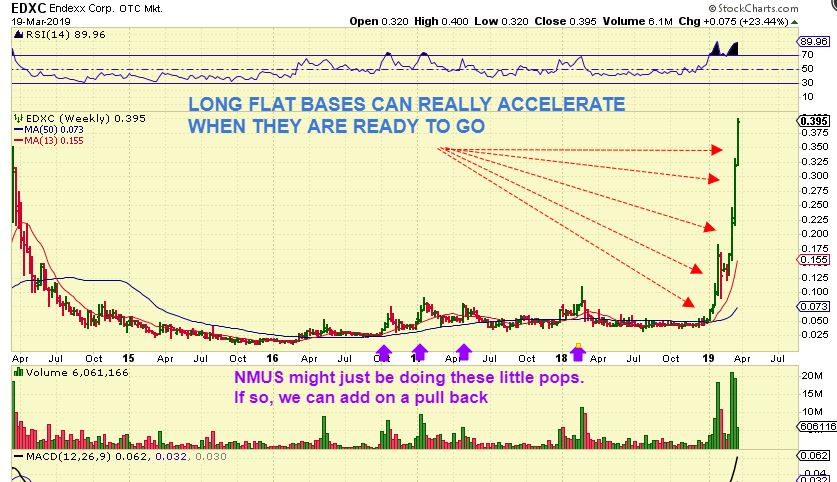
The question is: Is NMUS at that stage where it is ready to run now or is it just doing the pre-run Pops every few months? It actually closed at 70 cents, but only Time will tell. The sector is bullish and if it begins to run higher, we can add or enter on the next pull back. If it dips back into the base? I rode EDXC for 2 years, maybe I’ll try that again with NMUS . =)
.
FINALLY…
.
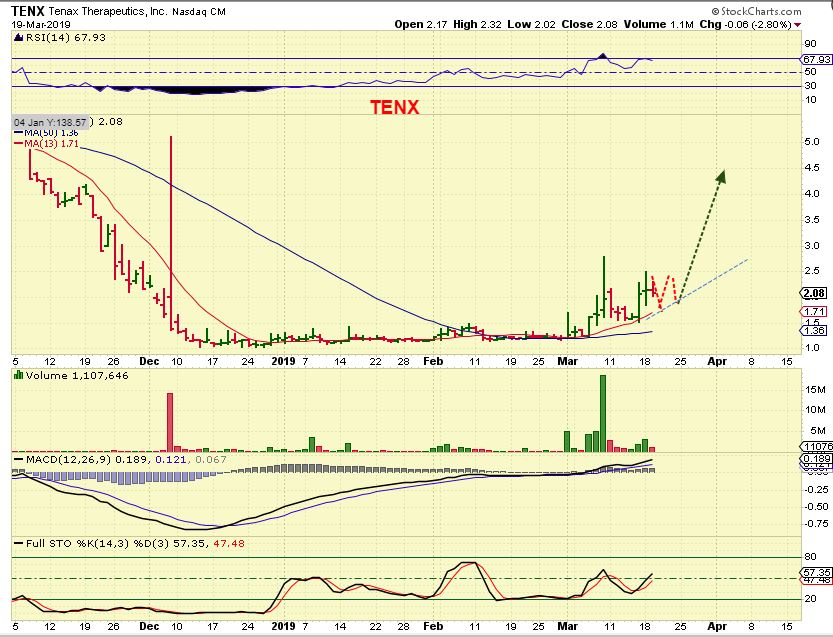
TENX #1 – This midday volume looked a bit weak to me, so I decided to lock in gains and see what happens. These were very big moves daily, so these were also very good gains. Buying near the 50sma would make that a 100% move already! Now I’ll wait & see if it pulls back for me to re-enter later.
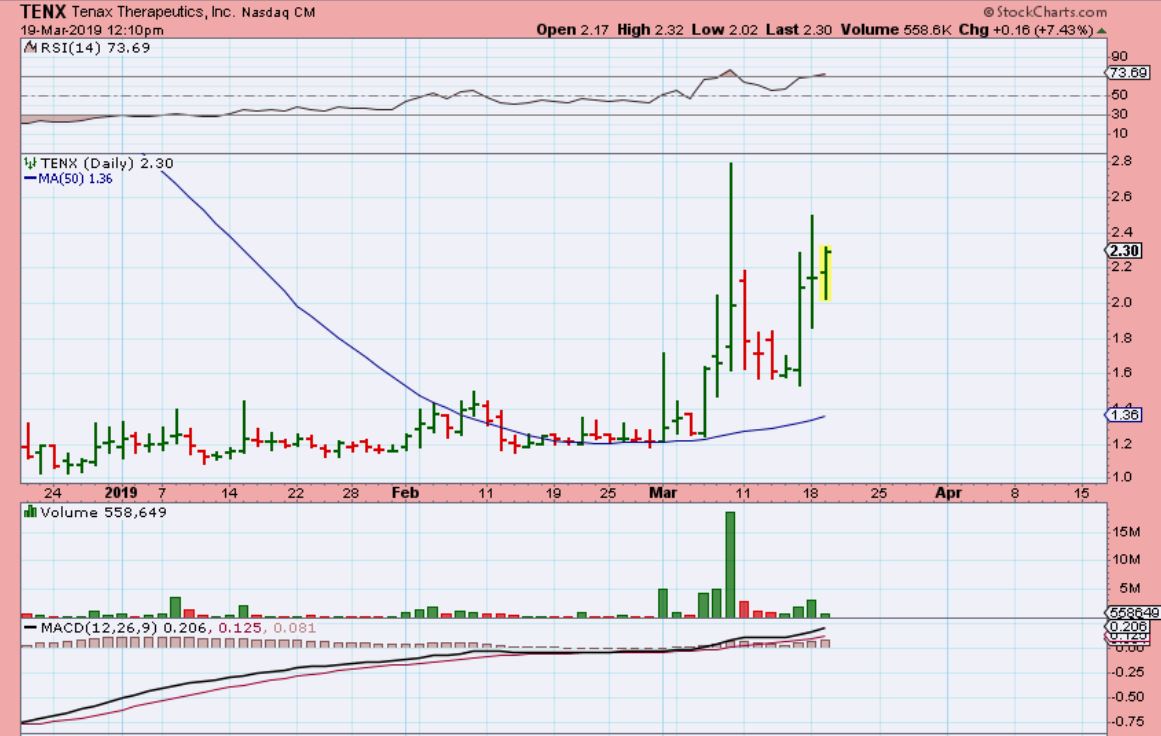
TENX #2 – A bull flag or sideways consolidation may make it hard for me to know when to get back in.