March 26th – What Time Is It?
Today I want to discuss the Precious Metals in more detail. This weekends report covered it extensively, but I think that a part 2 would be helpful too, so this report is going to be mainly be focusing on the Precious Metals Timing.
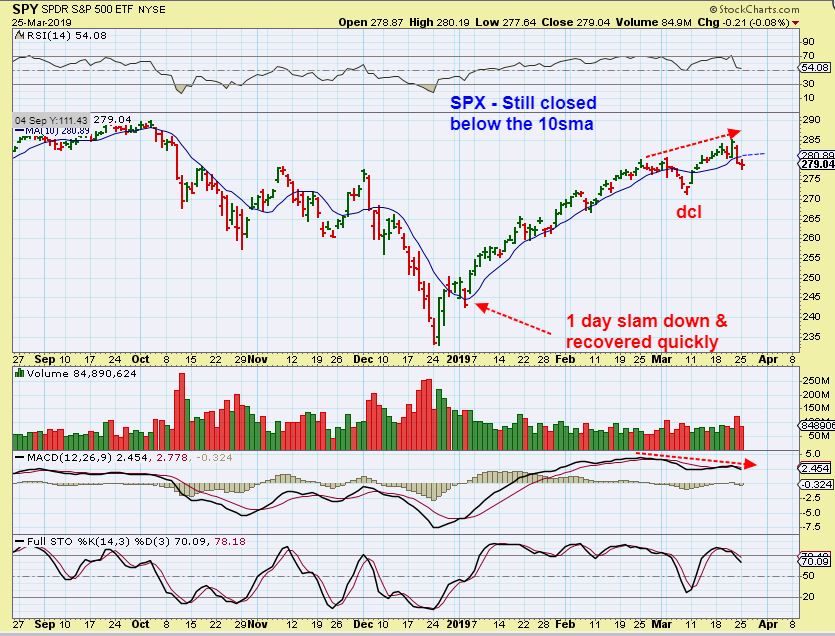
SPX – I will just mention that there was no change from the weekend report. SPX closed below the 10sma 2 days in a row now. A Doji Formed and that can lead to a reversal ( short term or longer term remains to be seen). .
Now let’s get right into the precious metals. The weekend report discussed the bullishness in this sector, and the ‘Timing’ of the intermediate Cycle. We can start to drop into an ICL at any time, but I also want to show you an alternative idea for a more bullish move, based on History.
.
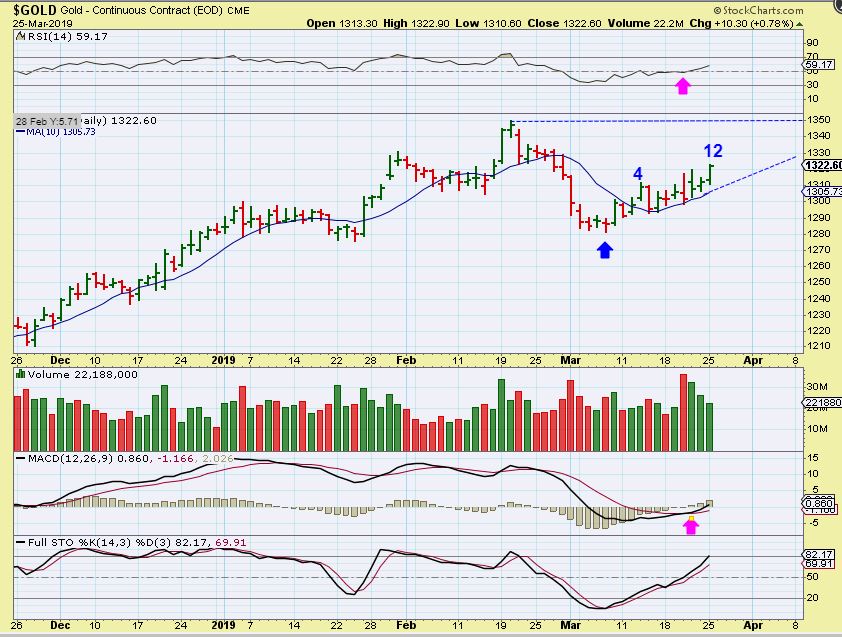
GOLD – On Monday we saw Gold rise to a new ‘peak’ on day 12. Since the Miners bottomed a few days prior to Gold, they actually peaked even later in the daily cycle. This late in an Intermediate Cycle, strength like that is rare. I noticed the strength last week, so in the weekend report I discussed it. Did we start a new Intermediate Cycle and leave behind a mild drop into ICL? That does NOT look like an ICL drop in February to March, but it could be, so in this report I am going to dig deeper.
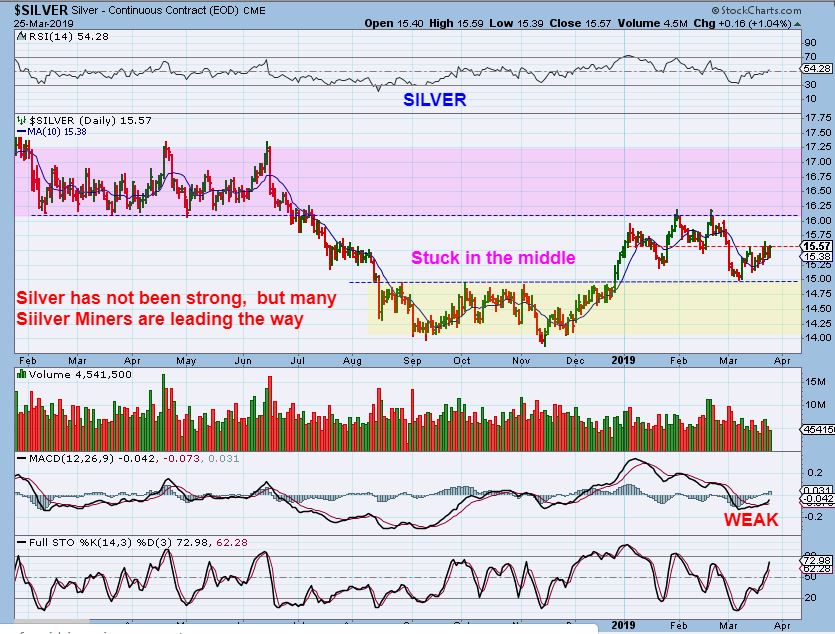
SILVER – Since Gold is trying to push higher, I would say that Silver may run back to the top of this space that it is trapped in. Silver is between upper resistance and the support of the recent base. The MACD is weak, I don’t really expect a break out yet.
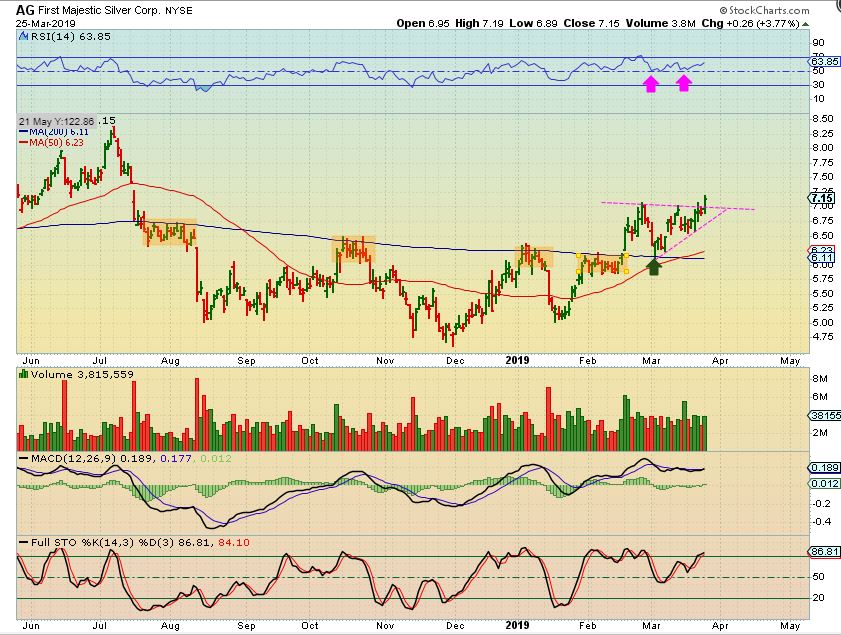
GDX – The RSI actually looks good here, but the divergence with the MACD as price gets to recent Feb highs tells me that momentum is waning. A new ‘Peak’ on day 15 does start raising questions for those following cycle analysis though. Questions like…
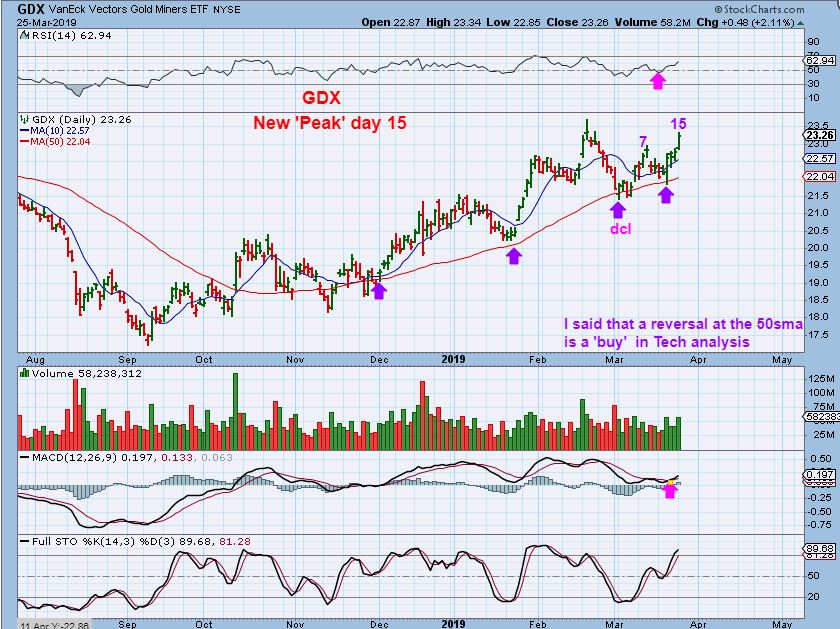
– Don’t we need a Left Translated Daily Cycle to drop into an ICL? Day 15 seems strong.
– Was that a deep enough sell off to be considered an ICL, or is the ICL ahead?
– Shouldn’t we see a trend line break into an ICL?
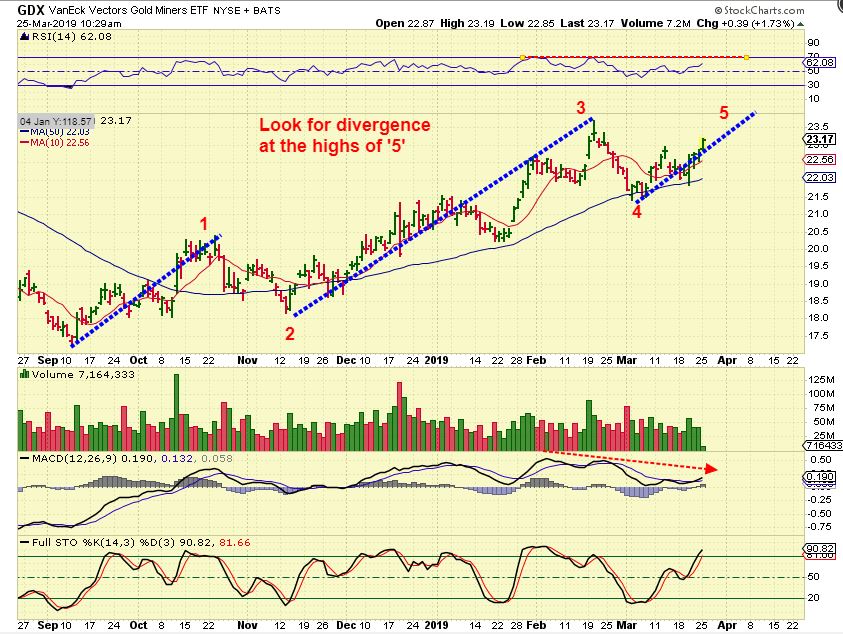
I will discuss these things shortly, but first lets address that MACD Divergence at the highs. It could be explained this way…
.
GDX – If this completes 1-2-3-4-5 with divergence, then the divergence simply plays out as a top soon and an a-b-c correction should follow ( The real ICL). GDX bottomed in September, so this is month 6 for Miners.
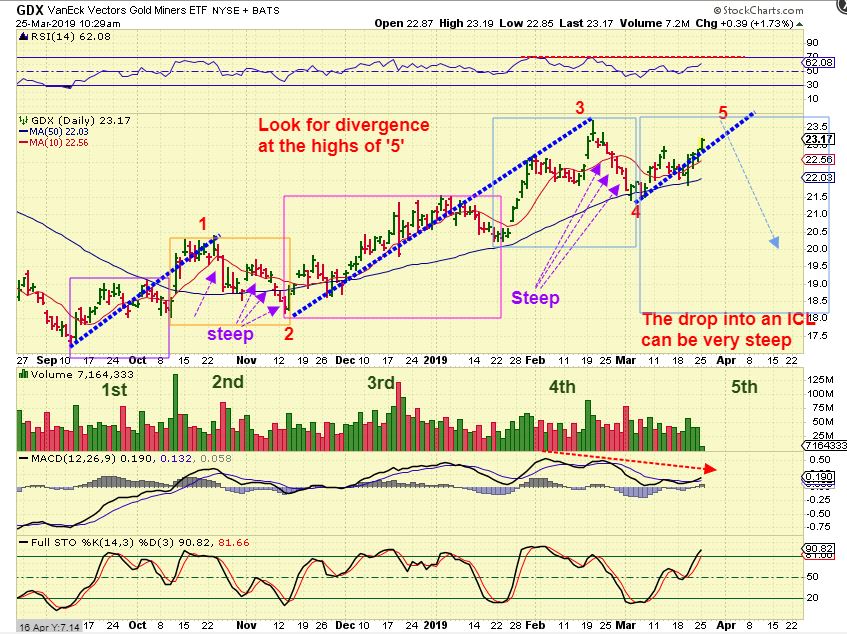
GDX – A drop to an ICL from here could be sharp and steep. Look at how quick ‘1’ to ‘2’ was, or ‘3’ to ‘4’, so an ICL drop from here can still take place and it can be quick yet deep in this 5th daily cycle. a-b-c similar to that drop from ‘1’ to ‘2’ would be my guess.
.
In the weekend report, I addressed the idea that:
1. Gold is heading to the top of the big picture base, nearing a break out point.
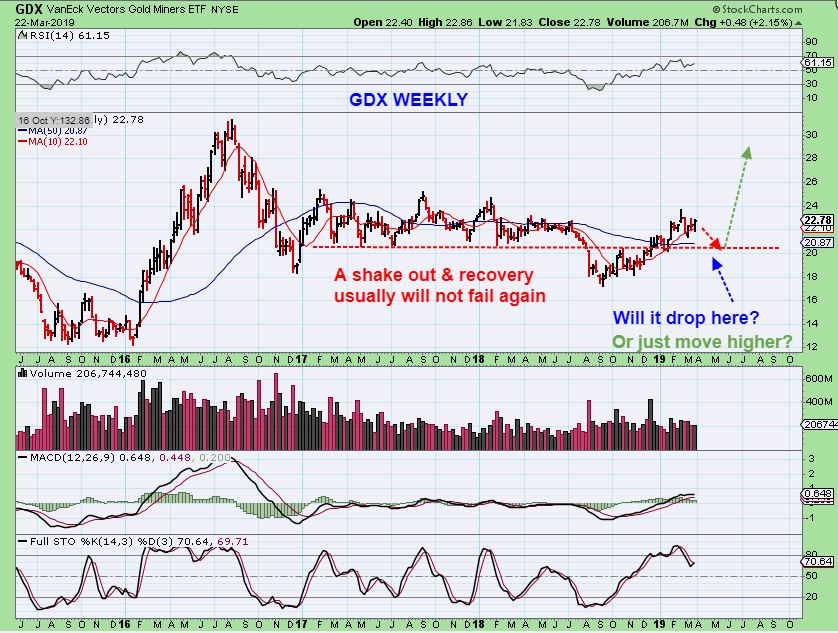
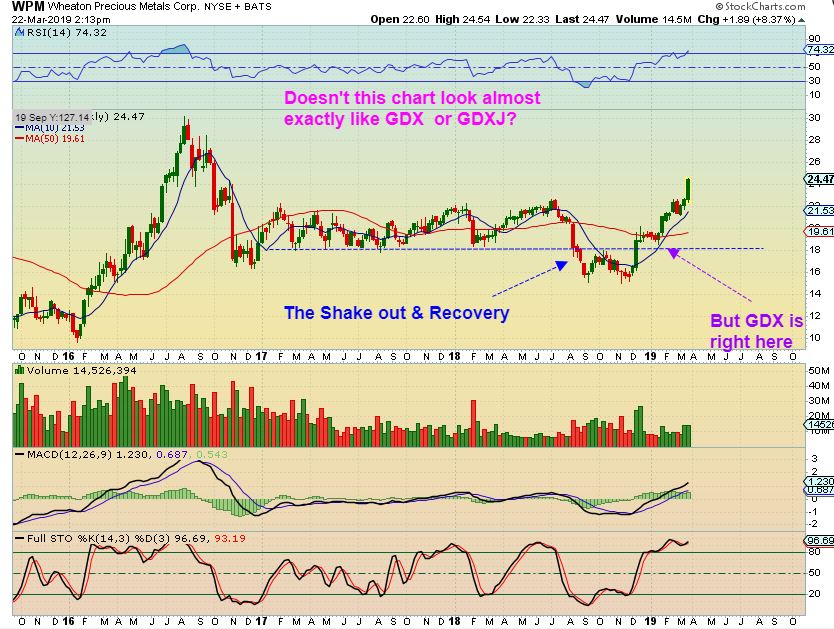
2. GDX already broke down and recovered ( shake out) and they usually do not break down again,
3. So “Can this sector just break out higher, possibly with a mild ICL behind us? Or do we need to drop further?”
The answer is that either possibility is still on the table. I want us to be ready for either one. At this point, I probably need to answer questions raised by saying that it could just turn into a break out and runaway higher. Questions about cycle counts and cycle related issues.
Let’s look at some charts that I found interesting and revealing.
.
#1 – THE GOLD BULL RUN STARTING IN 2001 – 2005 : When I went back using a weekly chart and looked at ICLs, I was surprised to see that MANY ICLs were actually stretching out to 8-9 months apart in a Bull market. Back in 2001-2005, I focused on pure technical analysis, not cycles. Maybe people got used to the more recent 6 month sharp accelerated drops of the ‘bear market’ into an ICL, that they overlooked that in a BULL MARKET these can easily stretch out? On this chart I see intermediate cycles to 8 months on average. And…
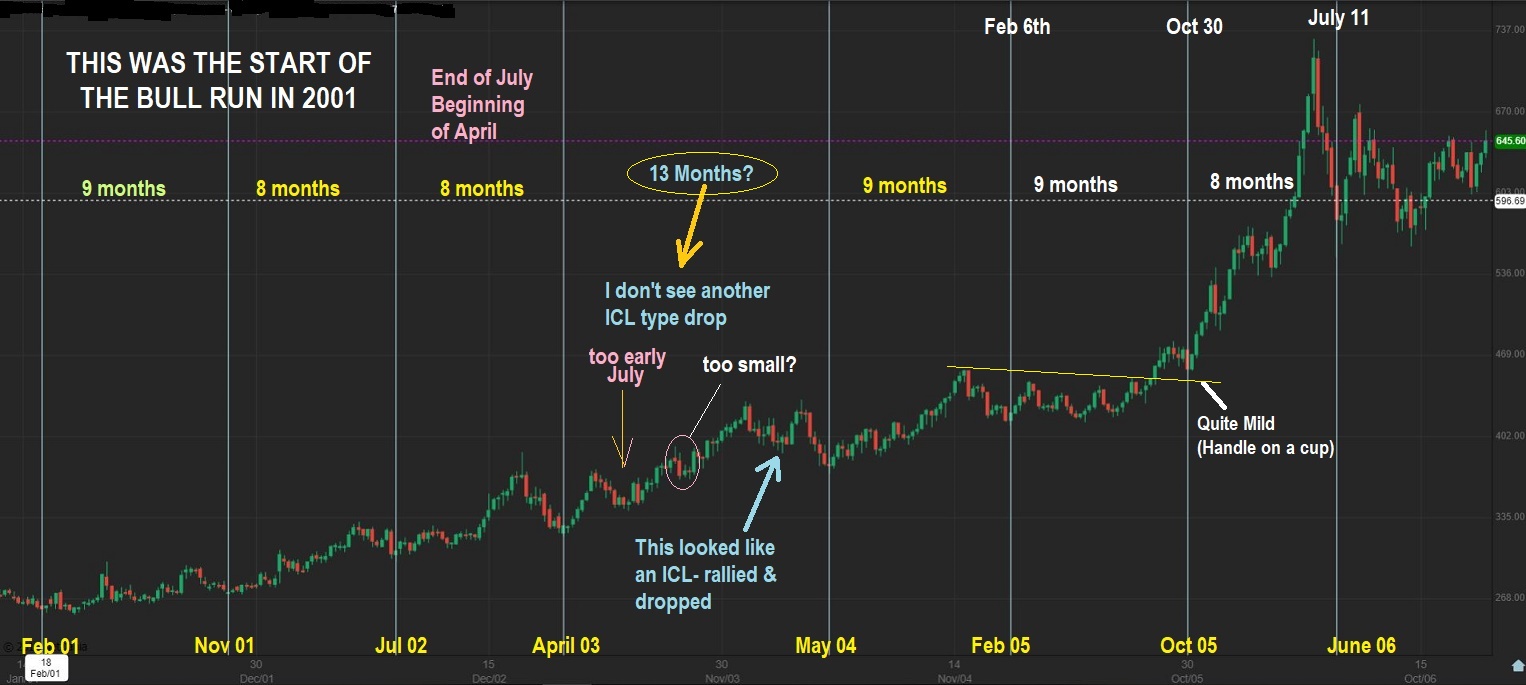
#2 – Do I also see one 13 Months apart ? That’s over a year from ICL to ICL, with no real ICL dip? Let me ask you : From April 2003 to May 2004, do you see a DEEP ICL -LIKE DIP? If not, could that happen now? I will just say that a break out and runaway move is possible now too. See the chart, there was no big dip for about a year.
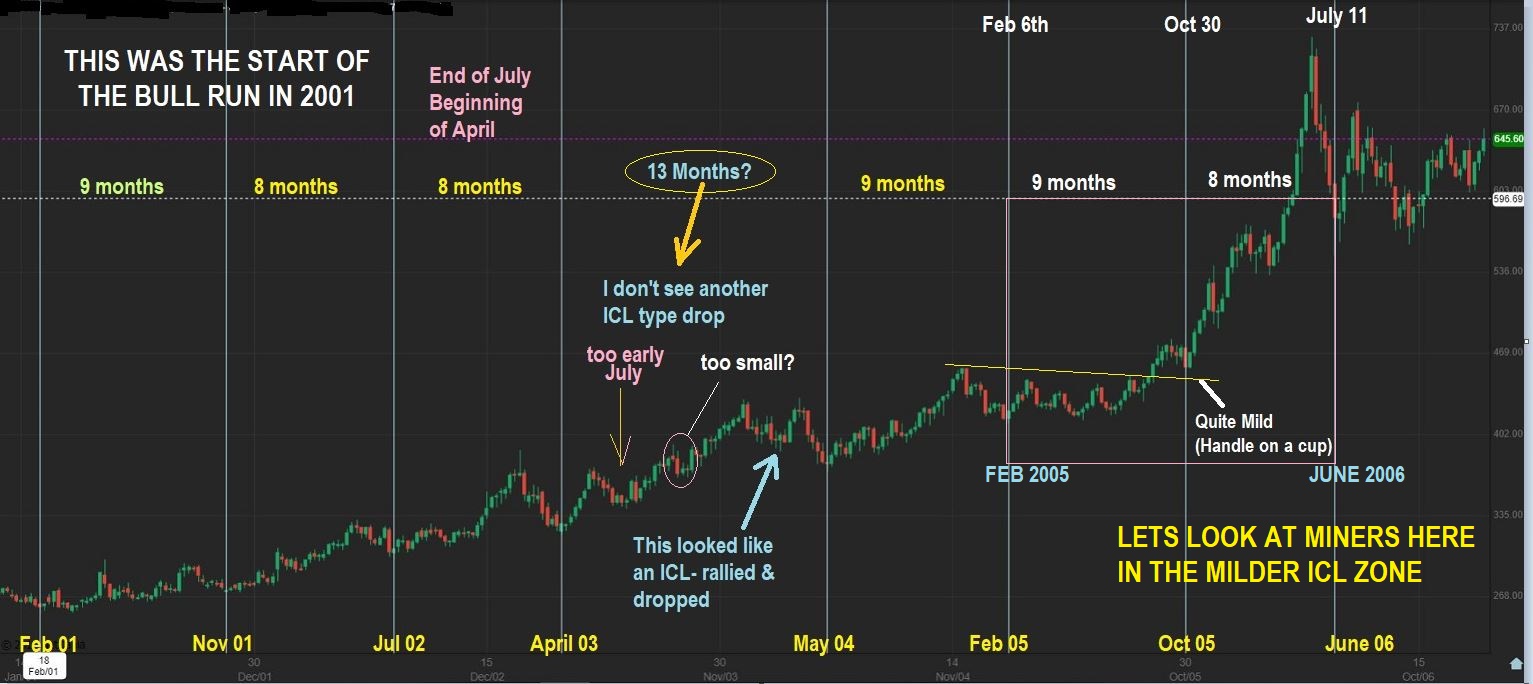
#3 – Look at Feb 2005 to Oct 2005, and notice how mild THAT Oct 2005 ICL was. If that isn’t an ICL, then we only had 1 ICL from Feb 2005 to June 2006 too. If it is a mild ICL , notice that it was followed by price going straight up. So that affects how I view Cycles too. Either we saw no ICL for a year again, or it was very bullish & mild.
.
Since GDX was not around back then, let’s look at that time period of October 2005 ICL using the HUI.
.
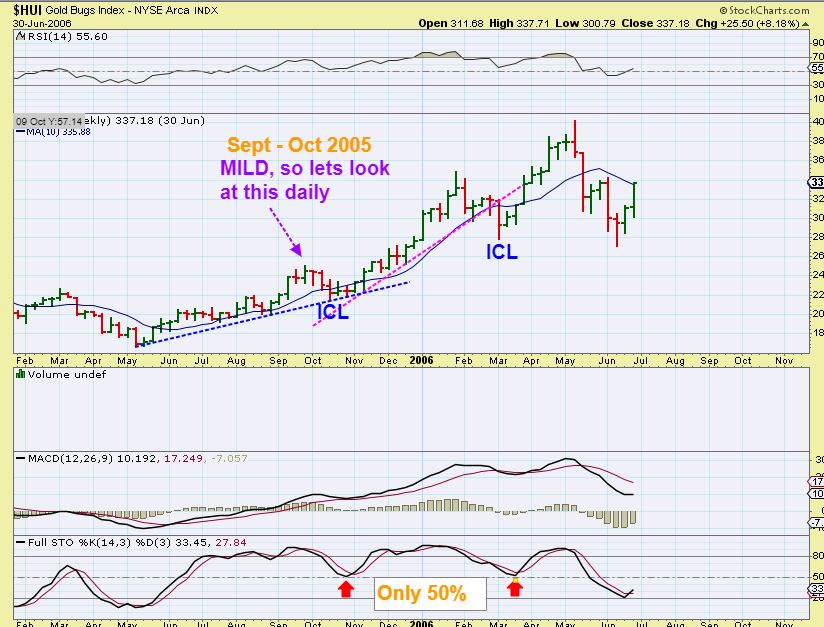
HUI WEEKLY – The dip in October 2005 was pretty Mild. Notice that THE MINERS DID NOT BREAK THAT BLUE TREND LINE IN OCTOBER. They did not break the recent trend line either. The stochastics didn’t reach the lows either. So think about this-
1. Did we have an ICL in October that didn’t break the trend line? Or…
2. Did we have no ICL from May 2005 to March 2006?
Either way, what if that same thing happens right now? If I see it back then, it can happen now, and I like to be mentally prepared. Many Miners are acting very bullishly, so a Mild ICL could happen. This is why I use cycles a a guide, but I’m not overly stuck on ‘rules’ that may cause me to miss a Bullish move.
HUI – Now take a look at the trend line from that May 2005 ICL onward here. The run became rather steep in 2006 and that trend line was not broken for over a year! I would say that at times of extreme bullishness or bearishness, there can be exceptions to the rules. Stay Frosty and be mentally ready for whatever comes your way.
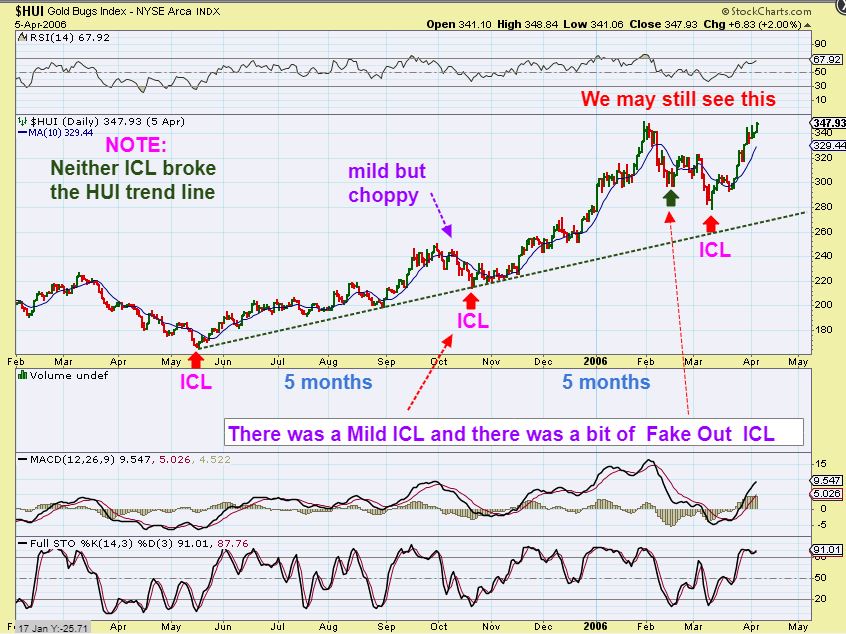
HUI – Notice also that Miners really held up at or around the 50sma for that portion of the Bull Run too.
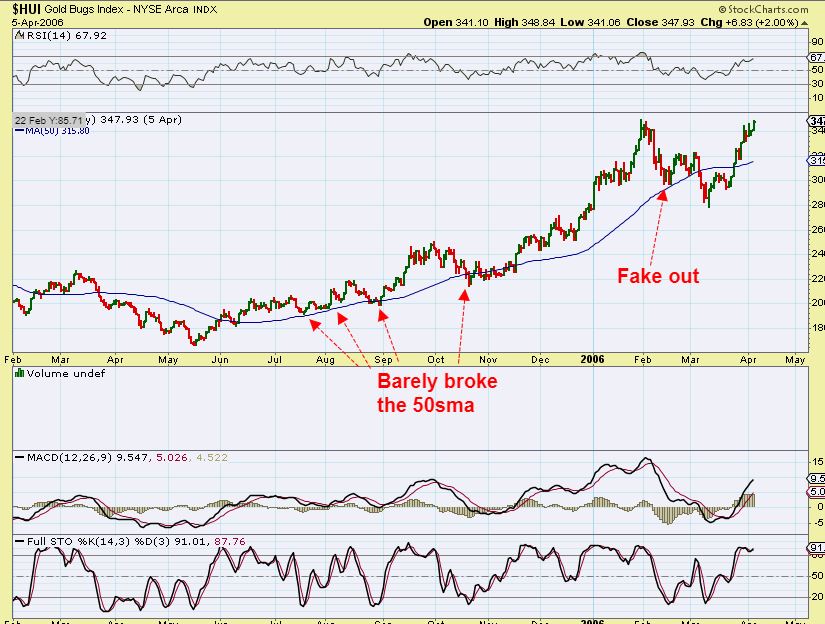
That is similar to what I am seeing now, but apparently we don’t have to shatter the 50 sma and panic people into an ICL.
.
Here is another one for the CYCLE enthusiasts too, about ‘rules’ and ‘exceptions to the rules’.
.
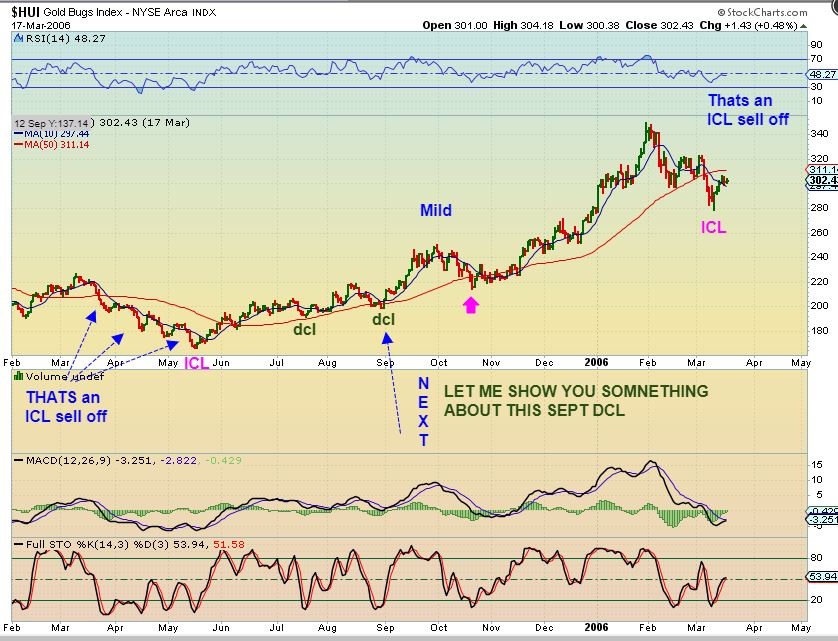
HUI – Let’s look again at 2005-2006 HUI.
1. I’m pointing out 2 ICL sell offs that are what we would normally expect. The first and last sell off into the ICL is the kind that make people hate the miners.
2. Then in the middle of this chart is that one Mild one to the 50 sma.
3. I’m also pointing out a September daily cycle low, and we will zoom in on that.
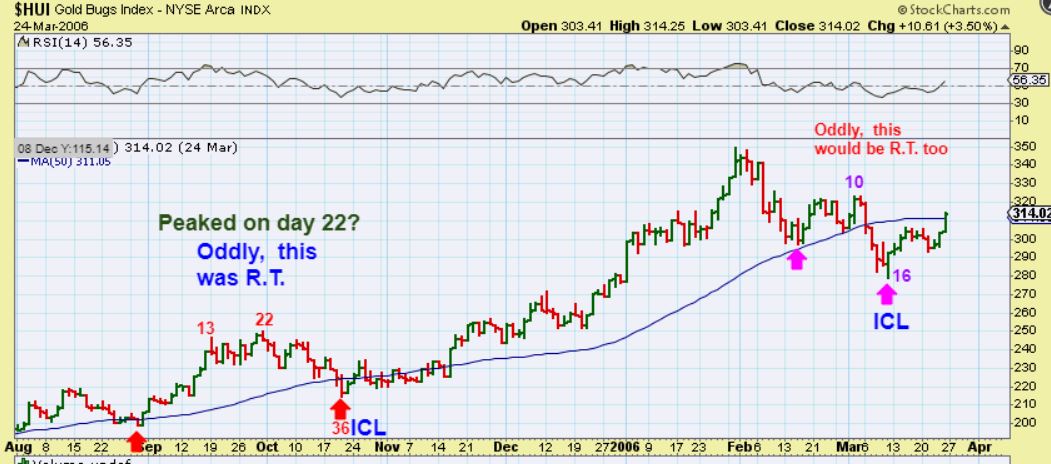
HUI – That September DCL into the ICL was a RIGHT TRANSLATED DAILY CYCLE. It peaked on day 22, and bottomed on day 36. Some might say that it wasn’t an ICL, simply because it was following a R.T. Daily. If that is the case, then we didn’t get an ICL from May 2005 to March 2006. Again, this shows me that there ARE exceptions to these ‘cycle rules’, and we need to just be ready for anything. No ICL for a year? Or a R.T. Daily into a MILD ICL at the 50sma . Either is possible.
.
I will always use Cycle timing as a guide, because it is really Very helpful and reliable. The point that I am making here is that my analysis consists of Analyzing everything, and I use a number of different techniques. I trade according to what is in front of me, and not always with what I should be expecting, as long as I use a stop to protect myself.
Recently I have mentioned Bullish set ups in Miners or even with GDX and I have made a statement like, “A reversal at the 50sma is a BUY in technical analysis, just be sure to use a stop.” Some have questioned that that goes against cycle timing, based on what they know, and missed some trades. This weekends report and todays follow up report can help. Now you can see more of what has happened in the past, and that there have been exceptions to the rules. There have been times when things were set up in such a bullish manner, like that milder ICL in October 2005, that analysis using just one method or technique may have left people behind right before a steep ramp higher. In the bull run of 2001- 2005, Cycles also stretched from ICL to ICL at 8 or 9 months.
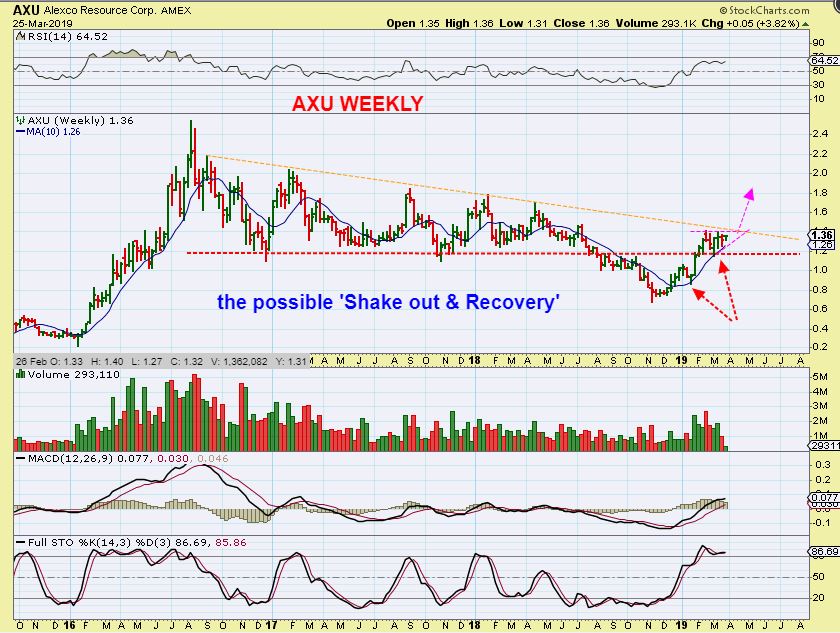
Gold is currently set up to break from a large base. It can pull back into an ICL to shake off the bulls before launching higher, or it may just creep upward from this recent dip in March and run away. Let me show you what I posted in the weekend report again. I said…
‘
This is a shake out & recovery and they usually do not break down again. Our recent dip did not break the trend line and barley broke the 50sma, but does it have to? No. A nice drop to an ICL as shown in red would be great and it may happen, but be ready to buy if this takes off higher, because…
WPM looks just like GDX, but it is a few weeks ahead of it.
.
My analysis consists of various observations, and leads me to conclude that even though we are due timing wise for an ICL, it can be mild under the right bullish conditions. The current action in Miners has been bullish. For months I have been pointing out Individual Bullish Miners using technical analysis, and as this cycle moves forward, others keep appearing when things should be weakening. Can GDX still drop to an ICL? Absolutely, but if the recent 2-3 week pull back leads to a slow steady grind higher, we may have a Milder dip in place. I want to continue to be ready mentally to find an entry in individual Miners when I point them out. Below I will have a few trade ideas, and some of them will be Miners, even though we are 7 Months ahead of the last ICL. We just use Stops at lower risk entries at times like this.
.
Enjoy your Tuesday trading!
.
~ALEX
.
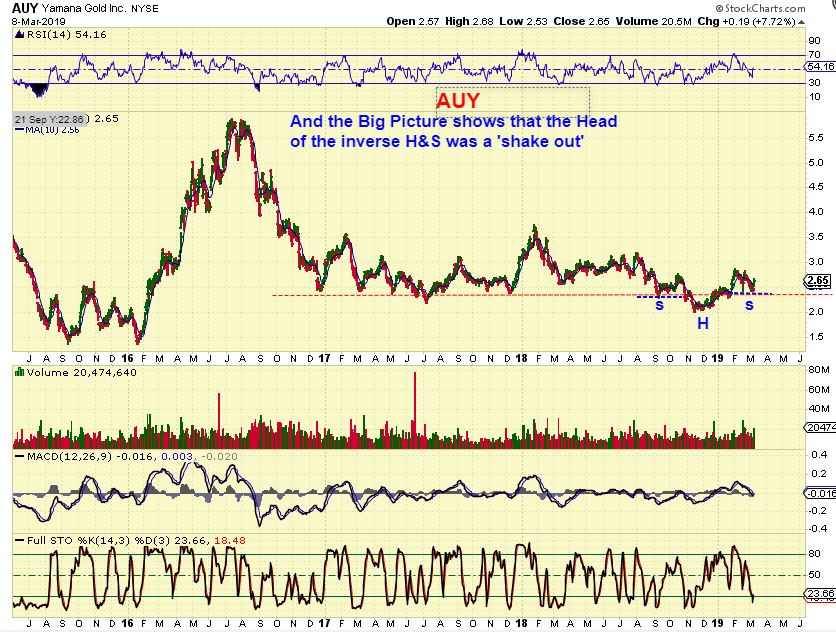
AUY #1 – On March 8th I was seeing bullishness in many Miners, I pointed out the shake out in AUY as a support line.
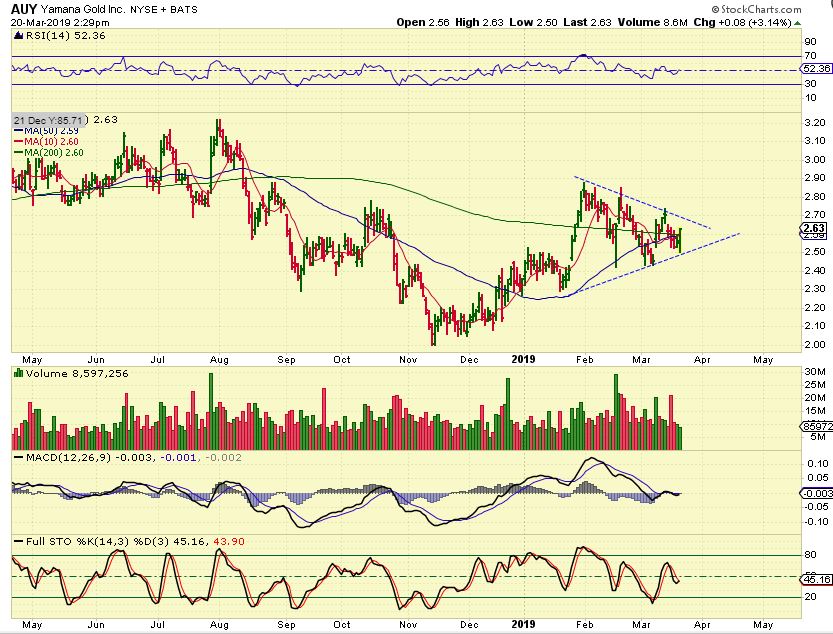
AUY #2 – Last week I again highlighted ‘triangles’ now forming in Miners that looked Bullish. I said that they could be bought with tight stops.
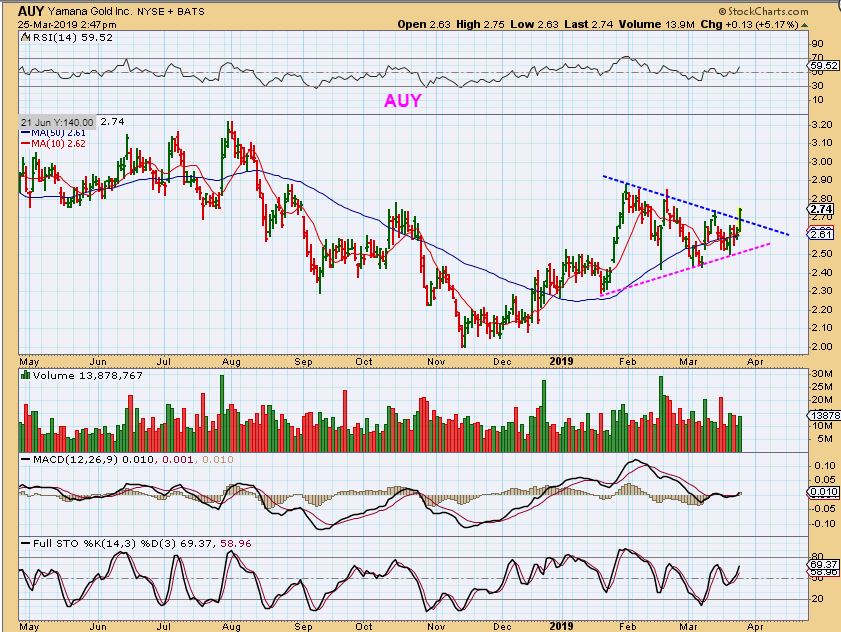
AUY #3 – We saw a break out Monday , so again, we are 7 Months from the GOLD AUG ICL, but Miners continue to look and act bullishly. We’ll see how these play out- just use stops.
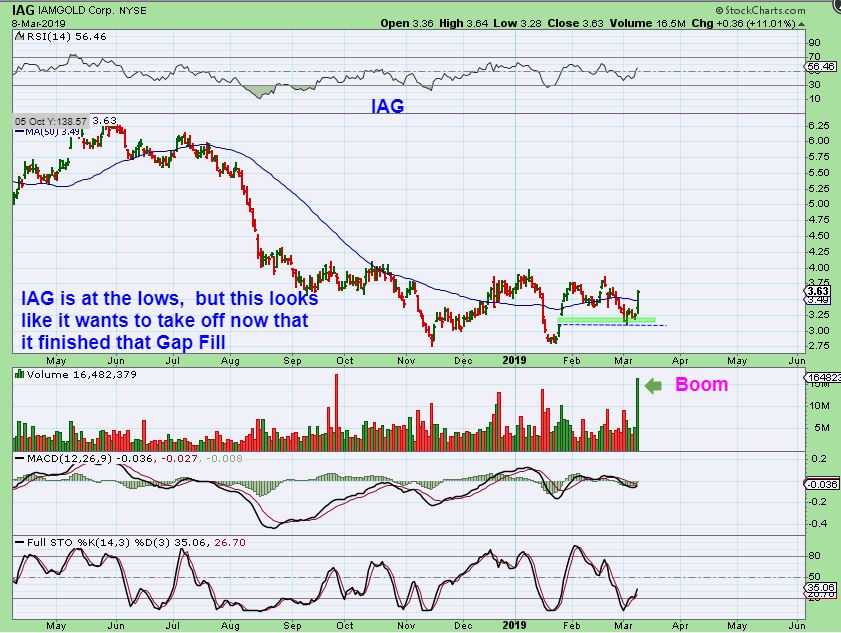
IAG #1 – March 9 , I pointed out a gap fill and strong reversal ‘Buy’, read the chart.
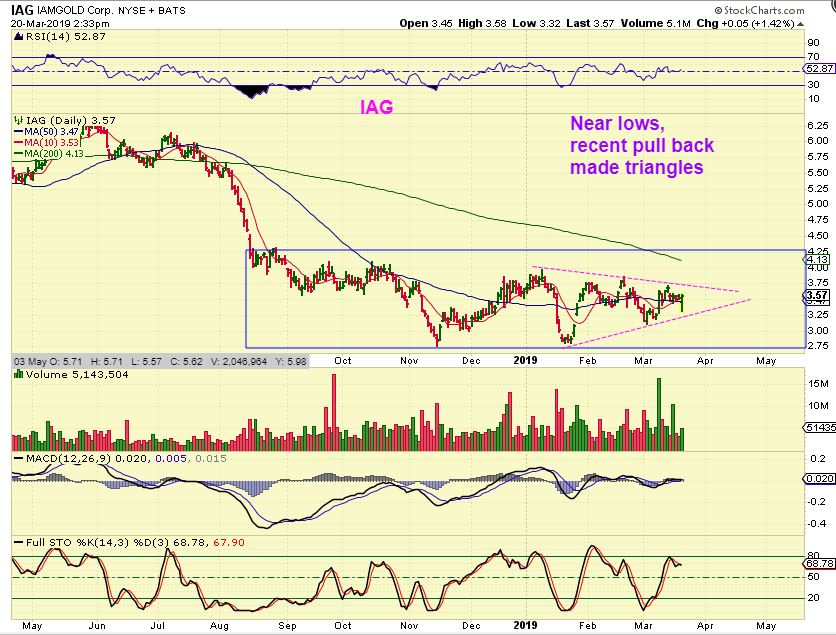
IAG last week – And then a triangle seemed to form here too, within a big base.
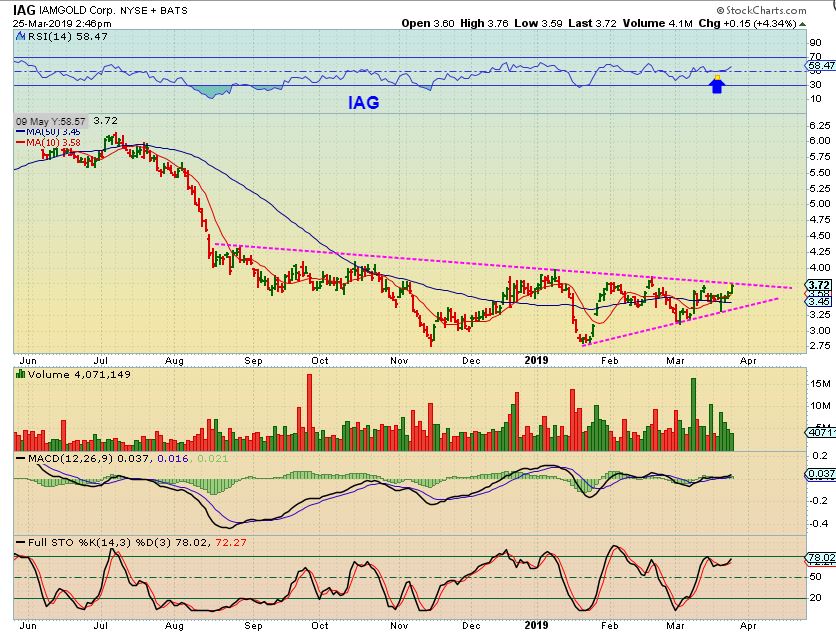
IAG – IAG formed a Triangle & may break out too, but it does need a bit more volume. This would be a Long Base break out and should be considered quite bullish if it does break out. A deep drop to an ICL in Miners might take this to the bottom of the base near $2.75, so use stops.
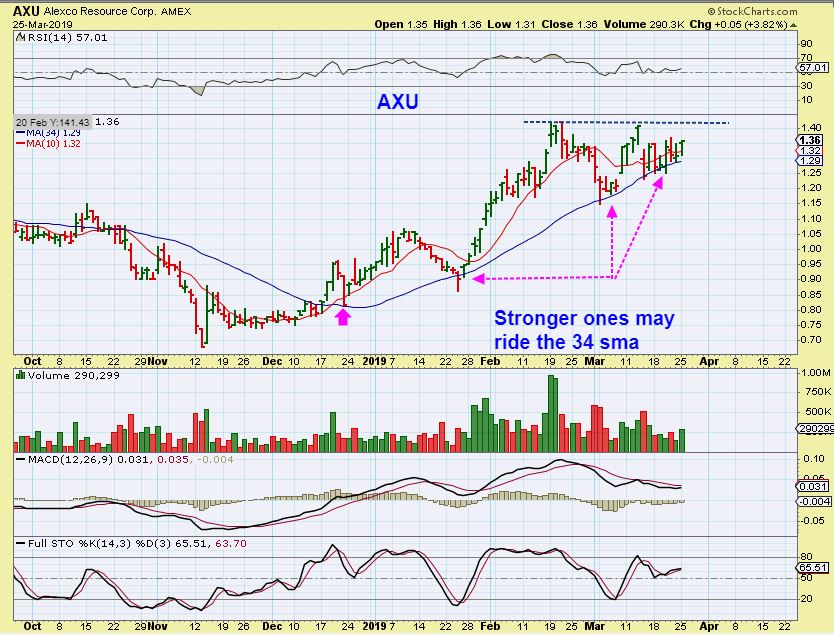
AXU DAILY – I bought AXU and will try to hold it similar to CDE. AXU is a silver stock and silver has not broken out, but many Silver stocks look very good. This is riding the 34 sma and…
AXU WEEKLY – I view this as a possible ‘shake out & recovery’ too. I’m hoping for a break out , and it has held the weekly 10 ma. I will use a stop if things break down into a deeper ICL.
AG DAILY #1 – This BASE was highlighted as a BUY & HOLD prospect. I bought it before the break out.
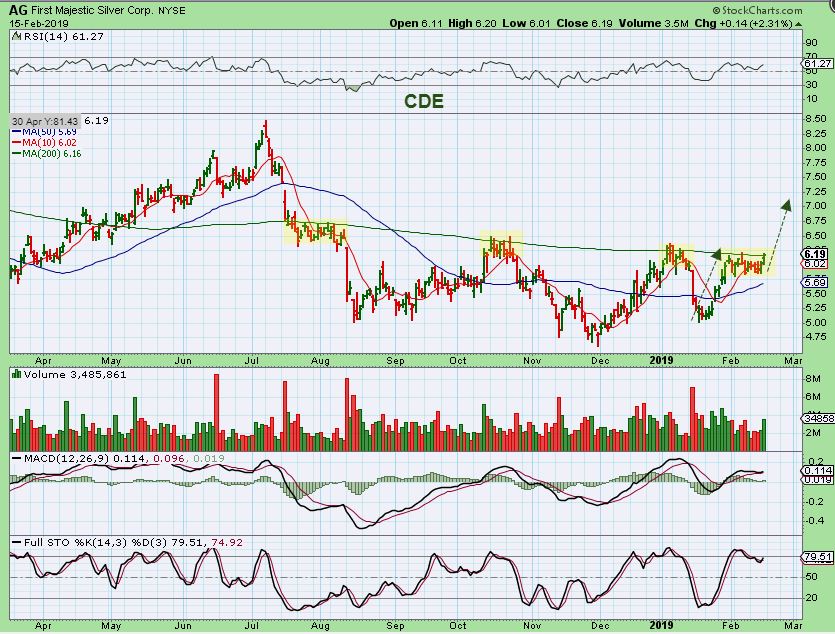
AG DAILY #2 – Just to show the progress, Ag continues to move higher and was mentioned as one that could eventually complete the cup formation up near $8.50
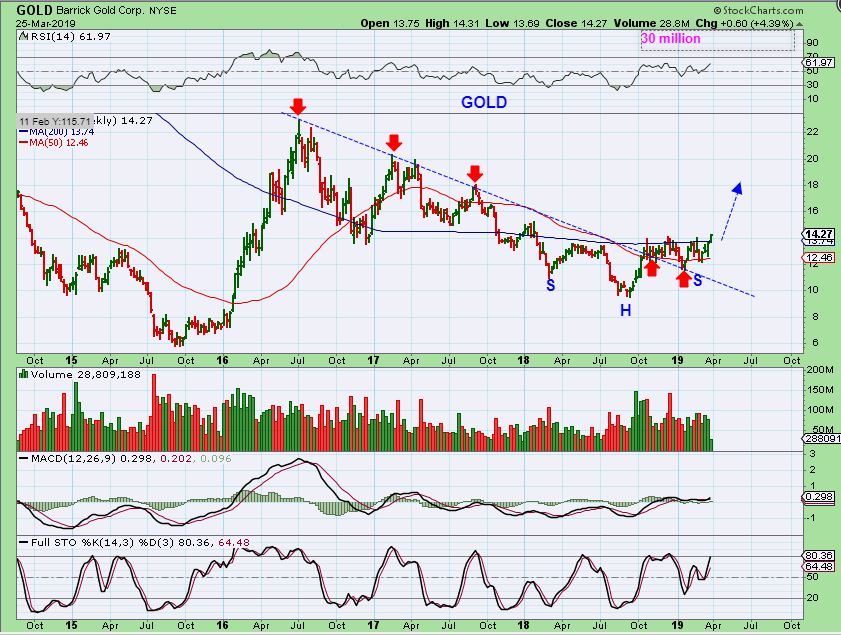
BARRICK WEEKLY – After breaking out & back testing that downtrend line, BARRICK is breaking higher again. Breaking above the 50 ma weekly & now the 200 ma blue line, the 50ma can be where your stop goes, and raise it to the 200ma as it moves higher.
SO MINERS ARE STILL ACTING BULLISHLY, THE ABOVE IS JUST A SMALL EXAMPLE. It is true that Bullish charts can turn ugly during an ICL sell off, so use stops just in case the selling starts.
.
I mentioned in the weekend report that I actually held on to a few of my MJ Stocks, but went short the Markets using SOXS as a hedge. Actually, both moved higher yesterday and MJ stocks did seem to continue to act correctly…
.
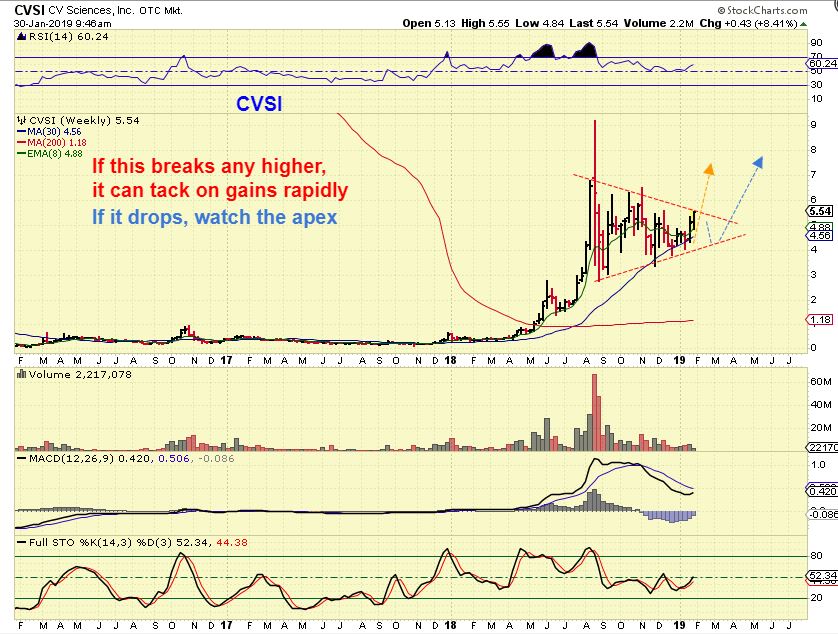
CVSI JAN WEEKLY – Back in January , we were watching for the action, this has great potential
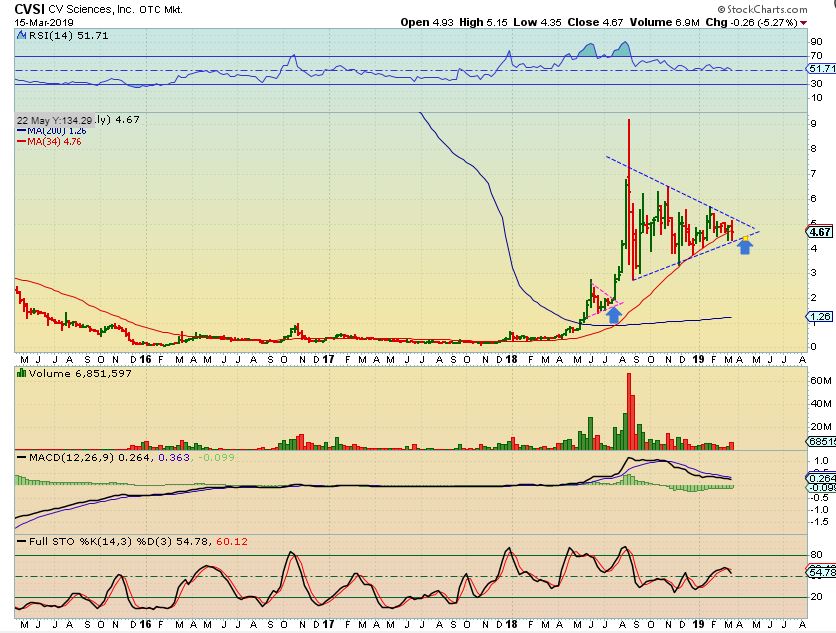
CVSI – MARCH 15 weekly closing in on the APEX is bullish , so I pointed out the other small triangle ( Blue arrow) and the current one. I bought CVSI.
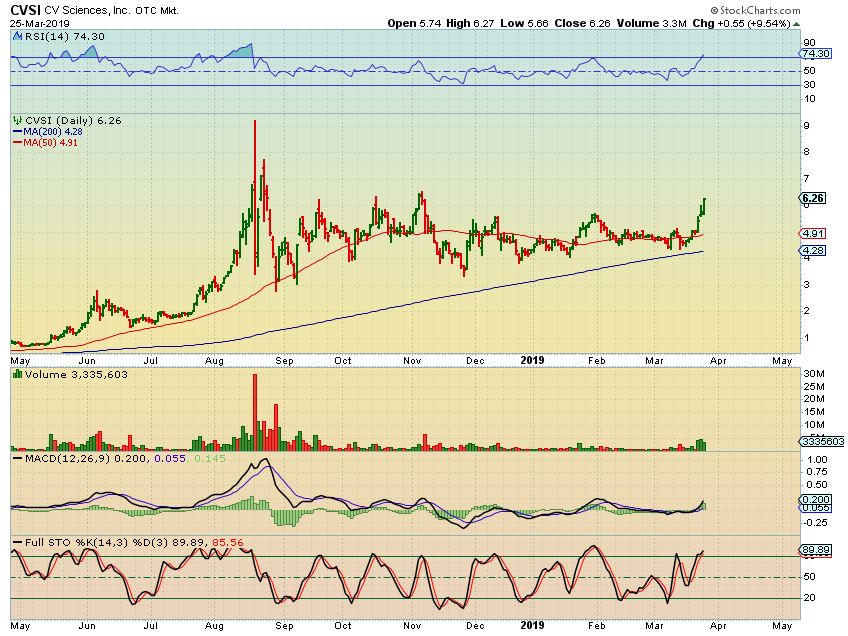
CVSI – It broke out last week and has follow through Monday. This could run to the former highs near $8.
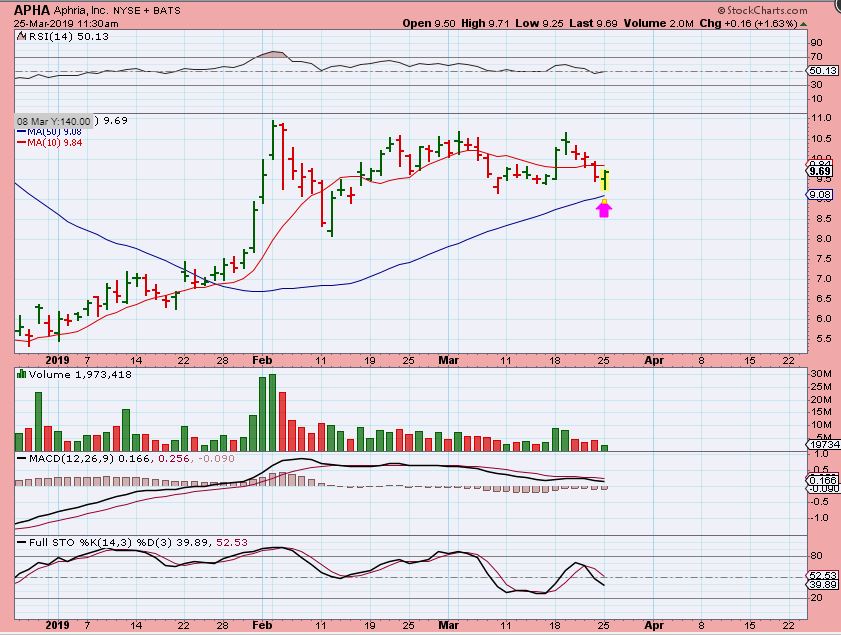
APHA – I posted this in the morning as a reversal . It did hold into the close.
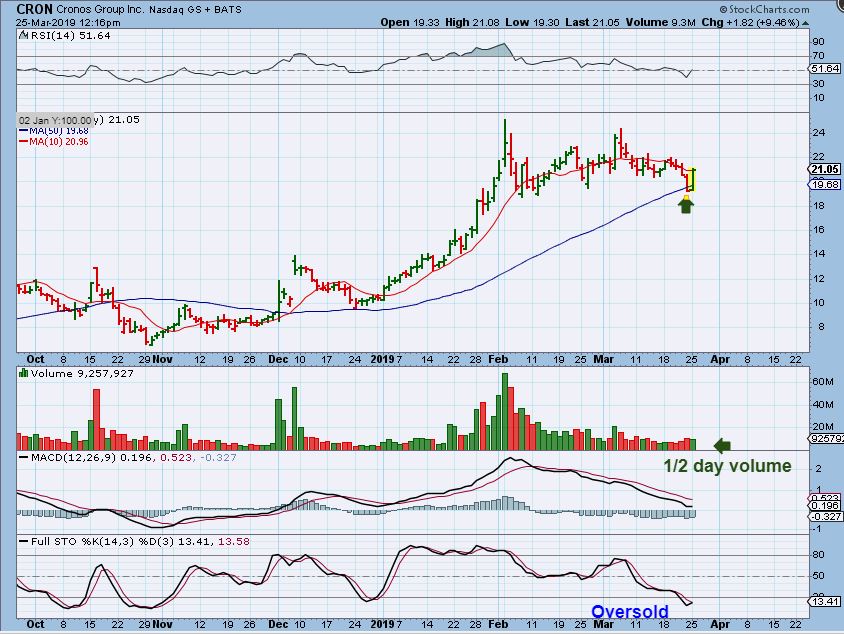
CRON – Another reversal at the 50sma. A reversal at the 50sma is a low risk entry.
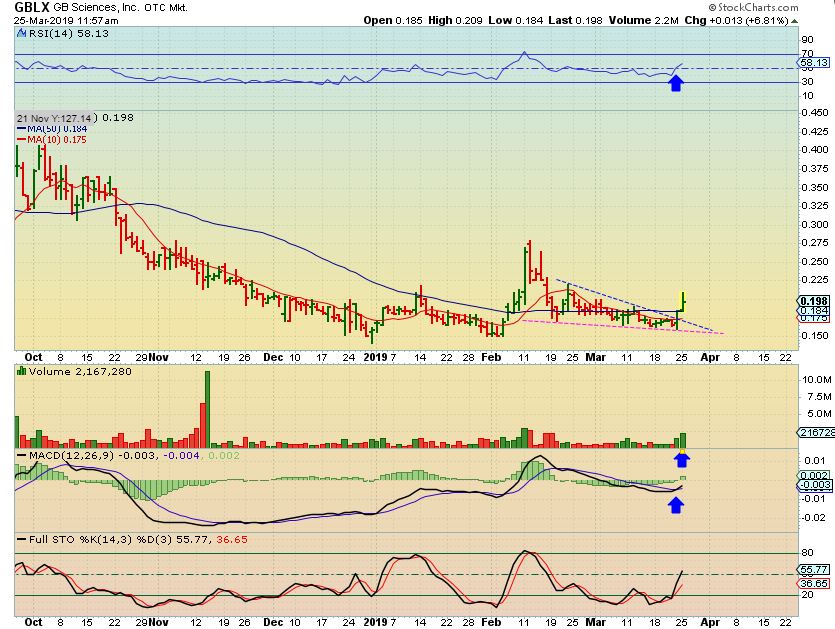
GBLX – GBLX looks to be breaking out from a wedge and closed above the 50sma with good volume. This was captured midday, it closed with 2.9 million volume.
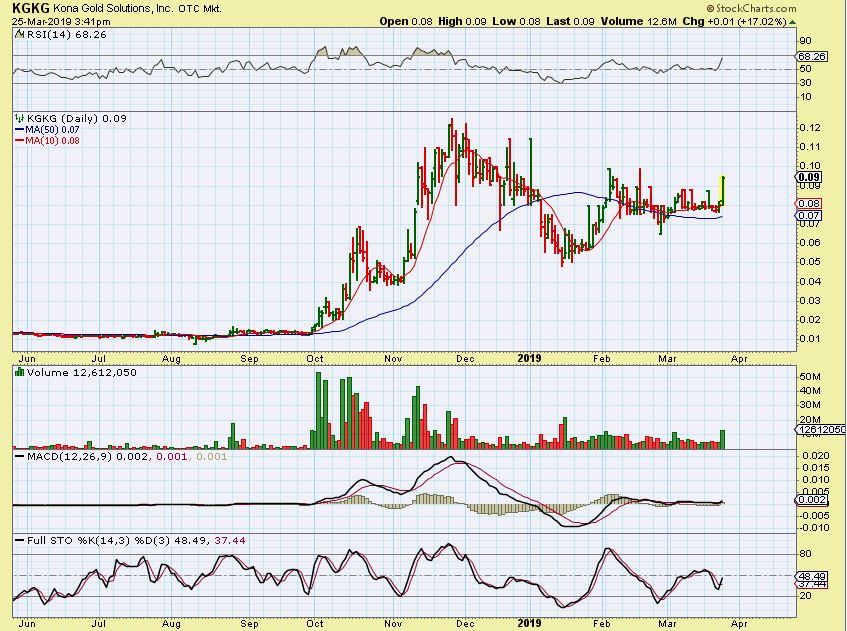
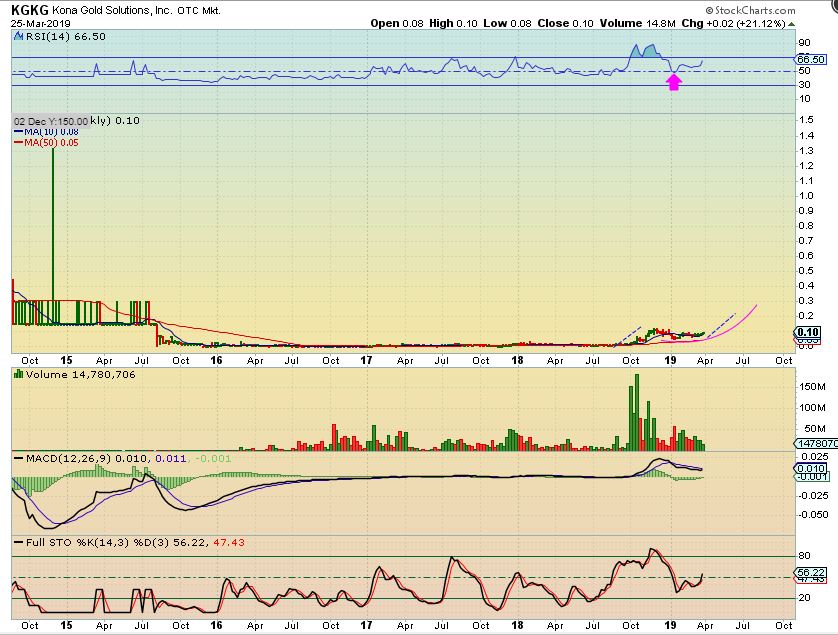
KGKG DAILY – This company sells infused edibles in the MJ / CBD Sector. Last year it ran from 1 penny to 12 cents (huge %-Gains) and then consolidated. This looks like an inverse H&S type of consolidation, and has regained the 50sma. It was breaking out with Good volume, it may be ready for another leg higher. And…
KGLG WEEKLY – The weekly chart looks like a bullish break out. It would have a 16 cent price target or a 20 cent target, if it gets the follow through.
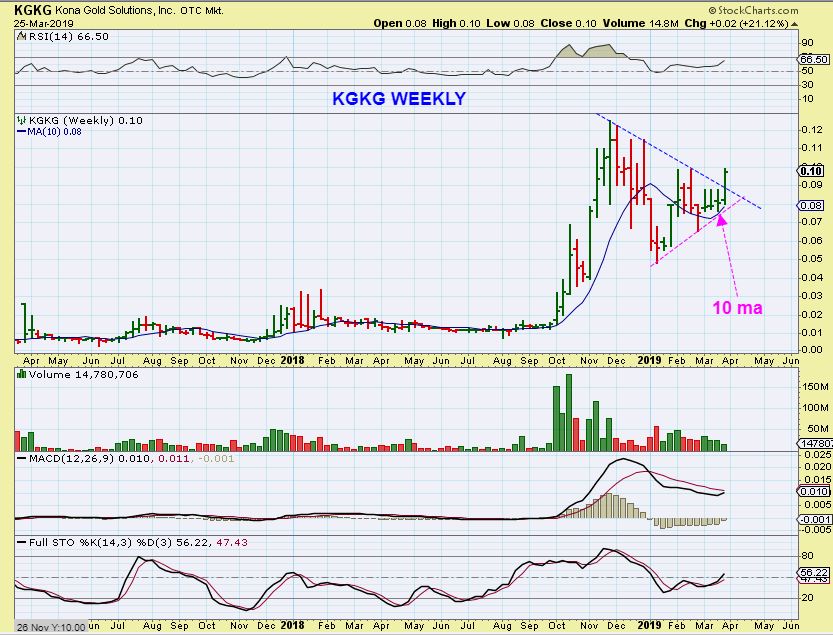
KGKG WEEKLY BIG PICTURE – The weekly RSI stayed bullish, and volume is coming in as this sector draws in buying interest.
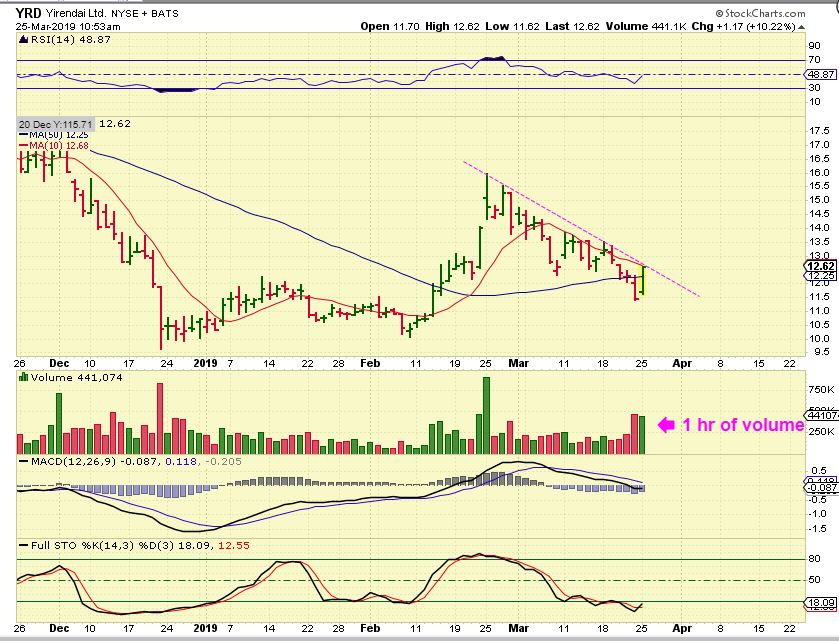
YRD – A Chinese stock that beat earnings expectations and this is a bullish set up. I would buy it with a stop under the 50sma. That is a shake out.
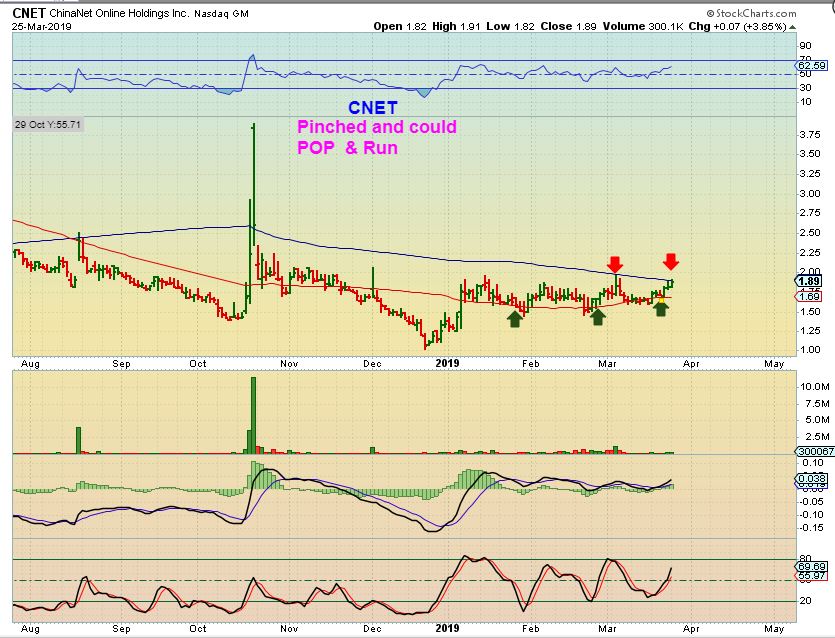
CNET – Another Chinese stock that looks like it may be ready to break out.