
March 16th – Weekend Bigger Picture Review
Let’s discuss the bigger picture for the Markets, after a great week of trading…
I’m going to discuss both what we currently see and what could come from that.
SPX – I’ve been pointing out this resistance, and saying that the markets may get choppy from here. Well…
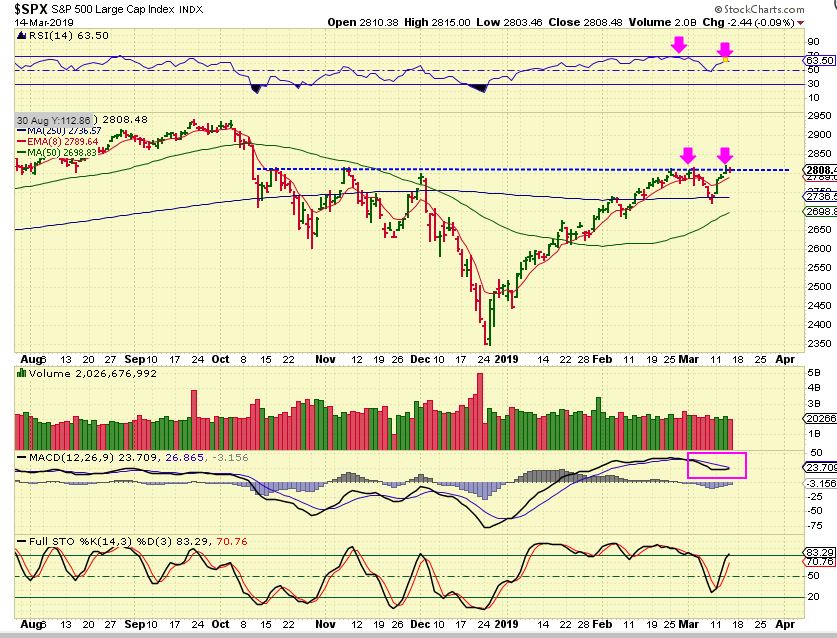
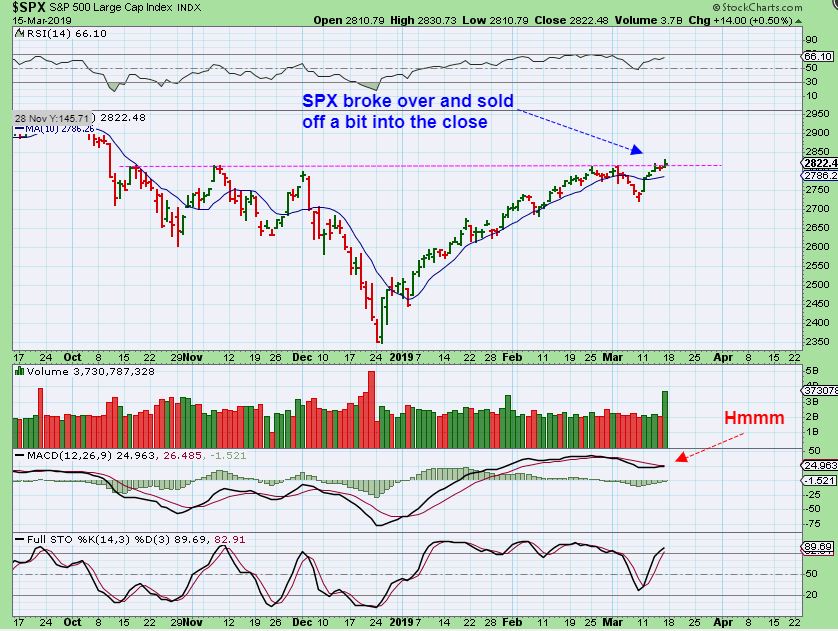
SPX DAILY – What we see is an attempted break out that sold off into the close, so this CAN be a fake break out & it just remains choppy at this resistance or it can push higher again & find follow through. At this point, the markets have been trading bullishly, so trade them while it is favorable, but always honor stops.
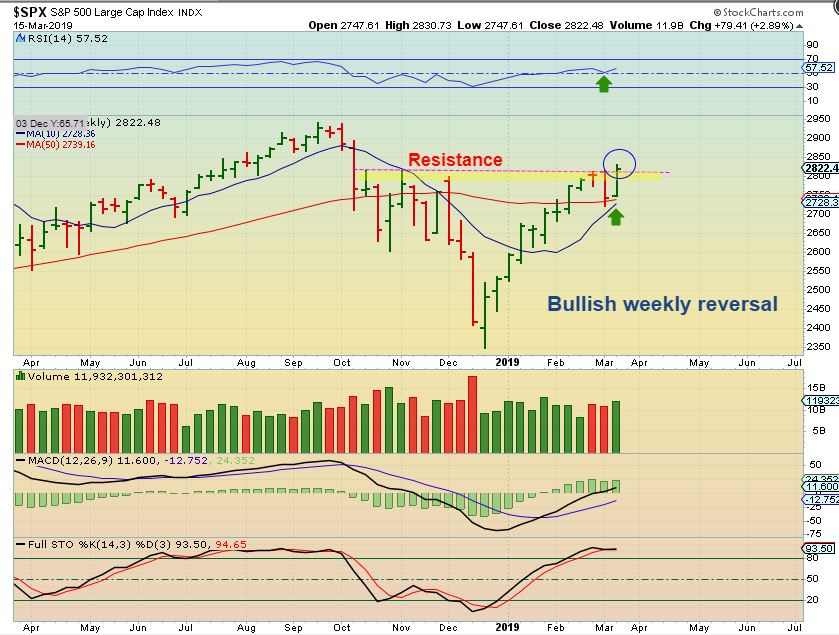
SPX WEEKLY – The weekly actually looks like a break out and a Bullish Reversal, so I treat it that way, but there are some cautionary signs to discuss ( I mentioned the VIX last week)…
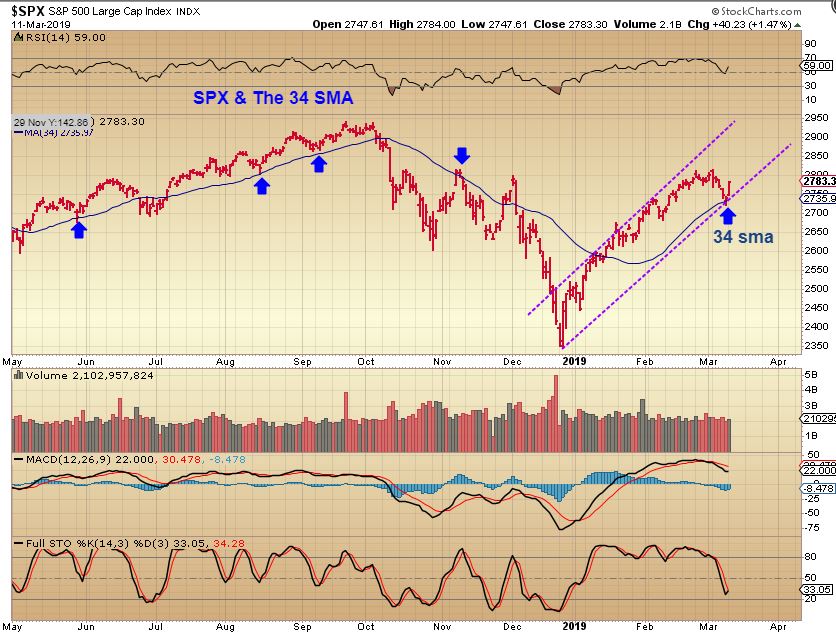
SPX – This was my March 11 chart, where we now have a channel to go by too. This can also be used as a rising stop.
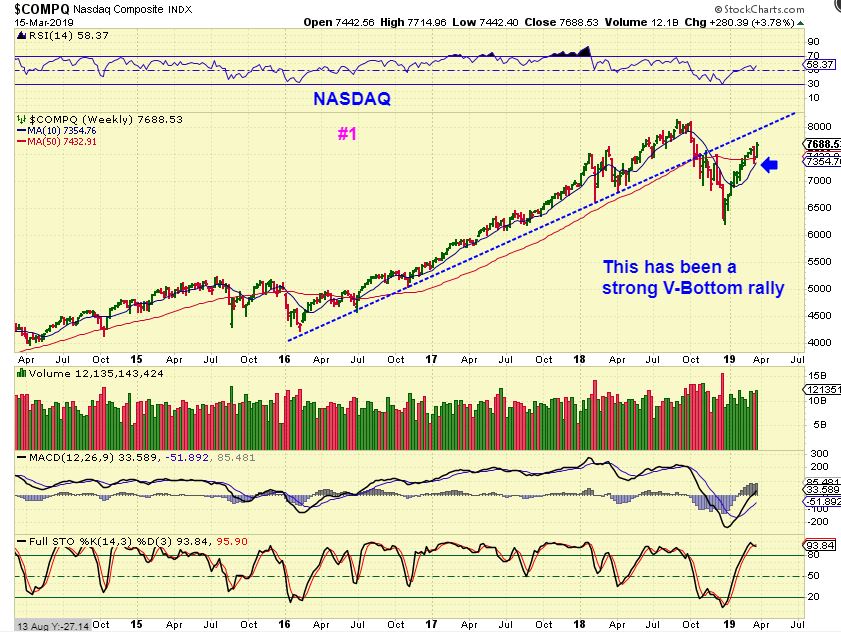
NASDAQ WEEKLY – The NASDAQ WEEKLY has a V-Bottom rally, a 1 week dip that reversed off of the 10 ma, and that is bullish, so I treat it that way…
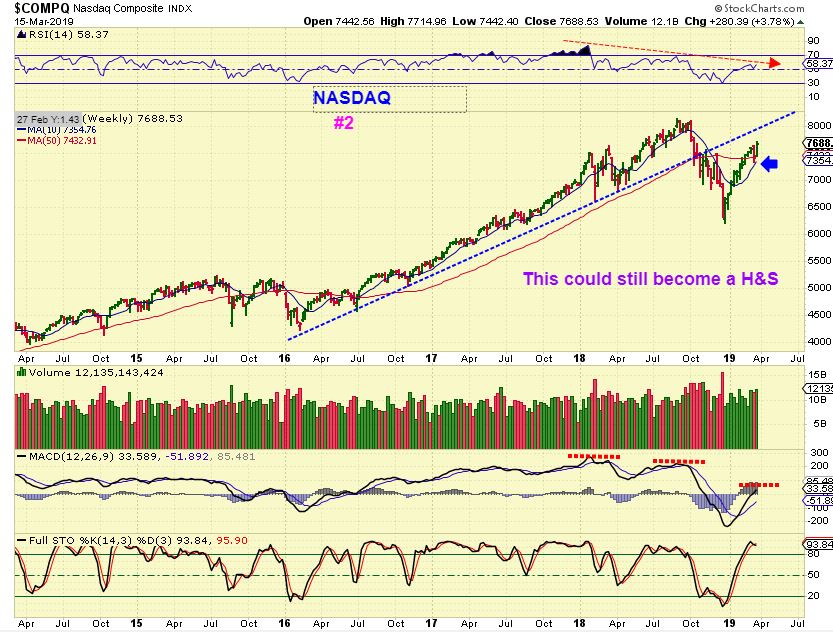
NASDAQ WEEKLY – It could be an inverse H&S ( Bullish) , so simply play the long side WITH STOPS.
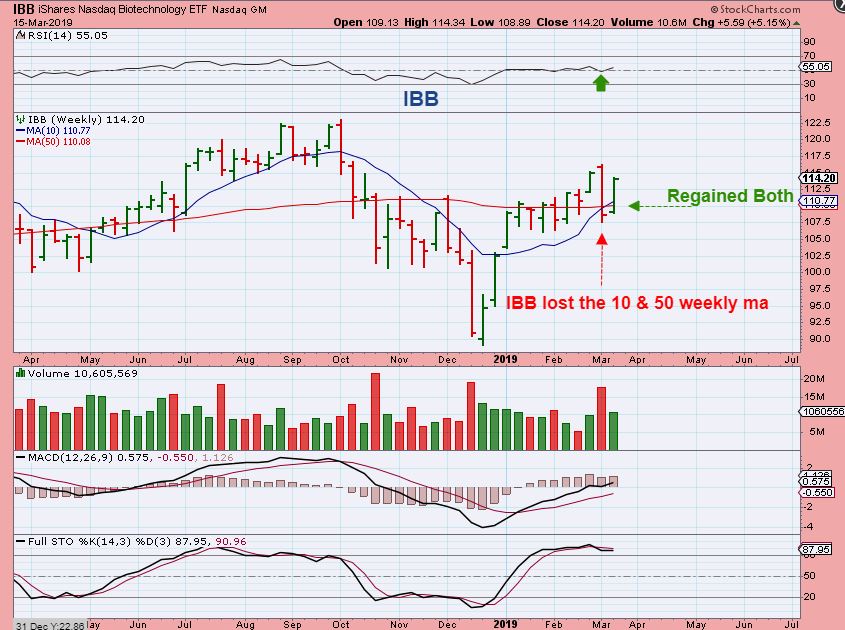
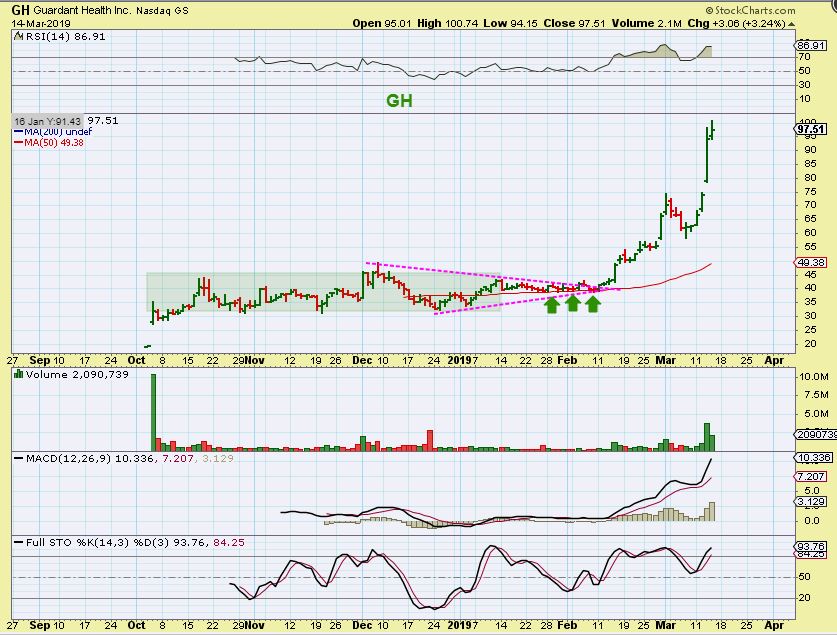
IBB WEEKLY – We have been trading small & big Biotech stocks that have based out and been running strongly ( See GH, TENX, MACK, LJPC, XENE, CRSP, NTLA, SYRS, IDRA, etc etc etc for examples ).
After a big 1 week sell off losing both the 50 & 10 weekly ma, the IBB WEEKLY looks bullish too.
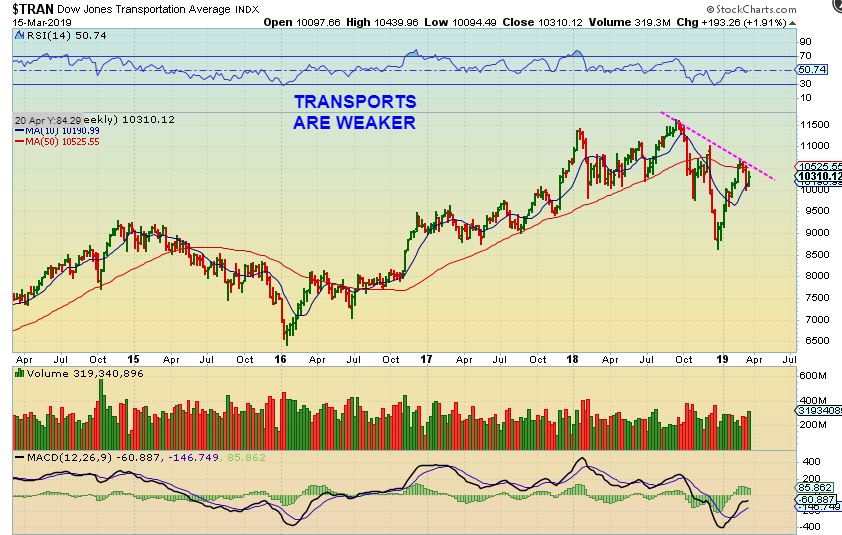
TRAN WEEKLY – Now when it comes to the TRANSPORTS, they have been lagging and remain in a down trend, so this is an area that will play catch up or it may be a warning sign. It did reverse of the weekly 10ma, that is usually bullish, and can be used as a stop.
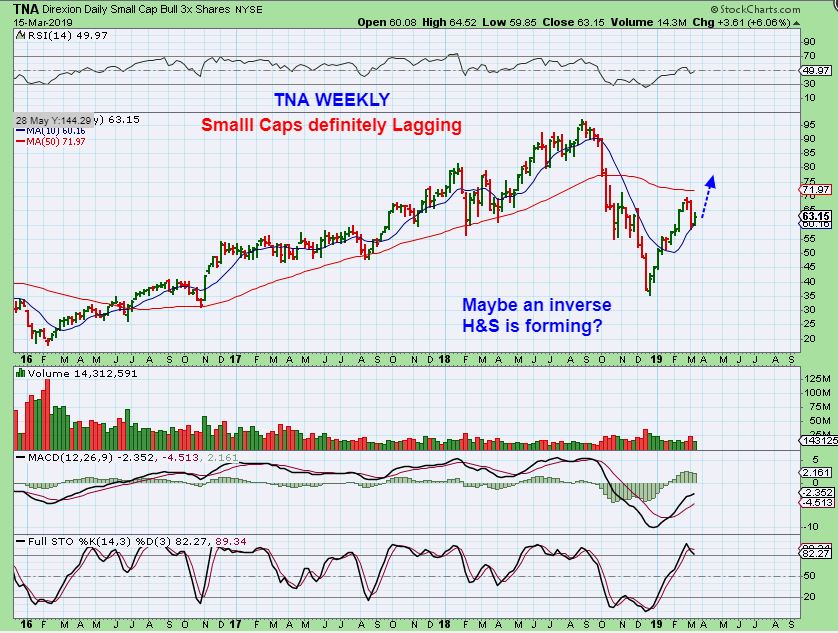
TNA WEEKLY – Same here with TNA- It was brought to my attention this week that the Small Caps represented by TNA are seriously lagging too. I don’t know if that is a warning sign or they are lagging & may catch up. I do see a possible inverse H&S (Bullish), and a reversal at that 10ma, so I treat it as bullish with a stop. I would have a stop at the reversal / 10 weekly ma.
Note: I have been saying that if the Bull Markets ended with that sell off at the end of 2018, we would get a nice rally out of the ICL, and at the same time I would watch the first 2 daily cycles and see if the Bull Remains in tact, or if weakness is evident. I am doing that now, and AT THIS POINT, it still remains a ‘Trade this long’ type of market , as long as we always use stops and remain alert. Let’s look at 1 more thing for now – a progress report of a couple of areas that I’ve been watching…
.
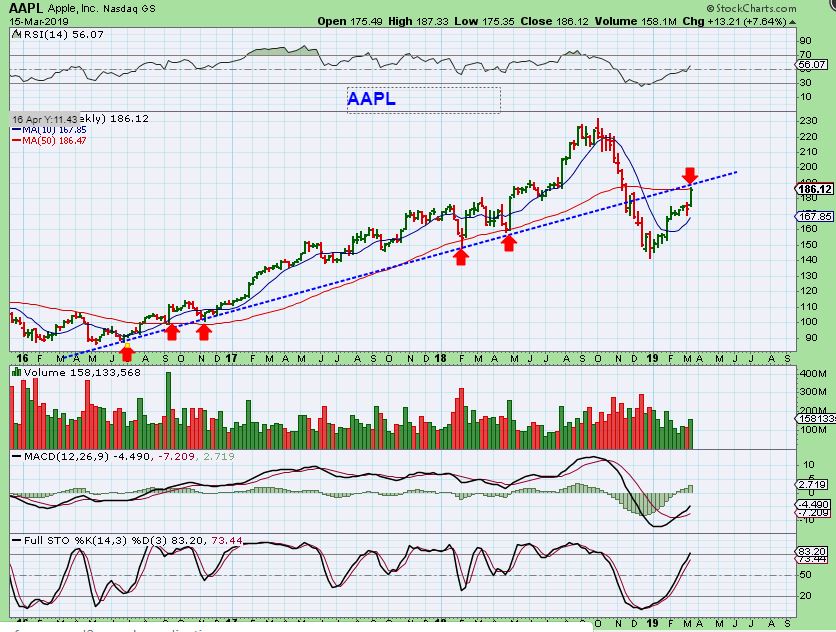
AAPL – AAPL is at the point where it is either BACK TESTING the break down & 50 ma, or ready to recover an uptrend. This could be an important week.
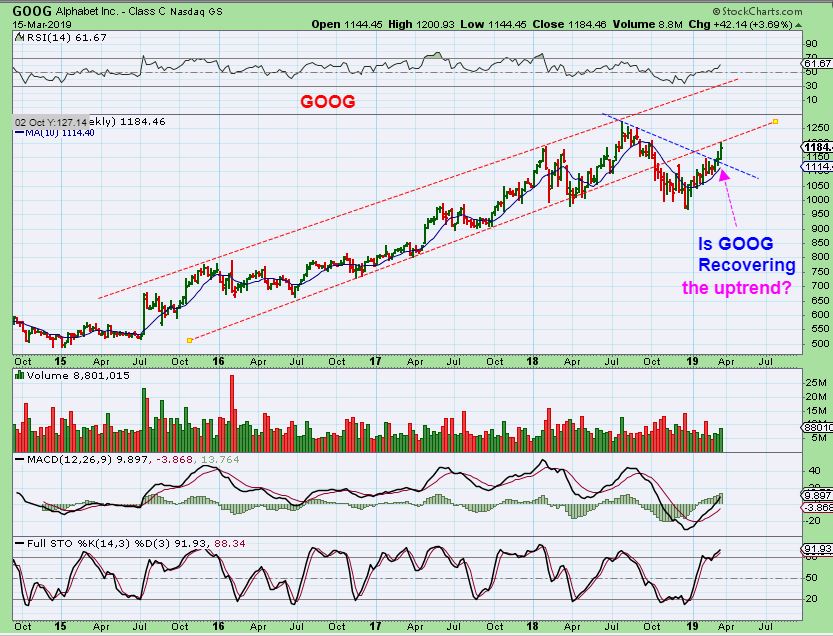
GOOG – look where GOOG just happens to be. It is also Back testing or set up to re-enter the uptrend.
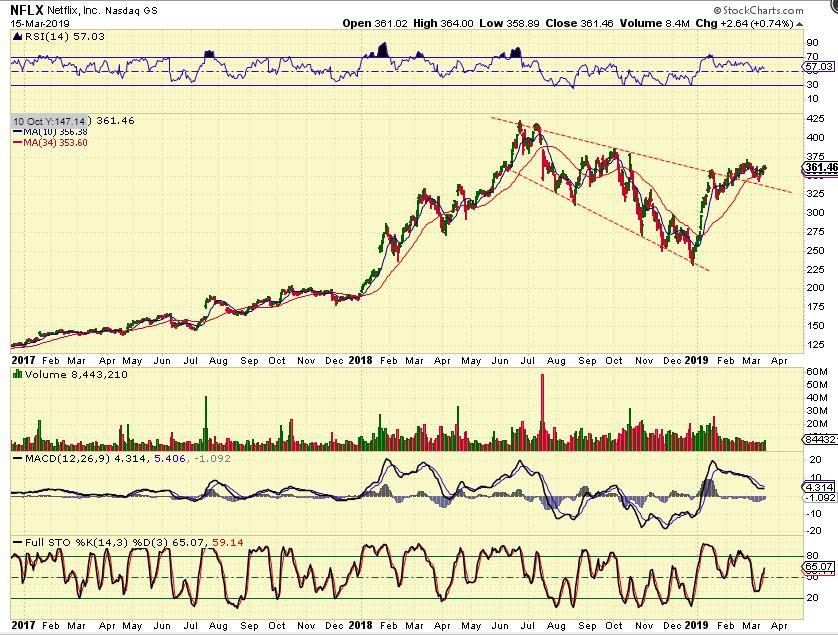
NFLX – NFLX is a different set up, but it seems to have broken free from the recent downward channel. The chart, however, looks weak to me with volume lightening up, the RSI at 50% , & the MACD is neutral. This one has recovered to a degree, but doesn’t look extremely strong ( Still a buy with a stop though).
CONCLUSION: So in my opinion, the VIX is near the lower B.B., it could bounce. If it does, it would cause the markets to drop. That kind of a change might give us a failed break out for SPX & QQQ, and then AAPL & GOOG and others like them might NOT get back into the uptrend. So my thinking is simply this … ” It is a bullish set up at this point, treat it that way, but remain cautious or at least aware of the alternative possibilities.” All the positions that I am holding are long positions.
,
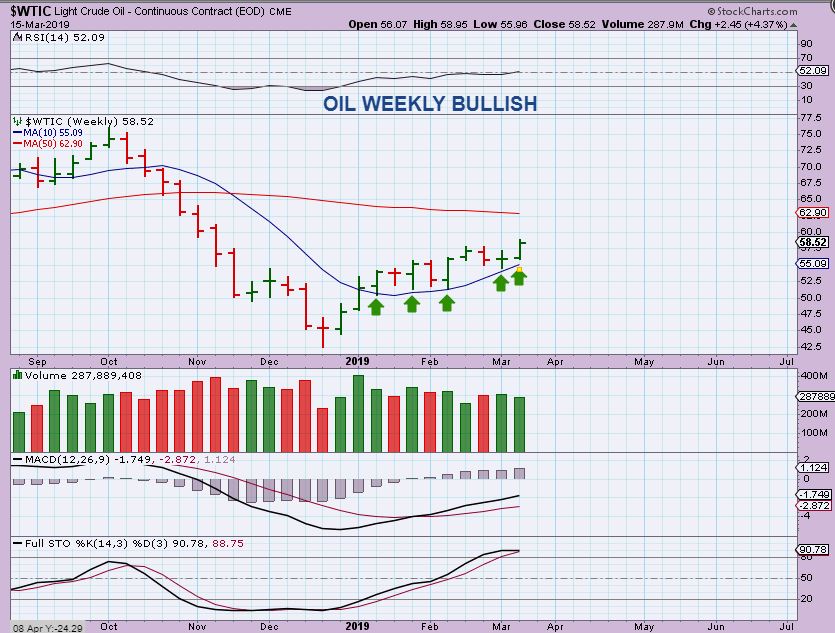
WTIC WEEKLY – This is a bullish weekly chart after the inventory report this week pushed Oil higher.
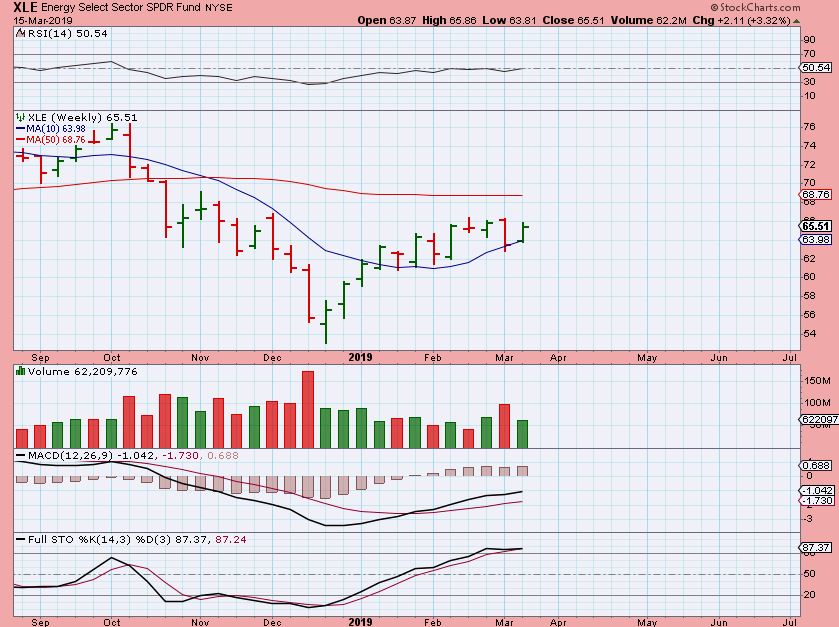
XLE WEEKLY – The XLE also bounced off of the 10 weekly MA after a strong down week had me wondering if Energy was going to sell off. Energy stocks became a buy this week.
USD DAILY – The USD had a big drop this week, so one would expect a big Pop in Gold, but Gold may be weakening, and preparing for its dip down to an ICL. The USD is almost oversold, so this could bounce soon, but it does look weak. 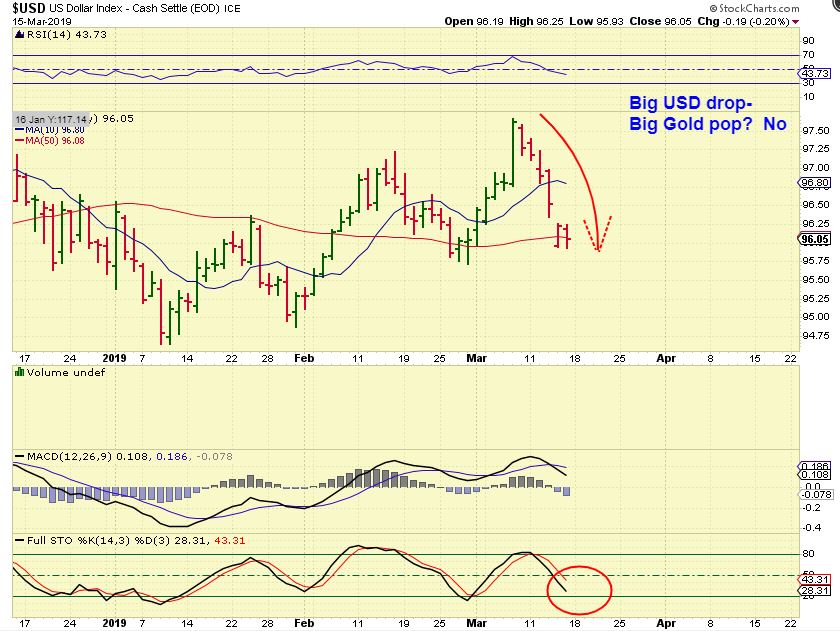
.
The Weekly USD looks Big Picture Bearish, but is it ready to drop now? If so, I would think that Gold would rally, but Gold doesn’t seem ready to rally out of an ICL yet, so lets discuss this. All we can do is look at what we have currently, and adjust if needed later.
.
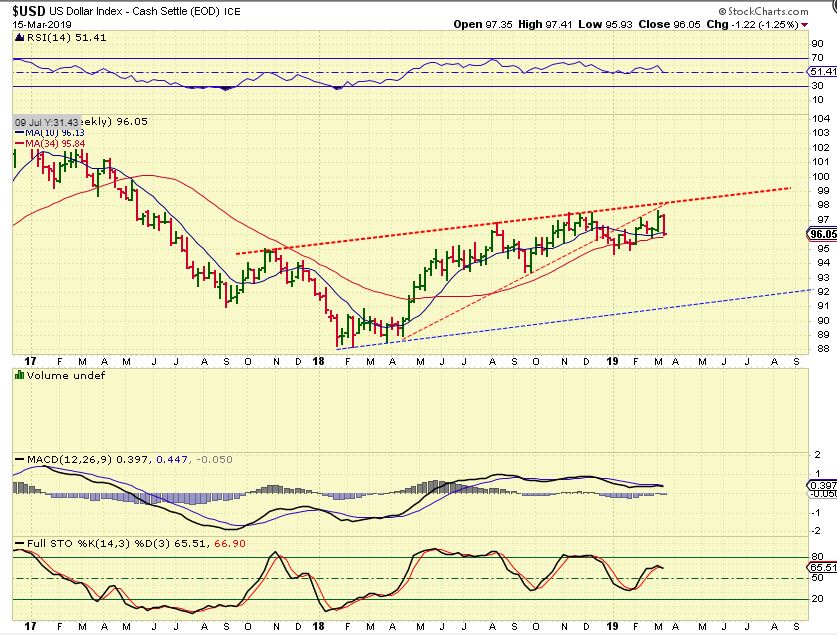
USD WEEKLY – Remember that wedge that I was drawing months ago (red) that broke down? It could now be back testing the apex, with a bigger drop to come. During that Bigger drop, Gold should have a bigger rally. At this point in time, the USD dropped to the 10 weekly ma, and that may cause a bounce, but it does look weak. BIG PICTURE: This looks like a triple top with a weak MACD & RSI & a bearish rising wedge completing (Both are big picture bearish).
.
So if the USD Drops, I would expect GOLD to rally, but GOLD doesn’t look like an ICL yet. It is within the timing, at 7 months after the August ICL. Let’s take a look at 2 ideas where 1 is what I do expect, the alternative is based on what I wrote about the 2008 lows a few weeks back …
.
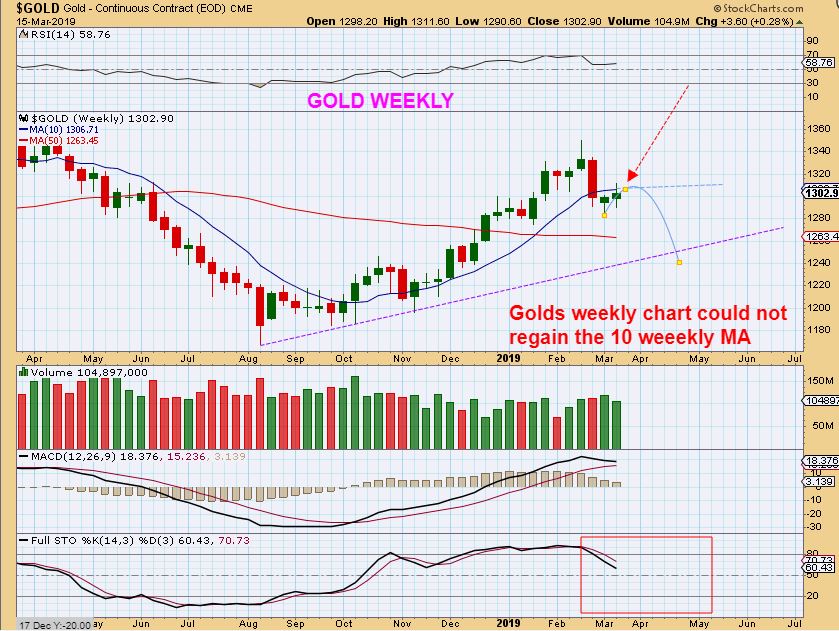
GOLD WEEKLY #1 – After 2 weeks of selling ( a big drop into last week), Gold put in a weak bounce so far, even though the USD dropped big this week. This is a possible Weekly Bear flag and I am expecting Gold to drop to an ICL. AN ICL usually breaks the uptrend line…
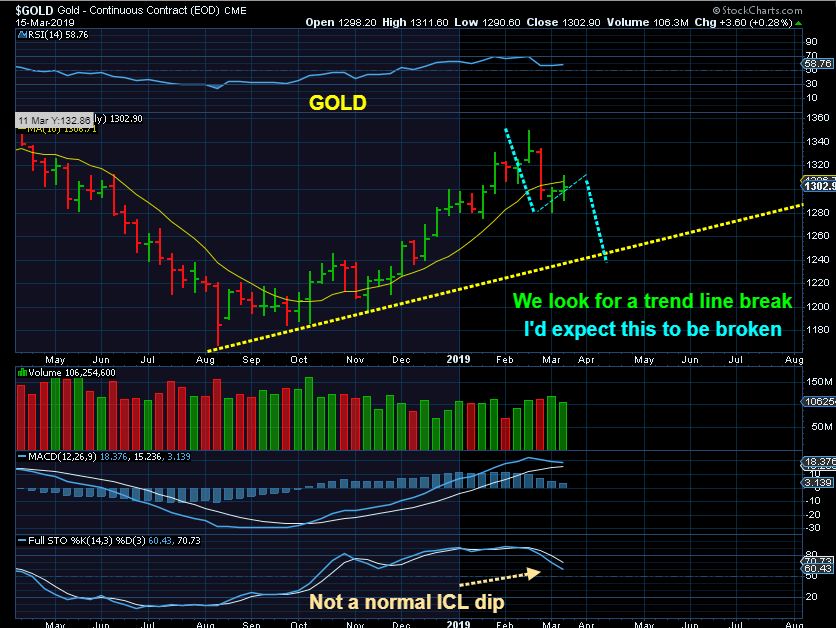
GOLD WEEKLY #2 – So I would expect this most of all, call this MOST LIKELY TO HAPPEN. But if the USD starts dropping fast and Gold starts to look strong? Then I would think of this…
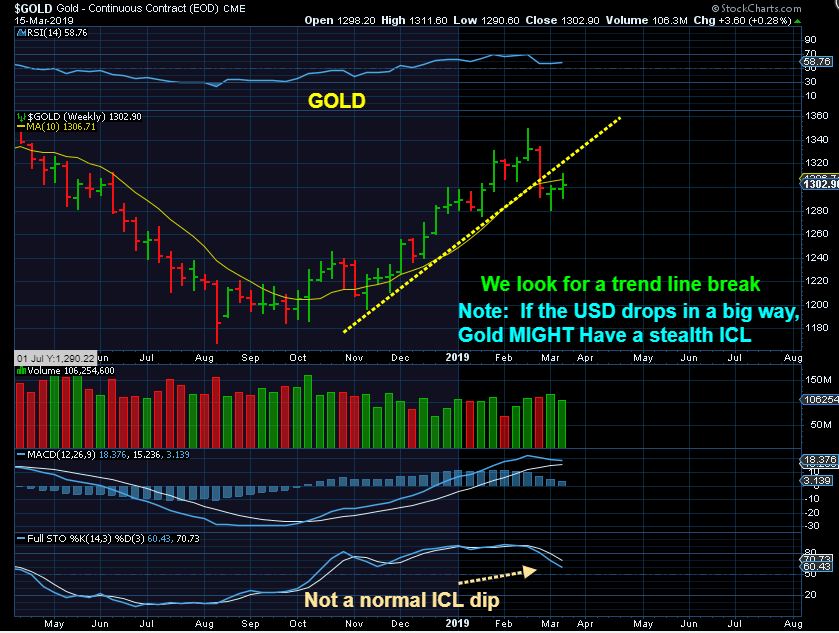
GOLD WEEKLY #3 – What if the uptrend line is moved to the increased angle ? Then the Trend line has broken & it is month 7. What I am saying is,
“If the USD starts plunging and Gold recovers that trend line, the ICL could be in place” – this is LEAST LIKELY at this point. The above chart is more likely.
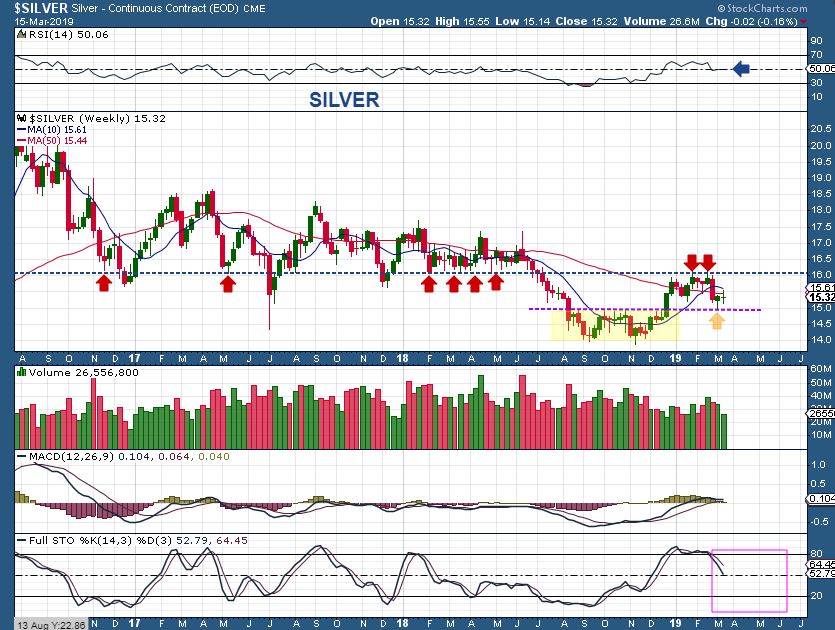
SILVER WEEKLY – Silver remains trapped between a small base and overhead resistance . It also remains closer to overbought than oversold.
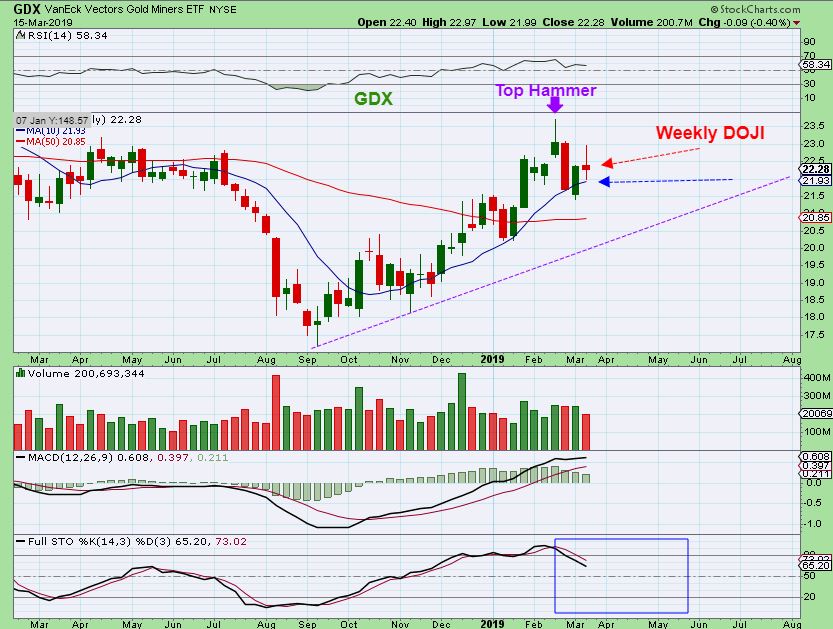
GDX WEEKLY – GDX gave us a weekly indecision doji candle and remains overbought too. This should drop to the trend line shown too.
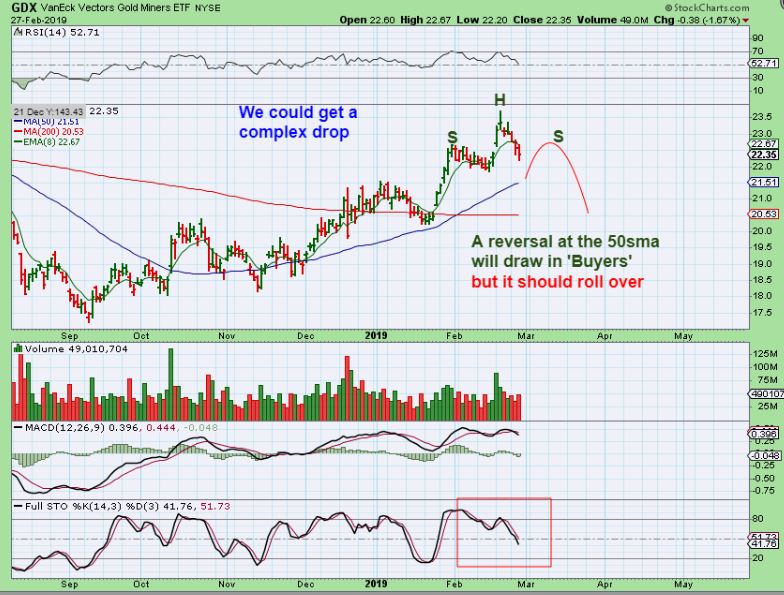
GDX DAILY – People were becoming Super Bullish on Miners in February, and thinking that it’ll never pull back and allow them to buy or add. In February I had been preparing everyone for a possible drop to support, a weak bounce that becomes a H&S, and a drop. Read the Chart from Feb 27.
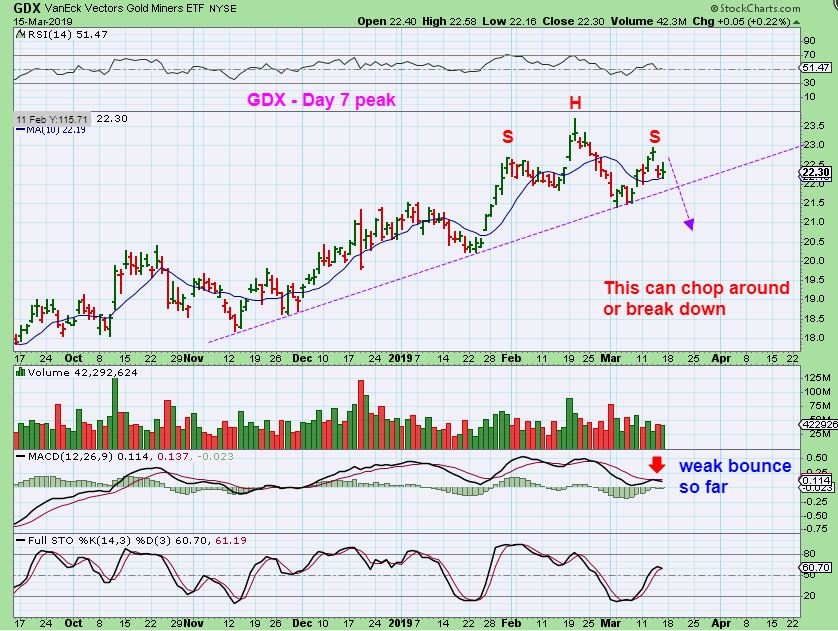
GDX DAILY – It is playing out just that way so far. I still feel that Miners can get choppy here & drop, or simply drop. The MACD is weak now and I don’t think we’ll make new highs until we drop to a deeper low.
.
That is our big picture weekend outlook.
Reminder: We have discussed so many good trade set ups over the past 2-3 weeks and trading has been good. If you are long any of these sectors, it has been paying off in most cases, so by all means Play it out for all that you can. That said, if your Trade or stock starts to sell off or break important supports, it is best to cash in and watch what is taking place. You can always re-enter a trade with your funds if it stabilizes or recovers as a shake out, but riding it down to the lows takes funds from your account. Therefore, always use & honor stops. Also, if I don’t mention when ‘earnings’ was released or will be released, please take time to do some due diligence on ones that you own and look that up. A gap down from earnings can defeat stops if they are still close to the current price.
.
Have a great weekend and thanks for being here with me at Chartfreak!
.
~ALEX
.
We have had a ton of trades, so I don’t want to just keep piling them on, but when I see a good set up, I can’t help but point it out. There are still many bases setting up to break out, I own several and still have many on my watch list that look excellent. With so many set ups already on our lists, let me just point out one new one to watch for Monday, and review 3 others to show how they can play out.
.
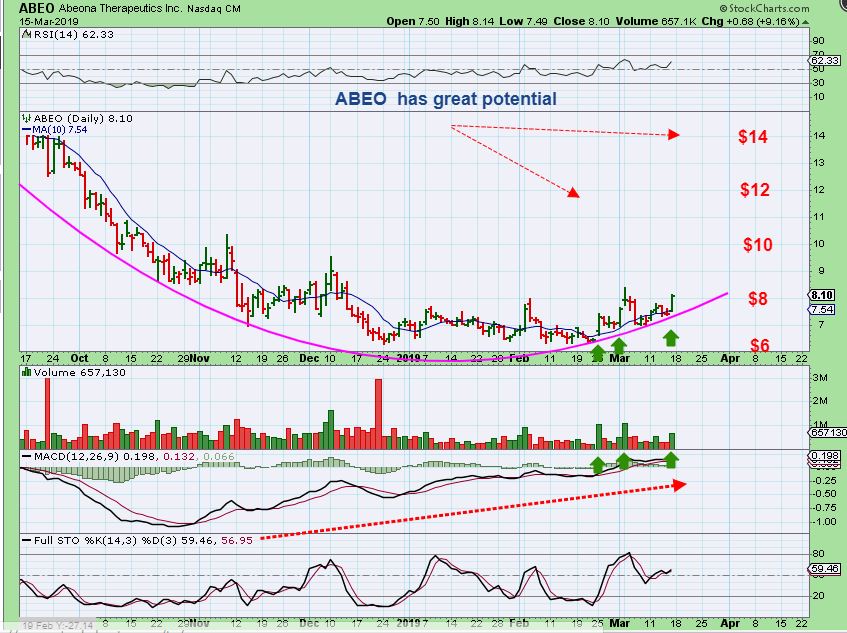
ABEO – I love these bases that are forming and the upside potential is very good. Believe it or not ( I usually ignore this anyway), but they got a ‘Buy’ Rating at the end of February, with a $30 Price target. THAT would be some great gains, right? I almost bought this Friday, but I have more positions open than I like to, so I held back. Rumor is MARCH 18 Earnings- so be aware of that. Watchlist?
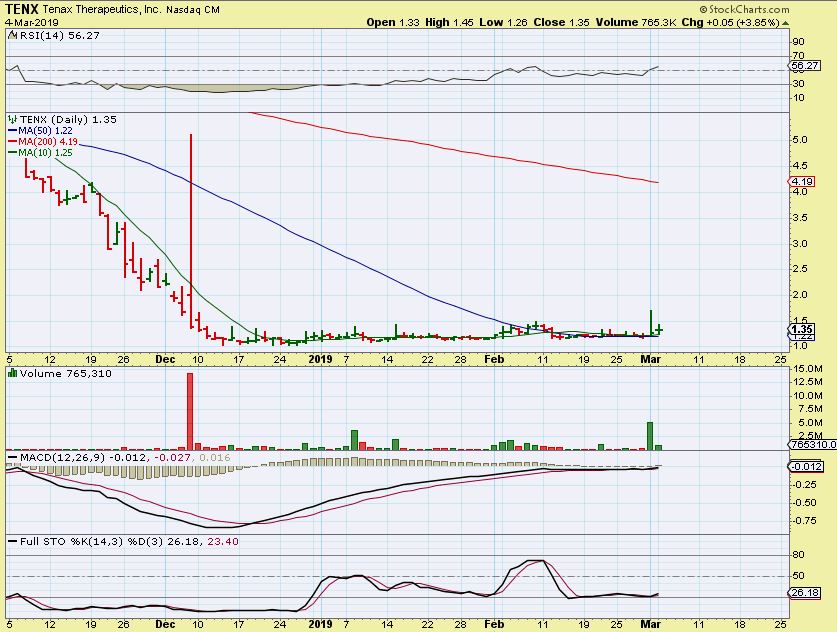
TENX MARCH 4 #1 – Several readers (maybe more?) Bought the set up for TENX with me . I loved the base & Volume pops. We then enjoyed a great POP…
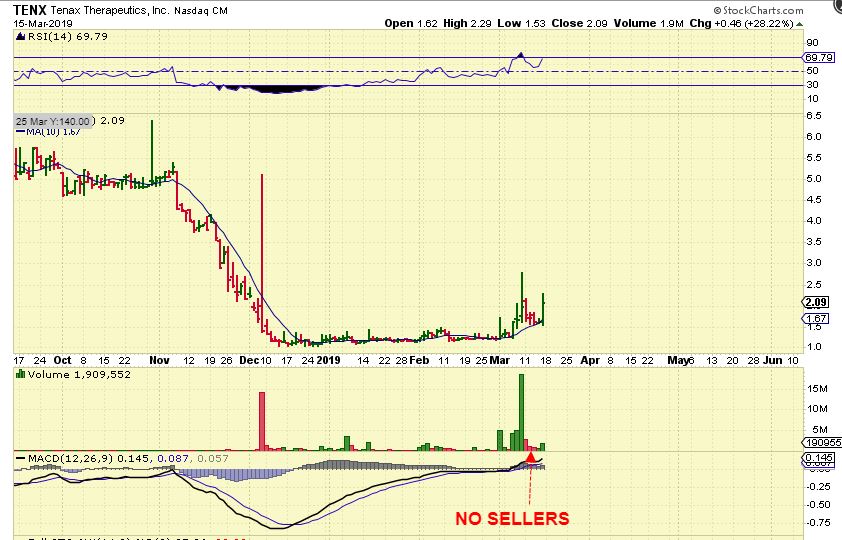
TENX #2 – I sold 1/2 on that big pop & wanted to add back on at the 10sma. It was there Friday and there were NO SELLERS , but I didn’t add, and in the last minutes of Friday, TENX shot up 30%!. So if they are acting correctly, rising from a base, you see the benefits of allowing things to play out.
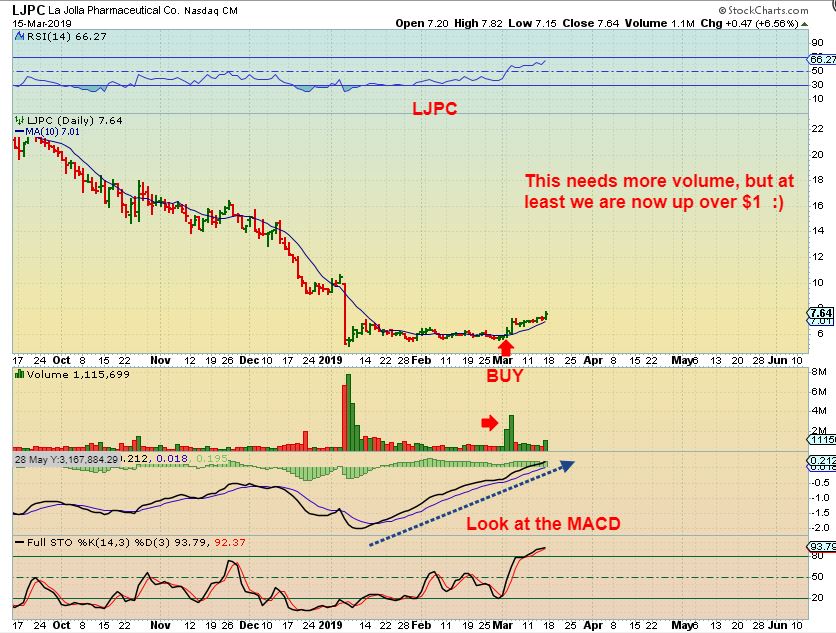
LJPC – Patience is slowly paying off, but I really feel that this needs more volume. The MACD is so strong during this base building that I don’t want to sell it, I am trying to let this one play out too. I almost sold this to buy ABEO, but it started moving higher.
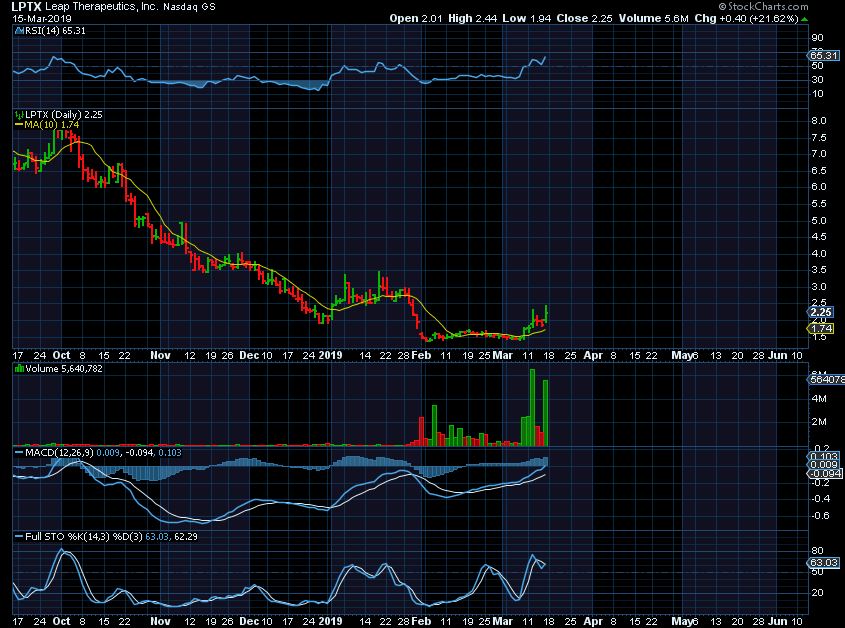
LPTX MARCH 11 – The volume & the base was perfect on this break out, so it was a buy breaking above the 10sma…
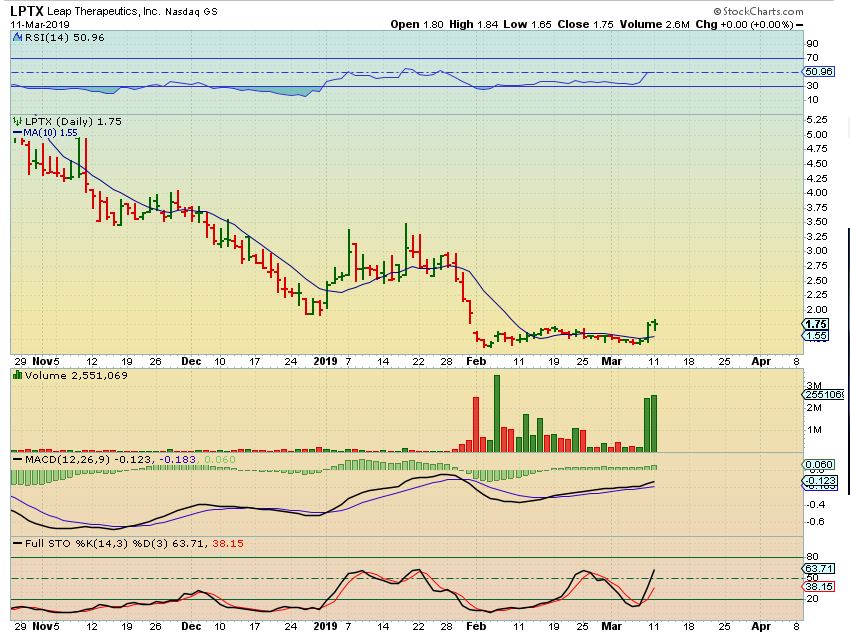
LPTX – And the sideways flag had light volume selling ( Minimal sellers). Fridays POP had strong volume again, so it a buy & hold for now. These are the ones that you can allow to play out , as long as the sectors remain bullish. Then you can raise stops along the way.
And don’t forget the BEST BASE OF ALL– WHICH I SOLD TOO SOON AND MISSED THE BEST PART OF THE MOVE!
So, We have had several of these bases playing out well, way more than I have pointed out here. The reason that I am pointing them out is to show why I like this base breaking higher in ABEO 🙂 It is VERY CHOPPY, but has moved from $6 to $8 and has great potential for the patient ones. Earnings may be Monday the 18th.
.

