
Friday 3-1 Trading
I would say that nothing has really changed with the markets for the last trading day of the week, but my gut feel for Oil & Energy stocks has slowly changed. Let’s just do a quick review and take a look at just a few things on this last day of trading…
.
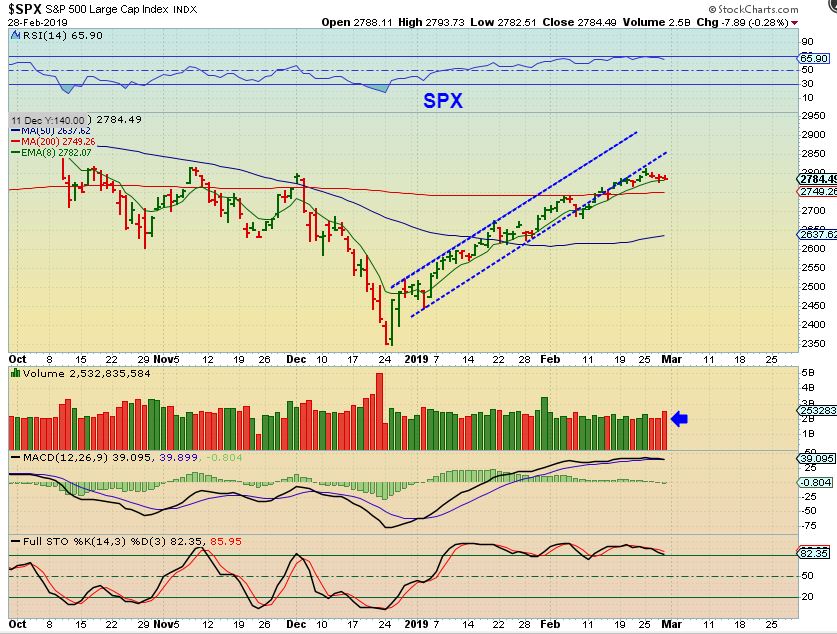
SPX– With the SPX at resistance, its upward move has been capped and price became choppy. I see a break of the channel, but price holds above the 200 sma. Earnings for individual companies has been mixed, with some very good and others causing a price drop. The sector ETF is currently going sideways here. Tighten stops if you are long, but this can break higher if we are on the 2nd daily cycle.
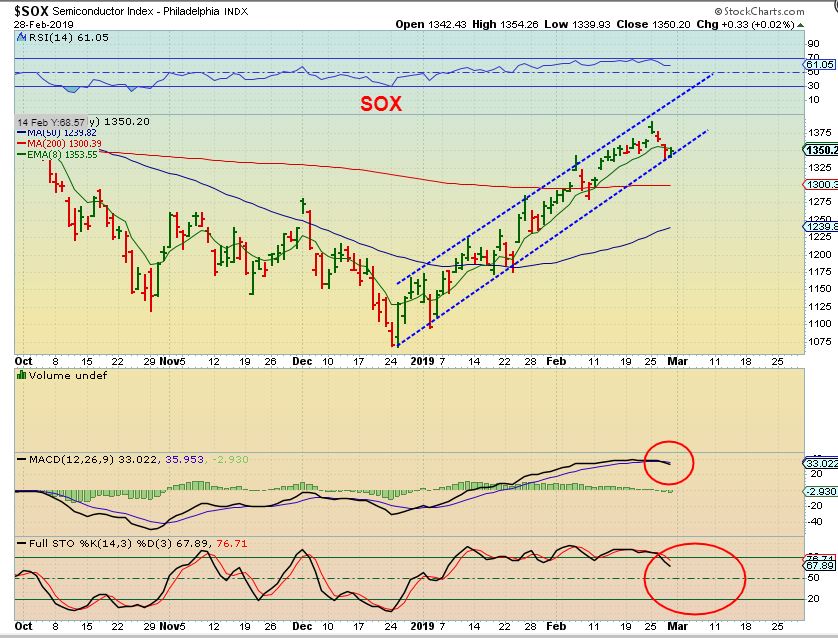
SOX- The Semiconductors are at the lows of their channel. It looks like it is weakening in some ways ( MACD & RSI), but it too remains above the 200sma.
.
ENERGY : WHAT HAS CHANGED ?
.
I’m uncomfortable with the way The Energy Sector is acting. Recently OIL DROPPED, but the XLE, OIH, and XOP did not, so they showed strength and it looked like OIL was just doing a 1 day drop while stocks stayed strong. Things are reversing. Oil recovered after the inventory report, but the individual Oil / Energy stocks are dropping ( see charts of OAS, WLL, LPI, back below the 50sma ) for example. SO now I am uncomfortable with the individual stocks. Let’s take a look…
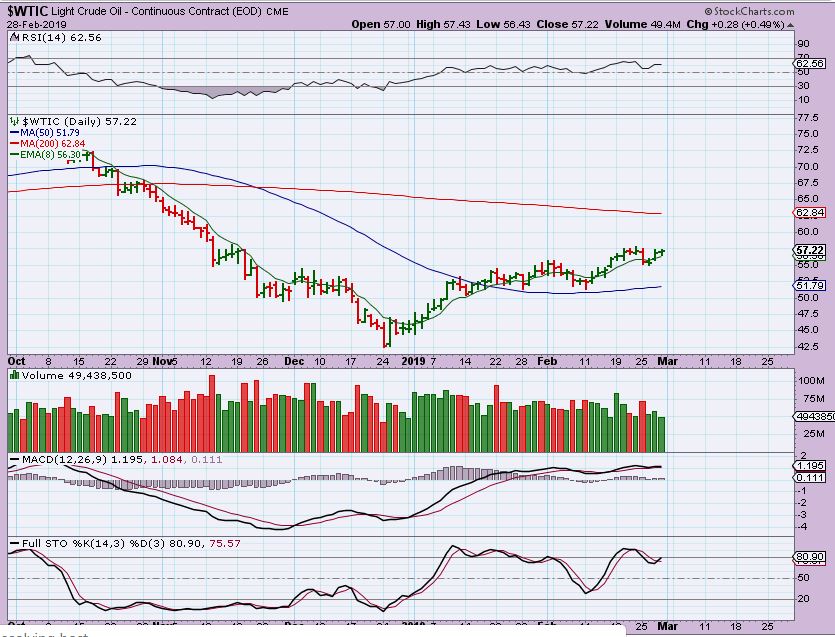
WTIC – Oil had that 1 day dip and then recovered, so Oil itself looks fine.
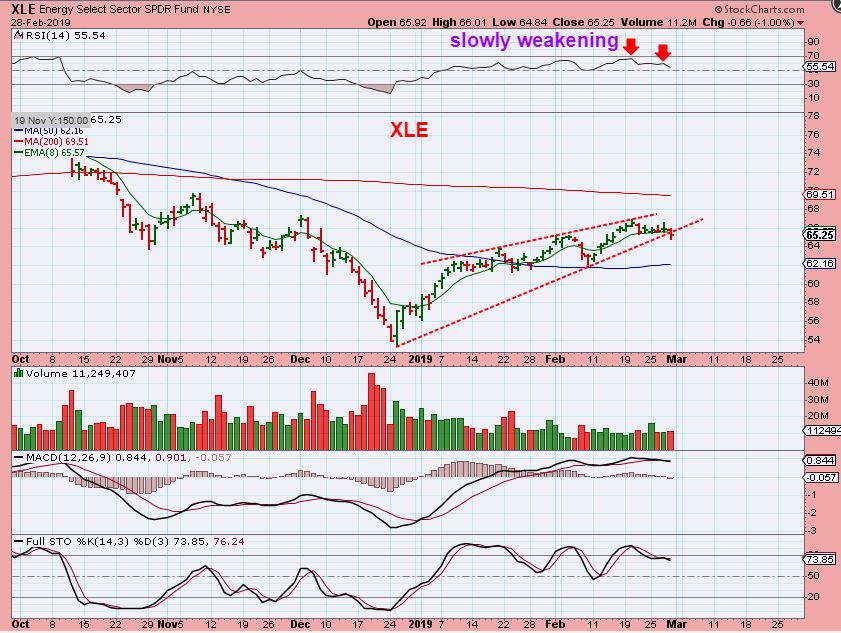
XLE- When OIL dipped down, the Energy sector ignored it, but now this sector looks to be weaker as shown on this chart. Individual stocks are mixed…
OAS – This is an example of what concerns me. Oil reversed higher and OAS lost the 50sma on increasing volume. Personally, that would stop me out for safety sake. After a run from about $4.75 to $7, it stalled and is now looking weak.
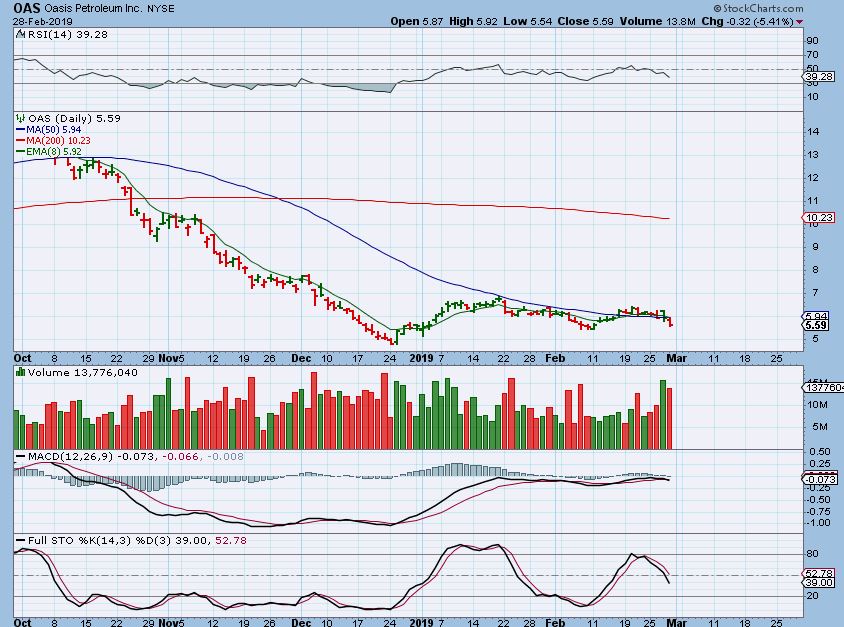
Mixed signals like this have to leave me more cautious, since things become a bit less predictable.
.
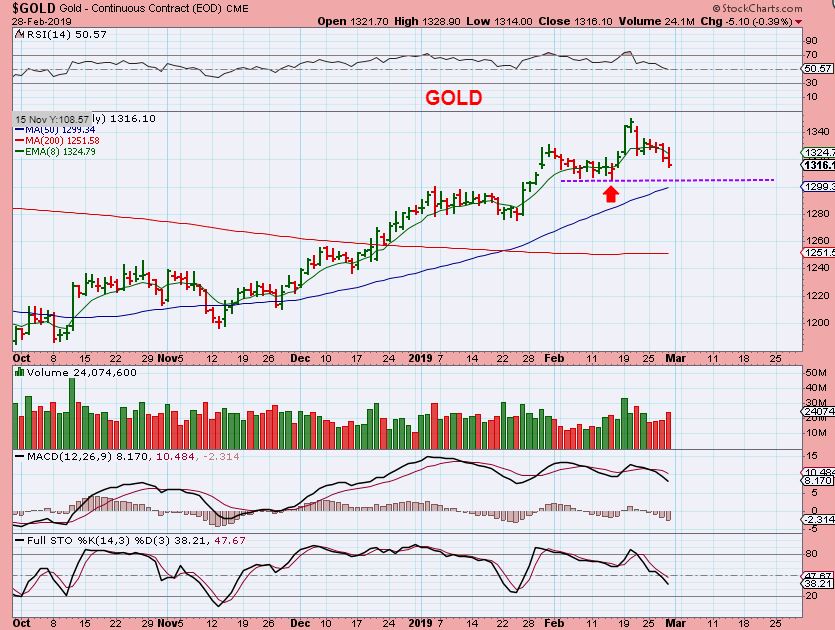
GOLD– Gold continued to drop, but it is a mild pull back at this point. I would expect a deeper drop, maybe to the 200 sma over time, and I will explain things a bit more in the weekend report.
.
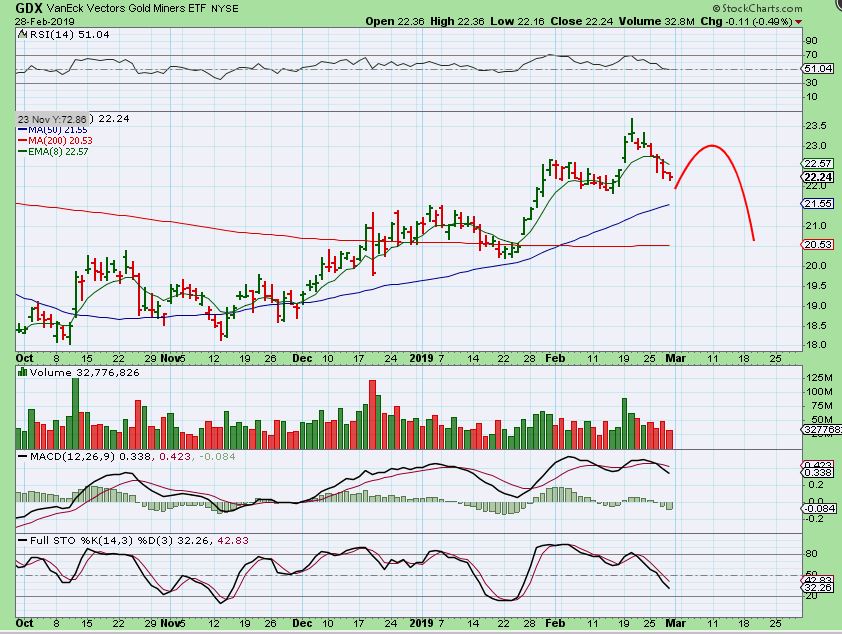
GDX- I’m still expecting a deeper sell off, even if we get a bounce first.
S0 this is the last trading day for the week, and it has been an active week of trading. I am going to discuss a few more things at the end of this report, so read on after I sign off.
.
Enjoy your Friday trading & enjoy your weekend!
.
~ALEX
.
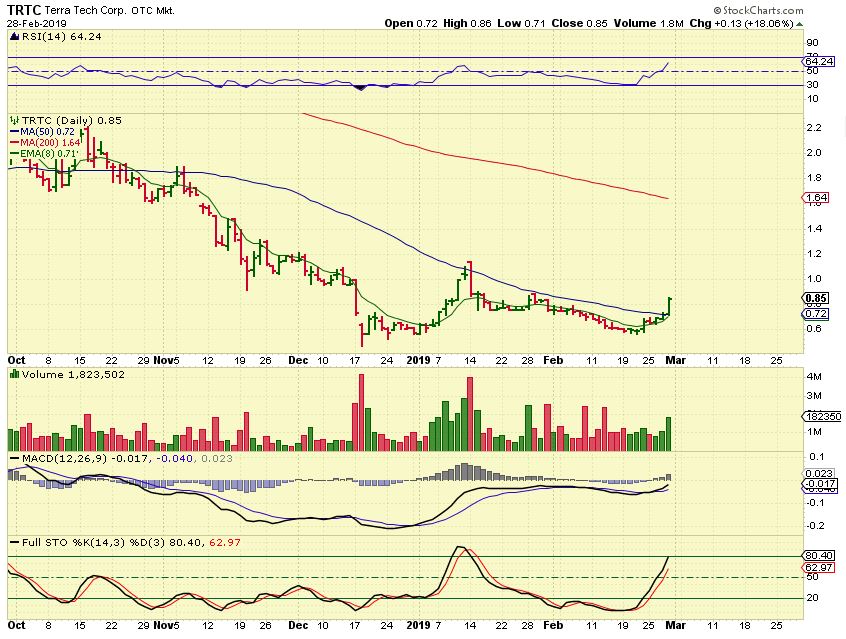
TRTC – You may recall our trade from the $0.60 wedge break to about $1.00 ( the 50sma), and then I stated that I sold mine at the 50sma. After a long crawl under the 50sma, TRTC broke out yesterday & That is a buy too. This may or may not back test the 50sma, but I have pointed out in my reports that they often do over time, so you could put this on a watch list.
1. It can be bought here, Or
2. You can wait and see if it runs for another day or 2 and then dips down for a low risk entry reversing on the 50sma. That is what I often do.
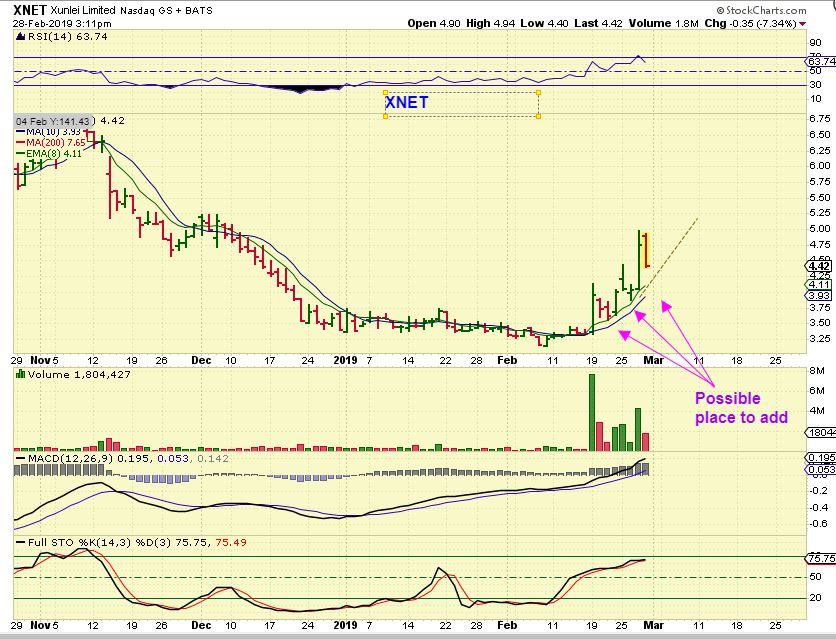
XNET- Just an idea, but remember, this is a bit of a wild one. I mentioned that I sold 1/2 of my position at $4.96 and would consider a possible buy if it pulled back to the 8 ema, since it has landed there on prior dips and reversed. I may or may not buy, because this drop was big yesterday, and I’ll need to see it slow down, tag the 8 ema, and reverse first. At this point it looks like a reversal near $4.11 and a buy near $4.20 is probably how it would play out.
.
I want to just show you something here for you to remember:
.
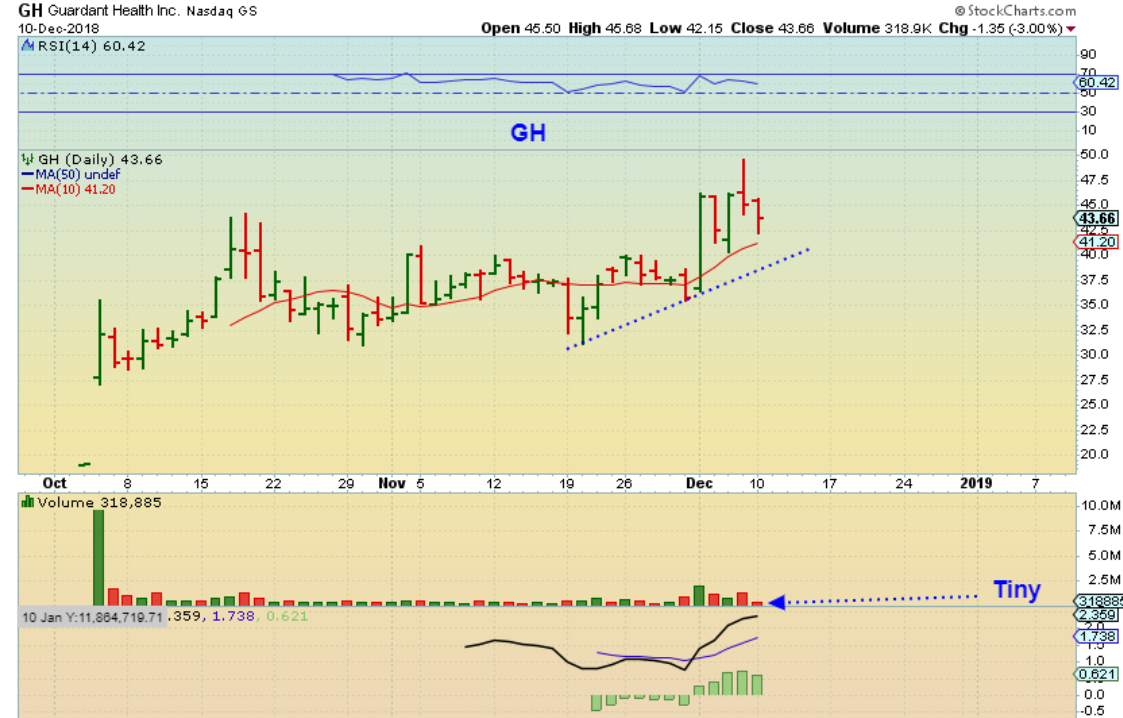
GH– I actually posted this as a buy a few times in December and January and the point that I was making at that time was that as a strong IPO ( $27 to $45 range), there is no resistance when a stock like this breaks out from the base. So far GH had run up but was still chopping sideways. Watch for a solid break out… A break to new highs from a long base can run strongly.
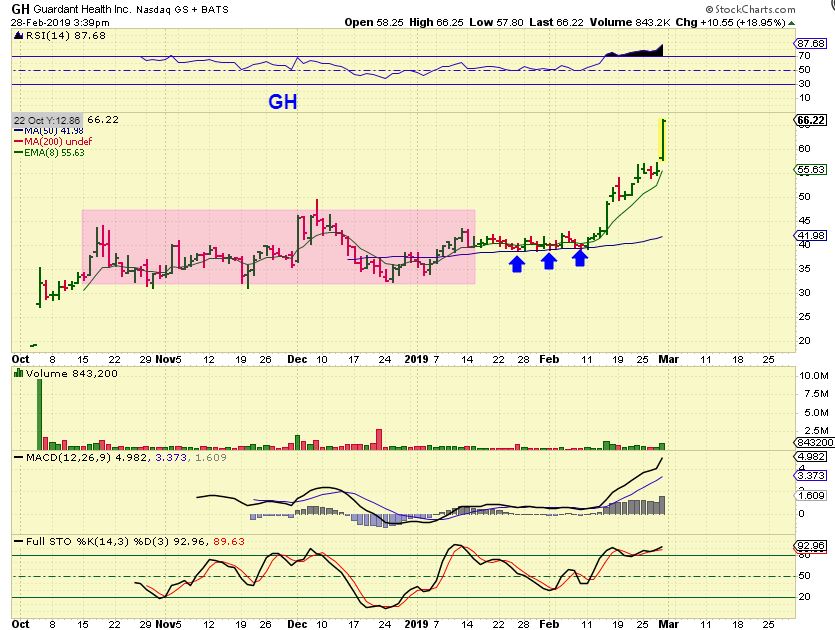
GH- Unfortunately GH sold off and continued to extend that base, but after gaining the 50sma and bullishly bouncing along it, it broke out last week. Notice that once it got above the base, it has just started a climb higher. It is safe to buy a break out to new highs, especially if a long base has formed. At this point you just have to watch and hope to buy a pull back to support or move on & find another one.
.
FINALLY:
I HAVE RECEIVED QUESTIONS AND WE HAVE HAD DISCUSSIONS IN THE LIVE CHAT AREA ABOUT WHAT TO LOOK FOR WITH ‘GOLD SEEKING OUT AN ICL’. USING CYCLES, WE USUALLY LOOK FOR A LONGER TERM TREND LINE BREAK TO HELP US IDENTIFY WHERE AN ICL MIGHT FORM. IN THE WEEKEND REPORT I WANT TO DISCUSS THIS TREND LINE BREAK, AND WHAT I WILL BE LOOKING FOR TO FULFILL THAT REQUIREMENT FOR AN ICL.

